Free Statistics

of Irreproducible Research!

Author's title

Author*Unverified author*
R Software Modulerwasp_autocorrelation.wasp
Title produced by software(Partial) Autocorrelation Function
Date of computationTue, 17 Aug 2010 14:28:39 +0000
Cite this page as followsStatistical Computations at FreeStatistics.org, Office for Research Development and Education, URL https://freestatistics.org/blog/index.php?v=date/2010/Aug/17/t12820553300j6nbjoofhjrzqg.htm/, Retrieved Sat, 27 Apr 2024 10:09:34 +0000
Statistical Computations at FreeStatistics.org, Office for Research Development and Education, URL https://freestatistics.org/blog/index.php?pk=79131, Retrieved Sat, 27 Apr 2024 10:09:34 +0000
QR Codes:

Original text written by user:
IsPrivate?No (this computation is public)
User-defined keywordsKalhöfer Pim
Estimated Impact122
Family? (F = Feedback message, R = changed R code, M = changed R Module, P = changed Parameters, D = changed Data)
-       [(Partial) Autocorrelation Function] [Tijdreeks B Stap 18 ] [2010-08-17 14:28:39] [06ce09a0492afa6d4f67026fd1b7902e] [Current]
Feedback Forum

Post a new message
Dataseries X:
76
75
74
72
70
69
70
72
73
73
74
76
74
67
66
58
55
58
64
68
66
76
75
88
85
83
77
66
65
65
63
62
57
68
69
79
74
76
82
75
75
76
78
77
67
74
68
87
76
88
95
96
96
105
108
113
101
107
102
116
105
121
134
140
131
141
131
128
123
129
125
144
135
141
156
159
146
154
145
133
126
127
122
148


Summary of computational transaction
Raw Inputview raw input (R code)
Raw Outputview raw output of R engine
Computing time2 seconds
R Server'RServer@AstonUniversity' @ vre.aston.ac.uk

\begin{tabular}{lllllllll}
\hline
Summary of computational transaction \tabularnewline
Raw Input & view raw input (R code)  \tabularnewline
Raw Output & view raw output of R engine  \tabularnewline
Computing time & 2 seconds \tabularnewline
R Server & 'RServer@AstonUniversity' @ vre.aston.ac.uk \tabularnewline
\hline
\end{tabular}
%Source: https://freestatistics.org/blog/index.php?pk=79131&T=0

[TABLE]
[ROW][C]Summary of computational transaction[/C][/ROW]
[ROW][C]Raw Input[/C][C]view raw input (R code) [/C][/ROW]
[ROW][C]Raw Output[/C][C]view raw output of R engine [/C][/ROW]
[ROW][C]Computing time[/C][C]2 seconds[/C][/ROW]
[ROW][C]R Server[/C][C]'RServer@AstonUniversity' @ vre.aston.ac.uk[/C][/ROW]
[/TABLE]
Source: https://freestatistics.org/blog/index.php?pk=79131&T=0

Globally Unique Identifier (entire table): ba.freestatistics.org/blog/index.php?pk=79131&T=0

As an alternative you can also use a QR Code:  

The GUIDs for individual cells are displayed in the table below:

Summary of computational transaction
Raw Inputview raw input (R code)
Raw Outputview raw output of R engine
Computing time2 seconds
R Server'RServer@AstonUniversity' @ vre.aston.ac.uk


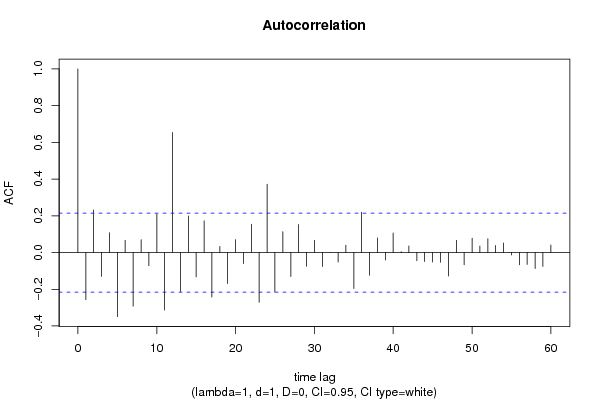
Autocorrelation Function
Time lag kACF(k)T-STATP-value
1-0.257414-2.34520.010703
20.2315092.10910.018973
3-0.129923-1.18370.119964
40.1080950.98480.163795
5-0.349165-3.1810.001032
60.066510.60590.273107
7-0.291941-2.65970.004692
80.0699170.6370.262946
9-0.071336-0.64990.258774
100.2097951.91130.029707
11-0.312855-2.85020.002754
120.6541725.95980
13-0.212432-1.93530.028177
140.1989461.81250.036764
15-0.132719-1.20910.115023
160.1728151.57440.059597
17-0.242369-2.20810.014998
180.0329380.30010.382432
19-0.168654-1.53650.064108
200.0705660.64290.261035
21-0.060081-0.54740.292798
220.1543771.40640.081663
23-0.271331-2.47190.007741
240.3724523.39320.00053
25-0.214388-1.95320.027084
260.1134811.03390.152102
27-0.130418-1.18820.119079
280.1533691.39730.083029
29-0.075241-0.68550.247475
300.0663890.60480.273469
31-0.075951-0.69190.245451
320.0002090.00190.499243
33-0.051857-0.47240.318927
340.0397070.36170.359231
35-0.196052-1.78610.038866
360.219251.99750.024525
37-0.123361-1.12390.132153
380.0795050.72430.235451
39-0.040949-0.37310.355026
400.106910.9740.166445
410.0046840.04270.483031
420.0360990.32890.371539
43-0.044828-0.40840.342015
44-0.049323-0.44940.327173
45-0.05177-0.47160.319208
46-0.053066-0.48350.315024
47-0.128386-1.16970.122744
480.0664440.60530.273303
49-0.066658-0.60730.272661
500.0776730.70760.240577
510.0352010.32070.374622
520.0752870.68590.247343
530.0380980.34710.3647
540.0525120.47840.316811
55-0.013767-0.12540.450245
56-0.066349-0.60450.273592
57-0.064447-0.58710.279351
58-0.08657-0.78870.21627
59-0.075507-0.68790.246717
600.0411770.37510.354256

\begin{tabular}{lllllllll}
\hline
Autocorrelation Function \tabularnewline
Time lag k & ACF(k) & T-STAT & P-value \tabularnewline
1 & -0.257414 & -2.3452 & 0.010703 \tabularnewline
2 & 0.231509 & 2.1091 & 0.018973 \tabularnewline
3 & -0.129923 & -1.1837 & 0.119964 \tabularnewline
4 & 0.108095 & 0.9848 & 0.163795 \tabularnewline
5 & -0.349165 & -3.181 & 0.001032 \tabularnewline
6 & 0.06651 & 0.6059 & 0.273107 \tabularnewline
7 & -0.291941 & -2.6597 & 0.004692 \tabularnewline
8 & 0.069917 & 0.637 & 0.262946 \tabularnewline
9 & -0.071336 & -0.6499 & 0.258774 \tabularnewline
10 & 0.209795 & 1.9113 & 0.029707 \tabularnewline
11 & -0.312855 & -2.8502 & 0.002754 \tabularnewline
12 & 0.654172 & 5.9598 & 0 \tabularnewline
13 & -0.212432 & -1.9353 & 0.028177 \tabularnewline
14 & 0.198946 & 1.8125 & 0.036764 \tabularnewline
15 & -0.132719 & -1.2091 & 0.115023 \tabularnewline
16 & 0.172815 & 1.5744 & 0.059597 \tabularnewline
17 & -0.242369 & -2.2081 & 0.014998 \tabularnewline
18 & 0.032938 & 0.3001 & 0.382432 \tabularnewline
19 & -0.168654 & -1.5365 & 0.064108 \tabularnewline
20 & 0.070566 & 0.6429 & 0.261035 \tabularnewline
21 & -0.060081 & -0.5474 & 0.292798 \tabularnewline
22 & 0.154377 & 1.4064 & 0.081663 \tabularnewline
23 & -0.271331 & -2.4719 & 0.007741 \tabularnewline
24 & 0.372452 & 3.3932 & 0.00053 \tabularnewline
25 & -0.214388 & -1.9532 & 0.027084 \tabularnewline
26 & 0.113481 & 1.0339 & 0.152102 \tabularnewline
27 & -0.130418 & -1.1882 & 0.119079 \tabularnewline
28 & 0.153369 & 1.3973 & 0.083029 \tabularnewline
29 & -0.075241 & -0.6855 & 0.247475 \tabularnewline
30 & 0.066389 & 0.6048 & 0.273469 \tabularnewline
31 & -0.075951 & -0.6919 & 0.245451 \tabularnewline
32 & 0.000209 & 0.0019 & 0.499243 \tabularnewline
33 & -0.051857 & -0.4724 & 0.318927 \tabularnewline
34 & 0.039707 & 0.3617 & 0.359231 \tabularnewline
35 & -0.196052 & -1.7861 & 0.038866 \tabularnewline
36 & 0.21925 & 1.9975 & 0.024525 \tabularnewline
37 & -0.123361 & -1.1239 & 0.132153 \tabularnewline
38 & 0.079505 & 0.7243 & 0.235451 \tabularnewline
39 & -0.040949 & -0.3731 & 0.355026 \tabularnewline
40 & 0.10691 & 0.974 & 0.166445 \tabularnewline
41 & 0.004684 & 0.0427 & 0.483031 \tabularnewline
42 & 0.036099 & 0.3289 & 0.371539 \tabularnewline
43 & -0.044828 & -0.4084 & 0.342015 \tabularnewline
44 & -0.049323 & -0.4494 & 0.327173 \tabularnewline
45 & -0.05177 & -0.4716 & 0.319208 \tabularnewline
46 & -0.053066 & -0.4835 & 0.315024 \tabularnewline
47 & -0.128386 & -1.1697 & 0.122744 \tabularnewline
48 & 0.066444 & 0.6053 & 0.273303 \tabularnewline
49 & -0.066658 & -0.6073 & 0.272661 \tabularnewline
50 & 0.077673 & 0.7076 & 0.240577 \tabularnewline
51 & 0.035201 & 0.3207 & 0.374622 \tabularnewline
52 & 0.075287 & 0.6859 & 0.247343 \tabularnewline
53 & 0.038098 & 0.3471 & 0.3647 \tabularnewline
54 & 0.052512 & 0.4784 & 0.316811 \tabularnewline
55 & -0.013767 & -0.1254 & 0.450245 \tabularnewline
56 & -0.066349 & -0.6045 & 0.273592 \tabularnewline
57 & -0.064447 & -0.5871 & 0.279351 \tabularnewline
58 & -0.08657 & -0.7887 & 0.21627 \tabularnewline
59 & -0.075507 & -0.6879 & 0.246717 \tabularnewline
60 & 0.041177 & 0.3751 & 0.354256 \tabularnewline
\hline
\end{tabular}
%Source: https://freestatistics.org/blog/index.php?pk=79131&T=1

[TABLE]
[ROW][C]Autocorrelation Function[/C][/ROW]
[ROW][C]Time lag k[/C][C]ACF(k)[/C][C]T-STAT[/C][C]P-value[/C][/ROW]
[ROW][C]1[/C][C]-0.257414[/C][C]-2.3452[/C][C]0.010703[/C][/ROW]
[ROW][C]2[/C][C]0.231509[/C][C]2.1091[/C][C]0.018973[/C][/ROW]
[ROW][C]3[/C][C]-0.129923[/C][C]-1.1837[/C][C]0.119964[/C][/ROW]
[ROW][C]4[/C][C]0.108095[/C][C]0.9848[/C][C]0.163795[/C][/ROW]
[ROW][C]5[/C][C]-0.349165[/C][C]-3.181[/C][C]0.001032[/C][/ROW]
[ROW][C]6[/C][C]0.06651[/C][C]0.6059[/C][C]0.273107[/C][/ROW]
[ROW][C]7[/C][C]-0.291941[/C][C]-2.6597[/C][C]0.004692[/C][/ROW]
[ROW][C]8[/C][C]0.069917[/C][C]0.637[/C][C]0.262946[/C][/ROW]
[ROW][C]9[/C][C]-0.071336[/C][C]-0.6499[/C][C]0.258774[/C][/ROW]
[ROW][C]10[/C][C]0.209795[/C][C]1.9113[/C][C]0.029707[/C][/ROW]
[ROW][C]11[/C][C]-0.312855[/C][C]-2.8502[/C][C]0.002754[/C][/ROW]
[ROW][C]12[/C][C]0.654172[/C][C]5.9598[/C][C]0[/C][/ROW]
[ROW][C]13[/C][C]-0.212432[/C][C]-1.9353[/C][C]0.028177[/C][/ROW]
[ROW][C]14[/C][C]0.198946[/C][C]1.8125[/C][C]0.036764[/C][/ROW]
[ROW][C]15[/C][C]-0.132719[/C][C]-1.2091[/C][C]0.115023[/C][/ROW]
[ROW][C]16[/C][C]0.172815[/C][C]1.5744[/C][C]0.059597[/C][/ROW]
[ROW][C]17[/C][C]-0.242369[/C][C]-2.2081[/C][C]0.014998[/C][/ROW]
[ROW][C]18[/C][C]0.032938[/C][C]0.3001[/C][C]0.382432[/C][/ROW]
[ROW][C]19[/C][C]-0.168654[/C][C]-1.5365[/C][C]0.064108[/C][/ROW]
[ROW][C]20[/C][C]0.070566[/C][C]0.6429[/C][C]0.261035[/C][/ROW]
[ROW][C]21[/C][C]-0.060081[/C][C]-0.5474[/C][C]0.292798[/C][/ROW]
[ROW][C]22[/C][C]0.154377[/C][C]1.4064[/C][C]0.081663[/C][/ROW]
[ROW][C]23[/C][C]-0.271331[/C][C]-2.4719[/C][C]0.007741[/C][/ROW]
[ROW][C]24[/C][C]0.372452[/C][C]3.3932[/C][C]0.00053[/C][/ROW]
[ROW][C]25[/C][C]-0.214388[/C][C]-1.9532[/C][C]0.027084[/C][/ROW]
[ROW][C]26[/C][C]0.113481[/C][C]1.0339[/C][C]0.152102[/C][/ROW]
[ROW][C]27[/C][C]-0.130418[/C][C]-1.1882[/C][C]0.119079[/C][/ROW]
[ROW][C]28[/C][C]0.153369[/C][C]1.3973[/C][C]0.083029[/C][/ROW]
[ROW][C]29[/C][C]-0.075241[/C][C]-0.6855[/C][C]0.247475[/C][/ROW]
[ROW][C]30[/C][C]0.066389[/C][C]0.6048[/C][C]0.273469[/C][/ROW]
[ROW][C]31[/C][C]-0.075951[/C][C]-0.6919[/C][C]0.245451[/C][/ROW]
[ROW][C]32[/C][C]0.000209[/C][C]0.0019[/C][C]0.499243[/C][/ROW]
[ROW][C]33[/C][C]-0.051857[/C][C]-0.4724[/C][C]0.318927[/C][/ROW]
[ROW][C]34[/C][C]0.039707[/C][C]0.3617[/C][C]0.359231[/C][/ROW]
[ROW][C]35[/C][C]-0.196052[/C][C]-1.7861[/C][C]0.038866[/C][/ROW]
[ROW][C]36[/C][C]0.21925[/C][C]1.9975[/C][C]0.024525[/C][/ROW]
[ROW][C]37[/C][C]-0.123361[/C][C]-1.1239[/C][C]0.132153[/C][/ROW]
[ROW][C]38[/C][C]0.079505[/C][C]0.7243[/C][C]0.235451[/C][/ROW]
[ROW][C]39[/C][C]-0.040949[/C][C]-0.3731[/C][C]0.355026[/C][/ROW]
[ROW][C]40[/C][C]0.10691[/C][C]0.974[/C][C]0.166445[/C][/ROW]
[ROW][C]41[/C][C]0.004684[/C][C]0.0427[/C][C]0.483031[/C][/ROW]
[ROW][C]42[/C][C]0.036099[/C][C]0.3289[/C][C]0.371539[/C][/ROW]
[ROW][C]43[/C][C]-0.044828[/C][C]-0.4084[/C][C]0.342015[/C][/ROW]
[ROW][C]44[/C][C]-0.049323[/C][C]-0.4494[/C][C]0.327173[/C][/ROW]
[ROW][C]45[/C][C]-0.05177[/C][C]-0.4716[/C][C]0.319208[/C][/ROW]
[ROW][C]46[/C][C]-0.053066[/C][C]-0.4835[/C][C]0.315024[/C][/ROW]
[ROW][C]47[/C][C]-0.128386[/C][C]-1.1697[/C][C]0.122744[/C][/ROW]
[ROW][C]48[/C][C]0.066444[/C][C]0.6053[/C][C]0.273303[/C][/ROW]
[ROW][C]49[/C][C]-0.066658[/C][C]-0.6073[/C][C]0.272661[/C][/ROW]
[ROW][C]50[/C][C]0.077673[/C][C]0.7076[/C][C]0.240577[/C][/ROW]
[ROW][C]51[/C][C]0.035201[/C][C]0.3207[/C][C]0.374622[/C][/ROW]
[ROW][C]52[/C][C]0.075287[/C][C]0.6859[/C][C]0.247343[/C][/ROW]
[ROW][C]53[/C][C]0.038098[/C][C]0.3471[/C][C]0.3647[/C][/ROW]
[ROW][C]54[/C][C]0.052512[/C][C]0.4784[/C][C]0.316811[/C][/ROW]
[ROW][C]55[/C][C]-0.013767[/C][C]-0.1254[/C][C]0.450245[/C][/ROW]
[ROW][C]56[/C][C]-0.066349[/C][C]-0.6045[/C][C]0.273592[/C][/ROW]
[ROW][C]57[/C][C]-0.064447[/C][C]-0.5871[/C][C]0.279351[/C][/ROW]
[ROW][C]58[/C][C]-0.08657[/C][C]-0.7887[/C][C]0.21627[/C][/ROW]
[ROW][C]59[/C][C]-0.075507[/C][C]-0.6879[/C][C]0.246717[/C][/ROW]
[ROW][C]60[/C][C]0.041177[/C][C]0.3751[/C][C]0.354256[/C][/ROW]
[/TABLE]
Source: https://freestatistics.org/blog/index.php?pk=79131&T=1

Globally Unique Identifier (entire table): ba.freestatistics.org/blog/index.php?pk=79131&T=1

As an alternative you can also use a QR Code:  

The GUIDs for individual cells are displayed in the table below:

Autocorrelation Function
Time lag kACF(k)T-STATP-value
1-0.257414-2.34520.010703
20.2315092.10910.018973
3-0.129923-1.18370.119964
40.1080950.98480.163795
5-0.349165-3.1810.001032
60.066510.60590.273107
7-0.291941-2.65970.004692
80.0699170.6370.262946
9-0.071336-0.64990.258774
100.2097951.91130.029707
11-0.312855-2.85020.002754
120.6541725.95980
13-0.212432-1.93530.028177
140.1989461.81250.036764
15-0.132719-1.20910.115023
160.1728151.57440.059597
17-0.242369-2.20810.014998
180.0329380.30010.382432
19-0.168654-1.53650.064108
200.0705660.64290.261035
21-0.060081-0.54740.292798
220.1543771.40640.081663
23-0.271331-2.47190.007741
240.3724523.39320.00053
25-0.214388-1.95320.027084
260.1134811.03390.152102
27-0.130418-1.18820.119079
280.1533691.39730.083029
29-0.075241-0.68550.247475
300.0663890.60480.273469
31-0.075951-0.69190.245451
320.0002090.00190.499243
33-0.051857-0.47240.318927
340.0397070.36170.359231
35-0.196052-1.78610.038866
360.219251.99750.024525
37-0.123361-1.12390.132153
380.0795050.72430.235451
39-0.040949-0.37310.355026
400.106910.9740.166445
410.0046840.04270.483031
420.0360990.32890.371539
43-0.044828-0.40840.342015
44-0.049323-0.44940.327173
45-0.05177-0.47160.319208
46-0.053066-0.48350.315024
47-0.128386-1.16970.122744
480.0664440.60530.273303
49-0.066658-0.60730.272661
500.0776730.70760.240577
510.0352010.32070.374622
520.0752870.68590.247343
530.0380980.34710.3647
540.0525120.47840.316811
55-0.013767-0.12540.450245
56-0.066349-0.60450.273592
57-0.064447-0.58710.279351
58-0.08657-0.78870.21627
59-0.075507-0.68790.246717
600.0411770.37510.354256


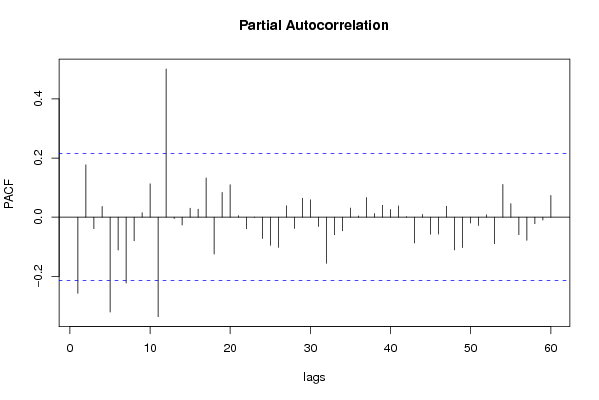
Partial Autocorrelation Function
Time lag kPACF(k)T-STATP-value
1-0.257414-2.34520.010703
20.1769741.61230.055346
3-0.03905-0.35580.36146
40.0358310.32640.372459
5-0.320932-2.92380.002228
6-0.111427-1.01520.156492
7-0.223042-2.0320.022676
8-0.08023-0.73090.233441
90.0147890.13470.446576
100.1126521.02630.153865
11-0.336678-3.06730.001458
120.5013534.56758e-06
13-0.00446-0.04060.483843
14-0.026918-0.24520.403441
150.0303210.27620.391528
160.0269050.24510.403485
170.1324591.20680.115477
18-0.124969-1.13850.129089
190.0836120.76170.224188
200.1098171.00050.159993
210.0048890.04450.482292
22-0.039147-0.35660.361131
23-0.000815-0.00740.497046
24-0.072181-0.65760.256307
25-0.09515-0.86690.19426
26-0.102425-0.93310.176729
270.0381380.34750.364565
28-0.03876-0.35310.362448
290.0642840.58570.279849
300.0585570.53350.297564
31-0.031676-0.28860.386811
32-0.155958-1.42080.079553
33-0.059602-0.5430.294293
34-0.046419-0.42290.336733
350.0306550.27930.390364
360.0037550.03420.486395
370.0662490.60360.273892
380.0125230.11410.454719
390.0399890.36430.358273
400.0262510.23920.405785
410.0377760.34420.365798
420.0014320.0130.494813
43-0.087887-0.80070.212798
440.0092380.08420.466567
45-0.057675-0.52540.300337
46-0.05686-0.5180.302911
470.0369190.33630.368729
48-0.110877-1.01010.157683
49-0.10306-0.93890.175249
50-0.019716-0.17960.428943
51-0.027899-0.25420.399995
520.007710.07020.472085
53-0.090001-0.81990.207297
540.1103081.0050.15892
550.0456840.41620.339168
56-0.059208-0.53940.295524
57-0.078092-0.71150.239399
58-0.021954-0.20.420981
59-0.00996-0.09070.463959
600.0732680.66750.25315

\begin{tabular}{lllllllll}
\hline
Partial Autocorrelation Function \tabularnewline
Time lag k & PACF(k) & T-STAT & P-value \tabularnewline
1 & -0.257414 & -2.3452 & 0.010703 \tabularnewline
2 & 0.176974 & 1.6123 & 0.055346 \tabularnewline
3 & -0.03905 & -0.3558 & 0.36146 \tabularnewline
4 & 0.035831 & 0.3264 & 0.372459 \tabularnewline
5 & -0.320932 & -2.9238 & 0.002228 \tabularnewline
6 & -0.111427 & -1.0152 & 0.156492 \tabularnewline
7 & -0.223042 & -2.032 & 0.022676 \tabularnewline
8 & -0.08023 & -0.7309 & 0.233441 \tabularnewline
9 & 0.014789 & 0.1347 & 0.446576 \tabularnewline
10 & 0.112652 & 1.0263 & 0.153865 \tabularnewline
11 & -0.336678 & -3.0673 & 0.001458 \tabularnewline
12 & 0.501353 & 4.5675 & 8e-06 \tabularnewline
13 & -0.00446 & -0.0406 & 0.483843 \tabularnewline
14 & -0.026918 & -0.2452 & 0.403441 \tabularnewline
15 & 0.030321 & 0.2762 & 0.391528 \tabularnewline
16 & 0.026905 & 0.2451 & 0.403485 \tabularnewline
17 & 0.132459 & 1.2068 & 0.115477 \tabularnewline
18 & -0.124969 & -1.1385 & 0.129089 \tabularnewline
19 & 0.083612 & 0.7617 & 0.224188 \tabularnewline
20 & 0.109817 & 1.0005 & 0.159993 \tabularnewline
21 & 0.004889 & 0.0445 & 0.482292 \tabularnewline
22 & -0.039147 & -0.3566 & 0.361131 \tabularnewline
23 & -0.000815 & -0.0074 & 0.497046 \tabularnewline
24 & -0.072181 & -0.6576 & 0.256307 \tabularnewline
25 & -0.09515 & -0.8669 & 0.19426 \tabularnewline
26 & -0.102425 & -0.9331 & 0.176729 \tabularnewline
27 & 0.038138 & 0.3475 & 0.364565 \tabularnewline
28 & -0.03876 & -0.3531 & 0.362448 \tabularnewline
29 & 0.064284 & 0.5857 & 0.279849 \tabularnewline
30 & 0.058557 & 0.5335 & 0.297564 \tabularnewline
31 & -0.031676 & -0.2886 & 0.386811 \tabularnewline
32 & -0.155958 & -1.4208 & 0.079553 \tabularnewline
33 & -0.059602 & -0.543 & 0.294293 \tabularnewline
34 & -0.046419 & -0.4229 & 0.336733 \tabularnewline
35 & 0.030655 & 0.2793 & 0.390364 \tabularnewline
36 & 0.003755 & 0.0342 & 0.486395 \tabularnewline
37 & 0.066249 & 0.6036 & 0.273892 \tabularnewline
38 & 0.012523 & 0.1141 & 0.454719 \tabularnewline
39 & 0.039989 & 0.3643 & 0.358273 \tabularnewline
40 & 0.026251 & 0.2392 & 0.405785 \tabularnewline
41 & 0.037776 & 0.3442 & 0.365798 \tabularnewline
42 & 0.001432 & 0.013 & 0.494813 \tabularnewline
43 & -0.087887 & -0.8007 & 0.212798 \tabularnewline
44 & 0.009238 & 0.0842 & 0.466567 \tabularnewline
45 & -0.057675 & -0.5254 & 0.300337 \tabularnewline
46 & -0.05686 & -0.518 & 0.302911 \tabularnewline
47 & 0.036919 & 0.3363 & 0.368729 \tabularnewline
48 & -0.110877 & -1.0101 & 0.157683 \tabularnewline
49 & -0.10306 & -0.9389 & 0.175249 \tabularnewline
50 & -0.019716 & -0.1796 & 0.428943 \tabularnewline
51 & -0.027899 & -0.2542 & 0.399995 \tabularnewline
52 & 0.00771 & 0.0702 & 0.472085 \tabularnewline
53 & -0.090001 & -0.8199 & 0.207297 \tabularnewline
54 & 0.110308 & 1.005 & 0.15892 \tabularnewline
55 & 0.045684 & 0.4162 & 0.339168 \tabularnewline
56 & -0.059208 & -0.5394 & 0.295524 \tabularnewline
57 & -0.078092 & -0.7115 & 0.239399 \tabularnewline
58 & -0.021954 & -0.2 & 0.420981 \tabularnewline
59 & -0.00996 & -0.0907 & 0.463959 \tabularnewline
60 & 0.073268 & 0.6675 & 0.25315 \tabularnewline
\hline
\end{tabular}
%Source: https://freestatistics.org/blog/index.php?pk=79131&T=2

[TABLE]
[ROW][C]Partial Autocorrelation Function[/C][/ROW]
[ROW][C]Time lag k[/C][C]PACF(k)[/C][C]T-STAT[/C][C]P-value[/C][/ROW]
[ROW][C]1[/C][C]-0.257414[/C][C]-2.3452[/C][C]0.010703[/C][/ROW]
[ROW][C]2[/C][C]0.176974[/C][C]1.6123[/C][C]0.055346[/C][/ROW]
[ROW][C]3[/C][C]-0.03905[/C][C]-0.3558[/C][C]0.36146[/C][/ROW]
[ROW][C]4[/C][C]0.035831[/C][C]0.3264[/C][C]0.372459[/C][/ROW]
[ROW][C]5[/C][C]-0.320932[/C][C]-2.9238[/C][C]0.002228[/C][/ROW]
[ROW][C]6[/C][C]-0.111427[/C][C]-1.0152[/C][C]0.156492[/C][/ROW]
[ROW][C]7[/C][C]-0.223042[/C][C]-2.032[/C][C]0.022676[/C][/ROW]
[ROW][C]8[/C][C]-0.08023[/C][C]-0.7309[/C][C]0.233441[/C][/ROW]
[ROW][C]9[/C][C]0.014789[/C][C]0.1347[/C][C]0.446576[/C][/ROW]
[ROW][C]10[/C][C]0.112652[/C][C]1.0263[/C][C]0.153865[/C][/ROW]
[ROW][C]11[/C][C]-0.336678[/C][C]-3.0673[/C][C]0.001458[/C][/ROW]
[ROW][C]12[/C][C]0.501353[/C][C]4.5675[/C][C]8e-06[/C][/ROW]
[ROW][C]13[/C][C]-0.00446[/C][C]-0.0406[/C][C]0.483843[/C][/ROW]
[ROW][C]14[/C][C]-0.026918[/C][C]-0.2452[/C][C]0.403441[/C][/ROW]
[ROW][C]15[/C][C]0.030321[/C][C]0.2762[/C][C]0.391528[/C][/ROW]
[ROW][C]16[/C][C]0.026905[/C][C]0.2451[/C][C]0.403485[/C][/ROW]
[ROW][C]17[/C][C]0.132459[/C][C]1.2068[/C][C]0.115477[/C][/ROW]
[ROW][C]18[/C][C]-0.124969[/C][C]-1.1385[/C][C]0.129089[/C][/ROW]
[ROW][C]19[/C][C]0.083612[/C][C]0.7617[/C][C]0.224188[/C][/ROW]
[ROW][C]20[/C][C]0.109817[/C][C]1.0005[/C][C]0.159993[/C][/ROW]
[ROW][C]21[/C][C]0.004889[/C][C]0.0445[/C][C]0.482292[/C][/ROW]
[ROW][C]22[/C][C]-0.039147[/C][C]-0.3566[/C][C]0.361131[/C][/ROW]
[ROW][C]23[/C][C]-0.000815[/C][C]-0.0074[/C][C]0.497046[/C][/ROW]
[ROW][C]24[/C][C]-0.072181[/C][C]-0.6576[/C][C]0.256307[/C][/ROW]
[ROW][C]25[/C][C]-0.09515[/C][C]-0.8669[/C][C]0.19426[/C][/ROW]
[ROW][C]26[/C][C]-0.102425[/C][C]-0.9331[/C][C]0.176729[/C][/ROW]
[ROW][C]27[/C][C]0.038138[/C][C]0.3475[/C][C]0.364565[/C][/ROW]
[ROW][C]28[/C][C]-0.03876[/C][C]-0.3531[/C][C]0.362448[/C][/ROW]
[ROW][C]29[/C][C]0.064284[/C][C]0.5857[/C][C]0.279849[/C][/ROW]
[ROW][C]30[/C][C]0.058557[/C][C]0.5335[/C][C]0.297564[/C][/ROW]
[ROW][C]31[/C][C]-0.031676[/C][C]-0.2886[/C][C]0.386811[/C][/ROW]
[ROW][C]32[/C][C]-0.155958[/C][C]-1.4208[/C][C]0.079553[/C][/ROW]
[ROW][C]33[/C][C]-0.059602[/C][C]-0.543[/C][C]0.294293[/C][/ROW]
[ROW][C]34[/C][C]-0.046419[/C][C]-0.4229[/C][C]0.336733[/C][/ROW]
[ROW][C]35[/C][C]0.030655[/C][C]0.2793[/C][C]0.390364[/C][/ROW]
[ROW][C]36[/C][C]0.003755[/C][C]0.0342[/C][C]0.486395[/C][/ROW]
[ROW][C]37[/C][C]0.066249[/C][C]0.6036[/C][C]0.273892[/C][/ROW]
[ROW][C]38[/C][C]0.012523[/C][C]0.1141[/C][C]0.454719[/C][/ROW]
[ROW][C]39[/C][C]0.039989[/C][C]0.3643[/C][C]0.358273[/C][/ROW]
[ROW][C]40[/C][C]0.026251[/C][C]0.2392[/C][C]0.405785[/C][/ROW]
[ROW][C]41[/C][C]0.037776[/C][C]0.3442[/C][C]0.365798[/C][/ROW]
[ROW][C]42[/C][C]0.001432[/C][C]0.013[/C][C]0.494813[/C][/ROW]
[ROW][C]43[/C][C]-0.087887[/C][C]-0.8007[/C][C]0.212798[/C][/ROW]
[ROW][C]44[/C][C]0.009238[/C][C]0.0842[/C][C]0.466567[/C][/ROW]
[ROW][C]45[/C][C]-0.057675[/C][C]-0.5254[/C][C]0.300337[/C][/ROW]
[ROW][C]46[/C][C]-0.05686[/C][C]-0.518[/C][C]0.302911[/C][/ROW]
[ROW][C]47[/C][C]0.036919[/C][C]0.3363[/C][C]0.368729[/C][/ROW]
[ROW][C]48[/C][C]-0.110877[/C][C]-1.0101[/C][C]0.157683[/C][/ROW]
[ROW][C]49[/C][C]-0.10306[/C][C]-0.9389[/C][C]0.175249[/C][/ROW]
[ROW][C]50[/C][C]-0.019716[/C][C]-0.1796[/C][C]0.428943[/C][/ROW]
[ROW][C]51[/C][C]-0.027899[/C][C]-0.2542[/C][C]0.399995[/C][/ROW]
[ROW][C]52[/C][C]0.00771[/C][C]0.0702[/C][C]0.472085[/C][/ROW]
[ROW][C]53[/C][C]-0.090001[/C][C]-0.8199[/C][C]0.207297[/C][/ROW]
[ROW][C]54[/C][C]0.110308[/C][C]1.005[/C][C]0.15892[/C][/ROW]
[ROW][C]55[/C][C]0.045684[/C][C]0.4162[/C][C]0.339168[/C][/ROW]
[ROW][C]56[/C][C]-0.059208[/C][C]-0.5394[/C][C]0.295524[/C][/ROW]
[ROW][C]57[/C][C]-0.078092[/C][C]-0.7115[/C][C]0.239399[/C][/ROW]
[ROW][C]58[/C][C]-0.021954[/C][C]-0.2[/C][C]0.420981[/C][/ROW]
[ROW][C]59[/C][C]-0.00996[/C][C]-0.0907[/C][C]0.463959[/C][/ROW]
[ROW][C]60[/C][C]0.073268[/C][C]0.6675[/C][C]0.25315[/C][/ROW]
[/TABLE]
Source: https://freestatistics.org/blog/index.php?pk=79131&T=2

Globally Unique Identifier (entire table): ba.freestatistics.org/blog/index.php?pk=79131&T=2

As an alternative you can also use a QR Code:  

The GUIDs for individual cells are displayed in the table below:

Partial Autocorrelation Function
Time lag kPACF(k)T-STATP-value
1-0.257414-2.34520.010703
20.1769741.61230.055346
3-0.03905-0.35580.36146
40.0358310.32640.372459
5-0.320932-2.92380.002228
6-0.111427-1.01520.156492
7-0.223042-2.0320.022676
8-0.08023-0.73090.233441
90.0147890.13470.446576
100.1126521.02630.153865
11-0.336678-3.06730.001458
120.5013534.56758e-06
13-0.00446-0.04060.483843
14-0.026918-0.24520.403441
150.0303210.27620.391528
160.0269050.24510.403485
170.1324591.20680.115477
18-0.124969-1.13850.129089
190.0836120.76170.224188
200.1098171.00050.159993
210.0048890.04450.482292
22-0.039147-0.35660.361131
23-0.000815-0.00740.497046
24-0.072181-0.65760.256307
25-0.09515-0.86690.19426
26-0.102425-0.93310.176729
270.0381380.34750.364565
28-0.03876-0.35310.362448
290.0642840.58570.279849
300.0585570.53350.297564
31-0.031676-0.28860.386811
32-0.155958-1.42080.079553
33-0.059602-0.5430.294293
34-0.046419-0.42290.336733
350.0306550.27930.390364
360.0037550.03420.486395
370.0662490.60360.273892
380.0125230.11410.454719
390.0399890.36430.358273
400.0262510.23920.405785
410.0377760.34420.365798
420.0014320.0130.494813
43-0.087887-0.80070.212798
440.0092380.08420.466567
45-0.057675-0.52540.300337
46-0.05686-0.5180.302911
470.0369190.33630.368729
48-0.110877-1.01010.157683
49-0.10306-0.93890.175249
50-0.019716-0.17960.428943
51-0.027899-0.25420.399995
520.007710.07020.472085
53-0.090001-0.81990.207297
540.1103081.0050.15892
550.0456840.41620.339168
56-0.059208-0.53940.295524
57-0.078092-0.71150.239399
58-0.021954-0.20.420981
59-0.00996-0.09070.463959
600.0732680.66750.25315


Parameters (Session):
par1 = 60 ; par2 = 1 ; par3 = 1 ; par4 = 0 ; par5 = 12 ; par6 = White Noise ; par7 = 0.95 ;
Parameters (R input):
par1 = 60 ; par2 = 1 ; par3 = 1 ; par4 = 0 ; par5 = 12 ; par6 = White Noise ; par7 = 0.95 ;
R code (references can be found in the software module):
if (par1 == 'Default') {
par1 = 10*log10(length(x))
} else {
par1 <- as.numeric(par1)
}
par2 <- as.numeric(par2)
par3 <- as.numeric(par3)
par4 <- as.numeric(par4)
par5 <- as.numeric(par5)
if (par6 == 'White Noise') par6 <- 'white' else par6 <- 'ma'
par7 <- as.numeric(par7)
if (par2 == 0) {
x <- log(x)
} else {
x <- (x ^ par2 - 1) / par2
}
if (par3 > 0) x <- diff(x,lag=1,difference=par3)
if (par4 > 0) x <- diff(x,lag=par5,difference=par4)
bitmap(file='pic1.png')
racf <- acf(x, par1, main='Autocorrelation', xlab='time lag', ylab='ACF', ci.type=par6, ci=par7, sub=paste('(lambda=',par2,', d=',par3,', D=',par4,', CI=', par7, ', CI type=',par6,')',sep=''))
dev.off()
bitmap(file='pic2.png')
rpacf <- pacf(x,par1,main='Partial Autocorrelation',xlab='lags',ylab='PACF')
dev.off()
(myacf <- c(racf$acf))
(mypacf <- c(rpacf$acf))
lengthx <- length(x)
sqrtn <- sqrt(lengthx)
load(file='createtable')
a<-table.start()
a<-table.row.start(a)
a<-table.element(a,'Autocorrelation Function',4,TRUE)
a<-table.row.end(a)
a<-table.row.start(a)
a<-table.element(a,'Time lag k',header=TRUE)
a<-table.element(a,hyperlink('basics.htm','ACF(k)','click here for more information about the Autocorrelation Function'),header=TRUE)
a<-table.element(a,'T-STAT',header=TRUE)
a<-table.element(a,'P-value',header=TRUE)
a<-table.row.end(a)
for (i in 2:(par1+1)) {
a<-table.row.start(a)
a<-table.element(a,i-1,header=TRUE)
a<-table.element(a,round(myacf[i],6))
mytstat <- myacf[i]*sqrtn
a<-table.element(a,round(mytstat,4))
a<-table.element(a,round(1-pt(abs(mytstat),lengthx),6))
a<-table.row.end(a)
}
a<-table.end(a)
table.save(a,file='mytable.tab')
a<-table.start()
a<-table.row.start(a)
a<-table.element(a,'Partial Autocorrelation Function',4,TRUE)
a<-table.row.end(a)
a<-table.row.start(a)
a<-table.element(a,'Time lag k',header=TRUE)
a<-table.element(a,hyperlink('basics.htm','PACF(k)','click here for more information about the Partial Autocorrelation Function'),header=TRUE)
a<-table.element(a,'T-STAT',header=TRUE)
a<-table.element(a,'P-value',header=TRUE)
a<-table.row.end(a)
for (i in 1:par1) {
a<-table.row.start(a)
a<-table.element(a,i,header=TRUE)
a<-table.element(a,round(mypacf[i],6))
mytstat <- mypacf[i]*sqrtn
a<-table.element(a,round(mytstat,4))
a<-table.element(a,round(1-pt(abs(mytstat),lengthx),6))
a<-table.row.end(a)
}
a<-table.end(a)
table.save(a,file='mytable1.tab')