Free Statistics

of Irreproducible Research!

Author's title

Author*Unverified author*
R Software Modulerwasp_autocorrelation.wasp
Title produced by software(Partial) Autocorrelation Function
Date of computationTue, 17 Aug 2010 14:08:28 +0000
Cite this page as followsStatistical Computations at FreeStatistics.org, Office for Research Development and Education, URL https://freestatistics.org/blog/index.php?v=date/2010/Aug/17/t1282054197ldkbn94j9y4b8vc.htm/, Retrieved Sat, 27 Apr 2024 09:19:46 +0000
Statistical Computations at FreeStatistics.org, Office for Research Development and Education, URL https://freestatistics.org/blog/index.php?pk=79128, Retrieved Sat, 27 Apr 2024 09:19:46 +0000
QR Codes:

Original text written by user:
IsPrivate?No (this computation is public)
User-defined keywordsKalhöfer Pim
Estimated Impact130
Family? (F = Feedback message, R = changed R code, M = changed R Module, P = changed Parameters, D = changed Data)
-       [(Partial) Autocorrelation Function] [Tijdreeks B Stap 17] [2010-08-17 14:08:28] [06ce09a0492afa6d4f67026fd1b7902e] [Current]
Feedback Forum

Post a new message
Dataseries X:
76
75
74
72
70
69
70
72
73
73
74
76
74
67
66
58
55
58
64
68
66
76
75
88
85
83
77
66
65
65
63
62
57
68
69
79
74
76
82
75
75
76
78
77
67
74
68
87
76
88
95
96
96
105
108
113
101
107
102
116
105
121
134
140
131
141
131
128
123
129
125
144
135
141
156
159
146
154
145
133
126
127
122
148


Summary of computational transaction
Raw Inputview raw input (R code)
Raw Outputview raw output of R engine
Computing time2 seconds
R Server'George Udny Yule' @ 72.249.76.132

\begin{tabular}{lllllllll}
\hline
Summary of computational transaction \tabularnewline
Raw Input & view raw input (R code)  \tabularnewline
Raw Output & view raw output of R engine  \tabularnewline
Computing time & 2 seconds \tabularnewline
R Server & 'George Udny Yule' @ 72.249.76.132 \tabularnewline
\hline
\end{tabular}
%Source: https://freestatistics.org/blog/index.php?pk=79128&T=0

[TABLE]
[ROW][C]Summary of computational transaction[/C][/ROW]
[ROW][C]Raw Input[/C][C]view raw input (R code) [/C][/ROW]
[ROW][C]Raw Output[/C][C]view raw output of R engine [/C][/ROW]
[ROW][C]Computing time[/C][C]2 seconds[/C][/ROW]
[ROW][C]R Server[/C][C]'George Udny Yule' @ 72.249.76.132[/C][/ROW]
[/TABLE]
Source: https://freestatistics.org/blog/index.php?pk=79128&T=0

Globally Unique Identifier (entire table): ba.freestatistics.org/blog/index.php?pk=79128&T=0

As an alternative you can also use a QR Code:  

The GUIDs for individual cells are displayed in the table below:

Summary of computational transaction
Raw Inputview raw input (R code)
Raw Outputview raw output of R engine
Computing time2 seconds
R Server'George Udny Yule' @ 72.249.76.132


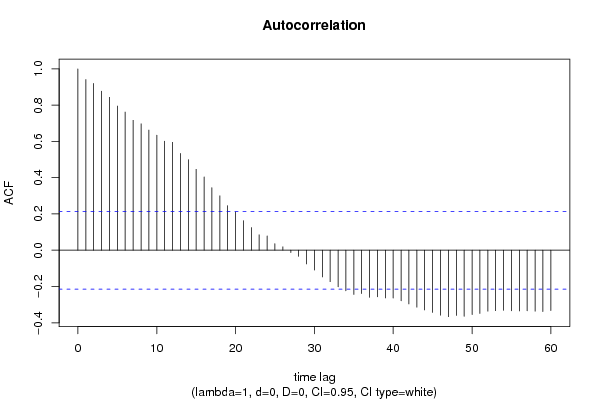
Autocorrelation Function
Time lag kACF(k)T-STATP-value
10.9415338.62930
20.9199648.43160
30.8772358.040
40.8433747.72960
50.7953047.28910
60.7620846.98460
70.7166076.56780
80.697486.39250
90.6628396.0750
100.6344455.81480
110.6015385.51320
120.5951275.45440
130.5338184.89252e-06
140.4992694.57598e-06
150.4463874.09124.9e-05
160.4045613.70790.000187
170.3448993.1610.001093
180.3000262.74980.00365
190.2457382.25220.013458
200.2109691.93360.028267
210.1628941.4930.069598
220.1251131.14670.127384
230.0849320.77840.219256
240.0787760.7220.236151
250.0364720.33430.369503
260.0189190.17340.431378
27-0.012555-0.11510.454331
28-0.03364-0.30830.379303
29-0.075707-0.69390.244842
30-0.109492-1.00350.159249
31-0.147094-1.34810.090619
32-0.173552-1.59060.057725
33-0.202044-1.85180.033786
34-0.224054-2.05350.021568
35-0.244035-2.23660.013981
36-0.238963-2.19010.015643
37-0.259487-2.37820.009832
38-0.256877-2.35430.010445
39-0.263235-2.41260.009008
40-0.263488-2.41490.008955
41-0.279248-2.55930.006139
42-0.296288-2.71550.004016
43-0.314342-2.8810.002515
44-0.329115-3.01640.001692
45-0.34336-3.14690.001142
46-0.357948-3.28060.000755
47-0.366326-3.35740.000592
48-0.359716-3.29690.000717
49-0.364796-3.34340.000619
50-0.355023-3.25380.000821
51-0.348541-3.19440.000987
52-0.336223-3.08150.001392
53-0.333133-3.05320.001516
54-0.331352-3.03690.001592
55-0.334121-3.06230.001475
56-0.334678-3.06740.001453
57-0.334335-3.06420.001467
58-0.336317-3.08240.001389
59-0.338163-3.09930.00132
60-0.332907-3.05110.001525

\begin{tabular}{lllllllll}
\hline
Autocorrelation Function \tabularnewline
Time lag k & ACF(k) & T-STAT & P-value \tabularnewline
1 & 0.941533 & 8.6293 & 0 \tabularnewline
2 & 0.919964 & 8.4316 & 0 \tabularnewline
3 & 0.877235 & 8.04 & 0 \tabularnewline
4 & 0.843374 & 7.7296 & 0 \tabularnewline
5 & 0.795304 & 7.2891 & 0 \tabularnewline
6 & 0.762084 & 6.9846 & 0 \tabularnewline
7 & 0.716607 & 6.5678 & 0 \tabularnewline
8 & 0.69748 & 6.3925 & 0 \tabularnewline
9 & 0.662839 & 6.075 & 0 \tabularnewline
10 & 0.634445 & 5.8148 & 0 \tabularnewline
11 & 0.601538 & 5.5132 & 0 \tabularnewline
12 & 0.595127 & 5.4544 & 0 \tabularnewline
13 & 0.533818 & 4.8925 & 2e-06 \tabularnewline
14 & 0.499269 & 4.5759 & 8e-06 \tabularnewline
15 & 0.446387 & 4.0912 & 4.9e-05 \tabularnewline
16 & 0.404561 & 3.7079 & 0.000187 \tabularnewline
17 & 0.344899 & 3.161 & 0.001093 \tabularnewline
18 & 0.300026 & 2.7498 & 0.00365 \tabularnewline
19 & 0.245738 & 2.2522 & 0.013458 \tabularnewline
20 & 0.210969 & 1.9336 & 0.028267 \tabularnewline
21 & 0.162894 & 1.493 & 0.069598 \tabularnewline
22 & 0.125113 & 1.1467 & 0.127384 \tabularnewline
23 & 0.084932 & 0.7784 & 0.219256 \tabularnewline
24 & 0.078776 & 0.722 & 0.236151 \tabularnewline
25 & 0.036472 & 0.3343 & 0.369503 \tabularnewline
26 & 0.018919 & 0.1734 & 0.431378 \tabularnewline
27 & -0.012555 & -0.1151 & 0.454331 \tabularnewline
28 & -0.03364 & -0.3083 & 0.379303 \tabularnewline
29 & -0.075707 & -0.6939 & 0.244842 \tabularnewline
30 & -0.109492 & -1.0035 & 0.159249 \tabularnewline
31 & -0.147094 & -1.3481 & 0.090619 \tabularnewline
32 & -0.173552 & -1.5906 & 0.057725 \tabularnewline
33 & -0.202044 & -1.8518 & 0.033786 \tabularnewline
34 & -0.224054 & -2.0535 & 0.021568 \tabularnewline
35 & -0.244035 & -2.2366 & 0.013981 \tabularnewline
36 & -0.238963 & -2.1901 & 0.015643 \tabularnewline
37 & -0.259487 & -2.3782 & 0.009832 \tabularnewline
38 & -0.256877 & -2.3543 & 0.010445 \tabularnewline
39 & -0.263235 & -2.4126 & 0.009008 \tabularnewline
40 & -0.263488 & -2.4149 & 0.008955 \tabularnewline
41 & -0.279248 & -2.5593 & 0.006139 \tabularnewline
42 & -0.296288 & -2.7155 & 0.004016 \tabularnewline
43 & -0.314342 & -2.881 & 0.002515 \tabularnewline
44 & -0.329115 & -3.0164 & 0.001692 \tabularnewline
45 & -0.34336 & -3.1469 & 0.001142 \tabularnewline
46 & -0.357948 & -3.2806 & 0.000755 \tabularnewline
47 & -0.366326 & -3.3574 & 0.000592 \tabularnewline
48 & -0.359716 & -3.2969 & 0.000717 \tabularnewline
49 & -0.364796 & -3.3434 & 0.000619 \tabularnewline
50 & -0.355023 & -3.2538 & 0.000821 \tabularnewline
51 & -0.348541 & -3.1944 & 0.000987 \tabularnewline
52 & -0.336223 & -3.0815 & 0.001392 \tabularnewline
53 & -0.333133 & -3.0532 & 0.001516 \tabularnewline
54 & -0.331352 & -3.0369 & 0.001592 \tabularnewline
55 & -0.334121 & -3.0623 & 0.001475 \tabularnewline
56 & -0.334678 & -3.0674 & 0.001453 \tabularnewline
57 & -0.334335 & -3.0642 & 0.001467 \tabularnewline
58 & -0.336317 & -3.0824 & 0.001389 \tabularnewline
59 & -0.338163 & -3.0993 & 0.00132 \tabularnewline
60 & -0.332907 & -3.0511 & 0.001525 \tabularnewline
\hline
\end{tabular}
%Source: https://freestatistics.org/blog/index.php?pk=79128&T=1

[TABLE]
[ROW][C]Autocorrelation Function[/C][/ROW]
[ROW][C]Time lag k[/C][C]ACF(k)[/C][C]T-STAT[/C][C]P-value[/C][/ROW]
[ROW][C]1[/C][C]0.941533[/C][C]8.6293[/C][C]0[/C][/ROW]
[ROW][C]2[/C][C]0.919964[/C][C]8.4316[/C][C]0[/C][/ROW]
[ROW][C]3[/C][C]0.877235[/C][C]8.04[/C][C]0[/C][/ROW]
[ROW][C]4[/C][C]0.843374[/C][C]7.7296[/C][C]0[/C][/ROW]
[ROW][C]5[/C][C]0.795304[/C][C]7.2891[/C][C]0[/C][/ROW]
[ROW][C]6[/C][C]0.762084[/C][C]6.9846[/C][C]0[/C][/ROW]
[ROW][C]7[/C][C]0.716607[/C][C]6.5678[/C][C]0[/C][/ROW]
[ROW][C]8[/C][C]0.69748[/C][C]6.3925[/C][C]0[/C][/ROW]
[ROW][C]9[/C][C]0.662839[/C][C]6.075[/C][C]0[/C][/ROW]
[ROW][C]10[/C][C]0.634445[/C][C]5.8148[/C][C]0[/C][/ROW]
[ROW][C]11[/C][C]0.601538[/C][C]5.5132[/C][C]0[/C][/ROW]
[ROW][C]12[/C][C]0.595127[/C][C]5.4544[/C][C]0[/C][/ROW]
[ROW][C]13[/C][C]0.533818[/C][C]4.8925[/C][C]2e-06[/C][/ROW]
[ROW][C]14[/C][C]0.499269[/C][C]4.5759[/C][C]8e-06[/C][/ROW]
[ROW][C]15[/C][C]0.446387[/C][C]4.0912[/C][C]4.9e-05[/C][/ROW]
[ROW][C]16[/C][C]0.404561[/C][C]3.7079[/C][C]0.000187[/C][/ROW]
[ROW][C]17[/C][C]0.344899[/C][C]3.161[/C][C]0.001093[/C][/ROW]
[ROW][C]18[/C][C]0.300026[/C][C]2.7498[/C][C]0.00365[/C][/ROW]
[ROW][C]19[/C][C]0.245738[/C][C]2.2522[/C][C]0.013458[/C][/ROW]
[ROW][C]20[/C][C]0.210969[/C][C]1.9336[/C][C]0.028267[/C][/ROW]
[ROW][C]21[/C][C]0.162894[/C][C]1.493[/C][C]0.069598[/C][/ROW]
[ROW][C]22[/C][C]0.125113[/C][C]1.1467[/C][C]0.127384[/C][/ROW]
[ROW][C]23[/C][C]0.084932[/C][C]0.7784[/C][C]0.219256[/C][/ROW]
[ROW][C]24[/C][C]0.078776[/C][C]0.722[/C][C]0.236151[/C][/ROW]
[ROW][C]25[/C][C]0.036472[/C][C]0.3343[/C][C]0.369503[/C][/ROW]
[ROW][C]26[/C][C]0.018919[/C][C]0.1734[/C][C]0.431378[/C][/ROW]
[ROW][C]27[/C][C]-0.012555[/C][C]-0.1151[/C][C]0.454331[/C][/ROW]
[ROW][C]28[/C][C]-0.03364[/C][C]-0.3083[/C][C]0.379303[/C][/ROW]
[ROW][C]29[/C][C]-0.075707[/C][C]-0.6939[/C][C]0.244842[/C][/ROW]
[ROW][C]30[/C][C]-0.109492[/C][C]-1.0035[/C][C]0.159249[/C][/ROW]
[ROW][C]31[/C][C]-0.147094[/C][C]-1.3481[/C][C]0.090619[/C][/ROW]
[ROW][C]32[/C][C]-0.173552[/C][C]-1.5906[/C][C]0.057725[/C][/ROW]
[ROW][C]33[/C][C]-0.202044[/C][C]-1.8518[/C][C]0.033786[/C][/ROW]
[ROW][C]34[/C][C]-0.224054[/C][C]-2.0535[/C][C]0.021568[/C][/ROW]
[ROW][C]35[/C][C]-0.244035[/C][C]-2.2366[/C][C]0.013981[/C][/ROW]
[ROW][C]36[/C][C]-0.238963[/C][C]-2.1901[/C][C]0.015643[/C][/ROW]
[ROW][C]37[/C][C]-0.259487[/C][C]-2.3782[/C][C]0.009832[/C][/ROW]
[ROW][C]38[/C][C]-0.256877[/C][C]-2.3543[/C][C]0.010445[/C][/ROW]
[ROW][C]39[/C][C]-0.263235[/C][C]-2.4126[/C][C]0.009008[/C][/ROW]
[ROW][C]40[/C][C]-0.263488[/C][C]-2.4149[/C][C]0.008955[/C][/ROW]
[ROW][C]41[/C][C]-0.279248[/C][C]-2.5593[/C][C]0.006139[/C][/ROW]
[ROW][C]42[/C][C]-0.296288[/C][C]-2.7155[/C][C]0.004016[/C][/ROW]
[ROW][C]43[/C][C]-0.314342[/C][C]-2.881[/C][C]0.002515[/C][/ROW]
[ROW][C]44[/C][C]-0.329115[/C][C]-3.0164[/C][C]0.001692[/C][/ROW]
[ROW][C]45[/C][C]-0.34336[/C][C]-3.1469[/C][C]0.001142[/C][/ROW]
[ROW][C]46[/C][C]-0.357948[/C][C]-3.2806[/C][C]0.000755[/C][/ROW]
[ROW][C]47[/C][C]-0.366326[/C][C]-3.3574[/C][C]0.000592[/C][/ROW]
[ROW][C]48[/C][C]-0.359716[/C][C]-3.2969[/C][C]0.000717[/C][/ROW]
[ROW][C]49[/C][C]-0.364796[/C][C]-3.3434[/C][C]0.000619[/C][/ROW]
[ROW][C]50[/C][C]-0.355023[/C][C]-3.2538[/C][C]0.000821[/C][/ROW]
[ROW][C]51[/C][C]-0.348541[/C][C]-3.1944[/C][C]0.000987[/C][/ROW]
[ROW][C]52[/C][C]-0.336223[/C][C]-3.0815[/C][C]0.001392[/C][/ROW]
[ROW][C]53[/C][C]-0.333133[/C][C]-3.0532[/C][C]0.001516[/C][/ROW]
[ROW][C]54[/C][C]-0.331352[/C][C]-3.0369[/C][C]0.001592[/C][/ROW]
[ROW][C]55[/C][C]-0.334121[/C][C]-3.0623[/C][C]0.001475[/C][/ROW]
[ROW][C]56[/C][C]-0.334678[/C][C]-3.0674[/C][C]0.001453[/C][/ROW]
[ROW][C]57[/C][C]-0.334335[/C][C]-3.0642[/C][C]0.001467[/C][/ROW]
[ROW][C]58[/C][C]-0.336317[/C][C]-3.0824[/C][C]0.001389[/C][/ROW]
[ROW][C]59[/C][C]-0.338163[/C][C]-3.0993[/C][C]0.00132[/C][/ROW]
[ROW][C]60[/C][C]-0.332907[/C][C]-3.0511[/C][C]0.001525[/C][/ROW]
[/TABLE]
Source: https://freestatistics.org/blog/index.php?pk=79128&T=1

Globally Unique Identifier (entire table): ba.freestatistics.org/blog/index.php?pk=79128&T=1

As an alternative you can also use a QR Code:  

The GUIDs for individual cells are displayed in the table below:

Autocorrelation Function
Time lag kACF(k)T-STATP-value
10.9415338.62930
20.9199648.43160
30.8772358.040
40.8433747.72960
50.7953047.28910
60.7620846.98460
70.7166076.56780
80.697486.39250
90.6628396.0750
100.6344455.81480
110.6015385.51320
120.5951275.45440
130.5338184.89252e-06
140.4992694.57598e-06
150.4463874.09124.9e-05
160.4045613.70790.000187
170.3448993.1610.001093
180.3000262.74980.00365
190.2457382.25220.013458
200.2109691.93360.028267
210.1628941.4930.069598
220.1251131.14670.127384
230.0849320.77840.219256
240.0787760.7220.236151
250.0364720.33430.369503
260.0189190.17340.431378
27-0.012555-0.11510.454331
28-0.03364-0.30830.379303
29-0.075707-0.69390.244842
30-0.109492-1.00350.159249
31-0.147094-1.34810.090619
32-0.173552-1.59060.057725
33-0.202044-1.85180.033786
34-0.224054-2.05350.021568
35-0.244035-2.23660.013981
36-0.238963-2.19010.015643
37-0.259487-2.37820.009832
38-0.256877-2.35430.010445
39-0.263235-2.41260.009008
40-0.263488-2.41490.008955
41-0.279248-2.55930.006139
42-0.296288-2.71550.004016
43-0.314342-2.8810.002515
44-0.329115-3.01640.001692
45-0.34336-3.14690.001142
46-0.357948-3.28060.000755
47-0.366326-3.35740.000592
48-0.359716-3.29690.000717
49-0.364796-3.34340.000619
50-0.355023-3.25380.000821
51-0.348541-3.19440.000987
52-0.336223-3.08150.001392
53-0.333133-3.05320.001516
54-0.331352-3.03690.001592
55-0.334121-3.06230.001475
56-0.334678-3.06740.001453
57-0.334335-3.06420.001467
58-0.336317-3.08240.001389
59-0.338163-3.09930.00132
60-0.332907-3.05110.001525


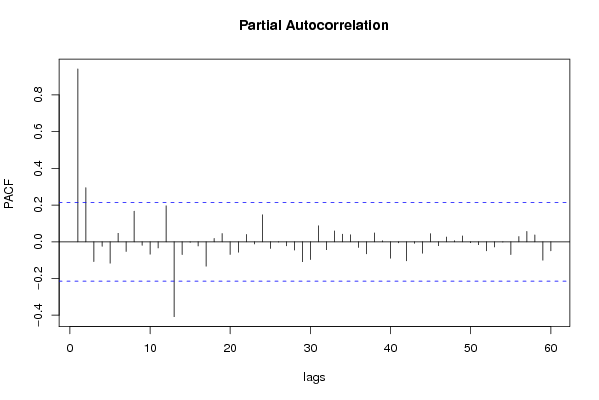
Partial Autocorrelation Function
Time lag kPACF(k)T-STATP-value
10.9415338.62930
20.2949392.70320.004155
3-0.107745-0.98750.163117
4-0.024737-0.22670.410598
5-0.116804-1.07050.143725
60.046510.42630.3355
7-0.052375-0.480.31623
80.1669421.530.064881
9-0.019146-0.17550.430565
10-0.067376-0.61750.269284
11-0.033062-0.3030.381312
120.1963921.80.037729
13-0.407679-3.73640.00017
14-0.069745-0.63920.262207
15-0.002815-0.02580.48974
16-0.022214-0.20360.419583
17-0.132547-1.21480.11392
180.0181120.1660.434278
190.0448230.41080.341129
20-0.068573-0.62850.265697
21-0.05628-0.51580.30367
220.0401440.36790.356927
23-0.011559-0.10590.457941
240.1472681.34970.090363
25-0.036131-0.33110.370678
26-0.00155-0.01420.494349
27-0.021838-0.20010.420924
28-0.044979-0.41220.340608
29-0.108328-0.99280.16182
30-0.096836-0.88750.188668
310.0873660.80070.212775
32-0.043203-0.3960.346567
330.058950.54030.295215
340.0417530.38270.351463
350.0381450.34960.363755
36-0.030858-0.28280.389005
37-0.065583-0.60110.274702
380.0483230.44290.329493
390.005460.050.480104
40-0.08925-0.8180.207838
41-0.005566-0.0510.479717
42-0.103459-0.94820.172869
43-0.008127-0.07450.470399
44-0.061868-0.5670.286104
450.044150.40460.343385
46-0.020809-0.19070.424603
470.0260590.23880.405908
480.0063570.05830.47684
490.0321860.2950.384365
50-0.004565-0.04180.483364
51-0.015553-0.14250.443496
52-0.049383-0.45260.326001
53-0.027707-0.25390.400082
54-0.001211-0.01110.495585
55-0.069428-0.63630.26315
560.0282910.25930.398024
570.0562660.51570.303713
580.0371970.34090.367011
59-0.100096-0.91740.18078
60-0.048986-0.4490.327307

\begin{tabular}{lllllllll}
\hline
Partial Autocorrelation Function \tabularnewline
Time lag k & PACF(k) & T-STAT & P-value \tabularnewline
1 & 0.941533 & 8.6293 & 0 \tabularnewline
2 & 0.294939 & 2.7032 & 0.004155 \tabularnewline
3 & -0.107745 & -0.9875 & 0.163117 \tabularnewline
4 & -0.024737 & -0.2267 & 0.410598 \tabularnewline
5 & -0.116804 & -1.0705 & 0.143725 \tabularnewline
6 & 0.04651 & 0.4263 & 0.3355 \tabularnewline
7 & -0.052375 & -0.48 & 0.31623 \tabularnewline
8 & 0.166942 & 1.53 & 0.064881 \tabularnewline
9 & -0.019146 & -0.1755 & 0.430565 \tabularnewline
10 & -0.067376 & -0.6175 & 0.269284 \tabularnewline
11 & -0.033062 & -0.303 & 0.381312 \tabularnewline
12 & 0.196392 & 1.8 & 0.037729 \tabularnewline
13 & -0.407679 & -3.7364 & 0.00017 \tabularnewline
14 & -0.069745 & -0.6392 & 0.262207 \tabularnewline
15 & -0.002815 & -0.0258 & 0.48974 \tabularnewline
16 & -0.022214 & -0.2036 & 0.419583 \tabularnewline
17 & -0.132547 & -1.2148 & 0.11392 \tabularnewline
18 & 0.018112 & 0.166 & 0.434278 \tabularnewline
19 & 0.044823 & 0.4108 & 0.341129 \tabularnewline
20 & -0.068573 & -0.6285 & 0.265697 \tabularnewline
21 & -0.05628 & -0.5158 & 0.30367 \tabularnewline
22 & 0.040144 & 0.3679 & 0.356927 \tabularnewline
23 & -0.011559 & -0.1059 & 0.457941 \tabularnewline
24 & 0.147268 & 1.3497 & 0.090363 \tabularnewline
25 & -0.036131 & -0.3311 & 0.370678 \tabularnewline
26 & -0.00155 & -0.0142 & 0.494349 \tabularnewline
27 & -0.021838 & -0.2001 & 0.420924 \tabularnewline
28 & -0.044979 & -0.4122 & 0.340608 \tabularnewline
29 & -0.108328 & -0.9928 & 0.16182 \tabularnewline
30 & -0.096836 & -0.8875 & 0.188668 \tabularnewline
31 & 0.087366 & 0.8007 & 0.212775 \tabularnewline
32 & -0.043203 & -0.396 & 0.346567 \tabularnewline
33 & 0.05895 & 0.5403 & 0.295215 \tabularnewline
34 & 0.041753 & 0.3827 & 0.351463 \tabularnewline
35 & 0.038145 & 0.3496 & 0.363755 \tabularnewline
36 & -0.030858 & -0.2828 & 0.389005 \tabularnewline
37 & -0.065583 & -0.6011 & 0.274702 \tabularnewline
38 & 0.048323 & 0.4429 & 0.329493 \tabularnewline
39 & 0.00546 & 0.05 & 0.480104 \tabularnewline
40 & -0.08925 & -0.818 & 0.207838 \tabularnewline
41 & -0.005566 & -0.051 & 0.479717 \tabularnewline
42 & -0.103459 & -0.9482 & 0.172869 \tabularnewline
43 & -0.008127 & -0.0745 & 0.470399 \tabularnewline
44 & -0.061868 & -0.567 & 0.286104 \tabularnewline
45 & 0.04415 & 0.4046 & 0.343385 \tabularnewline
46 & -0.020809 & -0.1907 & 0.424603 \tabularnewline
47 & 0.026059 & 0.2388 & 0.405908 \tabularnewline
48 & 0.006357 & 0.0583 & 0.47684 \tabularnewline
49 & 0.032186 & 0.295 & 0.384365 \tabularnewline
50 & -0.004565 & -0.0418 & 0.483364 \tabularnewline
51 & -0.015553 & -0.1425 & 0.443496 \tabularnewline
52 & -0.049383 & -0.4526 & 0.326001 \tabularnewline
53 & -0.027707 & -0.2539 & 0.400082 \tabularnewline
54 & -0.001211 & -0.0111 & 0.495585 \tabularnewline
55 & -0.069428 & -0.6363 & 0.26315 \tabularnewline
56 & 0.028291 & 0.2593 & 0.398024 \tabularnewline
57 & 0.056266 & 0.5157 & 0.303713 \tabularnewline
58 & 0.037197 & 0.3409 & 0.367011 \tabularnewline
59 & -0.100096 & -0.9174 & 0.18078 \tabularnewline
60 & -0.048986 & -0.449 & 0.327307 \tabularnewline
\hline
\end{tabular}
%Source: https://freestatistics.org/blog/index.php?pk=79128&T=2

[TABLE]
[ROW][C]Partial Autocorrelation Function[/C][/ROW]
[ROW][C]Time lag k[/C][C]PACF(k)[/C][C]T-STAT[/C][C]P-value[/C][/ROW]
[ROW][C]1[/C][C]0.941533[/C][C]8.6293[/C][C]0[/C][/ROW]
[ROW][C]2[/C][C]0.294939[/C][C]2.7032[/C][C]0.004155[/C][/ROW]
[ROW][C]3[/C][C]-0.107745[/C][C]-0.9875[/C][C]0.163117[/C][/ROW]
[ROW][C]4[/C][C]-0.024737[/C][C]-0.2267[/C][C]0.410598[/C][/ROW]
[ROW][C]5[/C][C]-0.116804[/C][C]-1.0705[/C][C]0.143725[/C][/ROW]
[ROW][C]6[/C][C]0.04651[/C][C]0.4263[/C][C]0.3355[/C][/ROW]
[ROW][C]7[/C][C]-0.052375[/C][C]-0.48[/C][C]0.31623[/C][/ROW]
[ROW][C]8[/C][C]0.166942[/C][C]1.53[/C][C]0.064881[/C][/ROW]
[ROW][C]9[/C][C]-0.019146[/C][C]-0.1755[/C][C]0.430565[/C][/ROW]
[ROW][C]10[/C][C]-0.067376[/C][C]-0.6175[/C][C]0.269284[/C][/ROW]
[ROW][C]11[/C][C]-0.033062[/C][C]-0.303[/C][C]0.381312[/C][/ROW]
[ROW][C]12[/C][C]0.196392[/C][C]1.8[/C][C]0.037729[/C][/ROW]
[ROW][C]13[/C][C]-0.407679[/C][C]-3.7364[/C][C]0.00017[/C][/ROW]
[ROW][C]14[/C][C]-0.069745[/C][C]-0.6392[/C][C]0.262207[/C][/ROW]
[ROW][C]15[/C][C]-0.002815[/C][C]-0.0258[/C][C]0.48974[/C][/ROW]
[ROW][C]16[/C][C]-0.022214[/C][C]-0.2036[/C][C]0.419583[/C][/ROW]
[ROW][C]17[/C][C]-0.132547[/C][C]-1.2148[/C][C]0.11392[/C][/ROW]
[ROW][C]18[/C][C]0.018112[/C][C]0.166[/C][C]0.434278[/C][/ROW]
[ROW][C]19[/C][C]0.044823[/C][C]0.4108[/C][C]0.341129[/C][/ROW]
[ROW][C]20[/C][C]-0.068573[/C][C]-0.6285[/C][C]0.265697[/C][/ROW]
[ROW][C]21[/C][C]-0.05628[/C][C]-0.5158[/C][C]0.30367[/C][/ROW]
[ROW][C]22[/C][C]0.040144[/C][C]0.3679[/C][C]0.356927[/C][/ROW]
[ROW][C]23[/C][C]-0.011559[/C][C]-0.1059[/C][C]0.457941[/C][/ROW]
[ROW][C]24[/C][C]0.147268[/C][C]1.3497[/C][C]0.090363[/C][/ROW]
[ROW][C]25[/C][C]-0.036131[/C][C]-0.3311[/C][C]0.370678[/C][/ROW]
[ROW][C]26[/C][C]-0.00155[/C][C]-0.0142[/C][C]0.494349[/C][/ROW]
[ROW][C]27[/C][C]-0.021838[/C][C]-0.2001[/C][C]0.420924[/C][/ROW]
[ROW][C]28[/C][C]-0.044979[/C][C]-0.4122[/C][C]0.340608[/C][/ROW]
[ROW][C]29[/C][C]-0.108328[/C][C]-0.9928[/C][C]0.16182[/C][/ROW]
[ROW][C]30[/C][C]-0.096836[/C][C]-0.8875[/C][C]0.188668[/C][/ROW]
[ROW][C]31[/C][C]0.087366[/C][C]0.8007[/C][C]0.212775[/C][/ROW]
[ROW][C]32[/C][C]-0.043203[/C][C]-0.396[/C][C]0.346567[/C][/ROW]
[ROW][C]33[/C][C]0.05895[/C][C]0.5403[/C][C]0.295215[/C][/ROW]
[ROW][C]34[/C][C]0.041753[/C][C]0.3827[/C][C]0.351463[/C][/ROW]
[ROW][C]35[/C][C]0.038145[/C][C]0.3496[/C][C]0.363755[/C][/ROW]
[ROW][C]36[/C][C]-0.030858[/C][C]-0.2828[/C][C]0.389005[/C][/ROW]
[ROW][C]37[/C][C]-0.065583[/C][C]-0.6011[/C][C]0.274702[/C][/ROW]
[ROW][C]38[/C][C]0.048323[/C][C]0.4429[/C][C]0.329493[/C][/ROW]
[ROW][C]39[/C][C]0.00546[/C][C]0.05[/C][C]0.480104[/C][/ROW]
[ROW][C]40[/C][C]-0.08925[/C][C]-0.818[/C][C]0.207838[/C][/ROW]
[ROW][C]41[/C][C]-0.005566[/C][C]-0.051[/C][C]0.479717[/C][/ROW]
[ROW][C]42[/C][C]-0.103459[/C][C]-0.9482[/C][C]0.172869[/C][/ROW]
[ROW][C]43[/C][C]-0.008127[/C][C]-0.0745[/C][C]0.470399[/C][/ROW]
[ROW][C]44[/C][C]-0.061868[/C][C]-0.567[/C][C]0.286104[/C][/ROW]
[ROW][C]45[/C][C]0.04415[/C][C]0.4046[/C][C]0.343385[/C][/ROW]
[ROW][C]46[/C][C]-0.020809[/C][C]-0.1907[/C][C]0.424603[/C][/ROW]
[ROW][C]47[/C][C]0.026059[/C][C]0.2388[/C][C]0.405908[/C][/ROW]
[ROW][C]48[/C][C]0.006357[/C][C]0.0583[/C][C]0.47684[/C][/ROW]
[ROW][C]49[/C][C]0.032186[/C][C]0.295[/C][C]0.384365[/C][/ROW]
[ROW][C]50[/C][C]-0.004565[/C][C]-0.0418[/C][C]0.483364[/C][/ROW]
[ROW][C]51[/C][C]-0.015553[/C][C]-0.1425[/C][C]0.443496[/C][/ROW]
[ROW][C]52[/C][C]-0.049383[/C][C]-0.4526[/C][C]0.326001[/C][/ROW]
[ROW][C]53[/C][C]-0.027707[/C][C]-0.2539[/C][C]0.400082[/C][/ROW]
[ROW][C]54[/C][C]-0.001211[/C][C]-0.0111[/C][C]0.495585[/C][/ROW]
[ROW][C]55[/C][C]-0.069428[/C][C]-0.6363[/C][C]0.26315[/C][/ROW]
[ROW][C]56[/C][C]0.028291[/C][C]0.2593[/C][C]0.398024[/C][/ROW]
[ROW][C]57[/C][C]0.056266[/C][C]0.5157[/C][C]0.303713[/C][/ROW]
[ROW][C]58[/C][C]0.037197[/C][C]0.3409[/C][C]0.367011[/C][/ROW]
[ROW][C]59[/C][C]-0.100096[/C][C]-0.9174[/C][C]0.18078[/C][/ROW]
[ROW][C]60[/C][C]-0.048986[/C][C]-0.449[/C][C]0.327307[/C][/ROW]
[/TABLE]
Source: https://freestatistics.org/blog/index.php?pk=79128&T=2

Globally Unique Identifier (entire table): ba.freestatistics.org/blog/index.php?pk=79128&T=2

As an alternative you can also use a QR Code:  

The GUIDs for individual cells are displayed in the table below:

Partial Autocorrelation Function
Time lag kPACF(k)T-STATP-value
10.9415338.62930
20.2949392.70320.004155
3-0.107745-0.98750.163117
4-0.024737-0.22670.410598
5-0.116804-1.07050.143725
60.046510.42630.3355
7-0.052375-0.480.31623
80.1669421.530.064881
9-0.019146-0.17550.430565
10-0.067376-0.61750.269284
11-0.033062-0.3030.381312
120.1963921.80.037729
13-0.407679-3.73640.00017
14-0.069745-0.63920.262207
15-0.002815-0.02580.48974
16-0.022214-0.20360.419583
17-0.132547-1.21480.11392
180.0181120.1660.434278
190.0448230.41080.341129
20-0.068573-0.62850.265697
21-0.05628-0.51580.30367
220.0401440.36790.356927
23-0.011559-0.10590.457941
240.1472681.34970.090363
25-0.036131-0.33110.370678
26-0.00155-0.01420.494349
27-0.021838-0.20010.420924
28-0.044979-0.41220.340608
29-0.108328-0.99280.16182
30-0.096836-0.88750.188668
310.0873660.80070.212775
32-0.043203-0.3960.346567
330.058950.54030.295215
340.0417530.38270.351463
350.0381450.34960.363755
36-0.030858-0.28280.389005
37-0.065583-0.60110.274702
380.0483230.44290.329493
390.005460.050.480104
40-0.08925-0.8180.207838
41-0.005566-0.0510.479717
42-0.103459-0.94820.172869
43-0.008127-0.07450.470399
44-0.061868-0.5670.286104
450.044150.40460.343385
46-0.020809-0.19070.424603
470.0260590.23880.405908
480.0063570.05830.47684
490.0321860.2950.384365
50-0.004565-0.04180.483364
51-0.015553-0.14250.443496
52-0.049383-0.45260.326001
53-0.027707-0.25390.400082
54-0.001211-0.01110.495585
55-0.069428-0.63630.26315
560.0282910.25930.398024
570.0562660.51570.303713
580.0371970.34090.367011
59-0.100096-0.91740.18078
60-0.048986-0.4490.327307


Parameters (Session):
par1 = 60 ; par2 = 1 ; par3 = 0 ; par4 = 0 ; par5 = 12 ; par6 = White Noise ; par7 = 0.95 ;
Parameters (R input):
par1 = 60 ; par2 = 1 ; par3 = 0 ; par4 = 0 ; par5 = 12 ; par6 = White Noise ; par7 = 0.95 ;
R code (references can be found in the software module):
if (par1 == 'Default') {
par1 = 10*log10(length(x))
} else {
par1 <- as.numeric(par1)
}
par2 <- as.numeric(par2)
par3 <- as.numeric(par3)
par4 <- as.numeric(par4)
par5 <- as.numeric(par5)
if (par6 == 'White Noise') par6 <- 'white' else par6 <- 'ma'
par7 <- as.numeric(par7)
if (par2 == 0) {
x <- log(x)
} else {
x <- (x ^ par2 - 1) / par2
}
if (par3 > 0) x <- diff(x,lag=1,difference=par3)
if (par4 > 0) x <- diff(x,lag=par5,difference=par4)
bitmap(file='pic1.png')
racf <- acf(x, par1, main='Autocorrelation', xlab='time lag', ylab='ACF', ci.type=par6, ci=par7, sub=paste('(lambda=',par2,', d=',par3,', D=',par4,', CI=', par7, ', CI type=',par6,')',sep=''))
dev.off()
bitmap(file='pic2.png')
rpacf <- pacf(x,par1,main='Partial Autocorrelation',xlab='lags',ylab='PACF')
dev.off()
(myacf <- c(racf$acf))
(mypacf <- c(rpacf$acf))
lengthx <- length(x)
sqrtn <- sqrt(lengthx)
load(file='createtable')
a<-table.start()
a<-table.row.start(a)
a<-table.element(a,'Autocorrelation Function',4,TRUE)
a<-table.row.end(a)
a<-table.row.start(a)
a<-table.element(a,'Time lag k',header=TRUE)
a<-table.element(a,hyperlink('basics.htm','ACF(k)','click here for more information about the Autocorrelation Function'),header=TRUE)
a<-table.element(a,'T-STAT',header=TRUE)
a<-table.element(a,'P-value',header=TRUE)
a<-table.row.end(a)
for (i in 2:(par1+1)) {
a<-table.row.start(a)
a<-table.element(a,i-1,header=TRUE)
a<-table.element(a,round(myacf[i],6))
mytstat <- myacf[i]*sqrtn
a<-table.element(a,round(mytstat,4))
a<-table.element(a,round(1-pt(abs(mytstat),lengthx),6))
a<-table.row.end(a)
}
a<-table.end(a)
table.save(a,file='mytable.tab')
a<-table.start()
a<-table.row.start(a)
a<-table.element(a,'Partial Autocorrelation Function',4,TRUE)
a<-table.row.end(a)
a<-table.row.start(a)
a<-table.element(a,'Time lag k',header=TRUE)
a<-table.element(a,hyperlink('basics.htm','PACF(k)','click here for more information about the Partial Autocorrelation Function'),header=TRUE)
a<-table.element(a,'T-STAT',header=TRUE)
a<-table.element(a,'P-value',header=TRUE)
a<-table.row.end(a)
for (i in 1:par1) {
a<-table.row.start(a)
a<-table.element(a,i,header=TRUE)
a<-table.element(a,round(mypacf[i],6))
mytstat <- mypacf[i]*sqrtn
a<-table.element(a,round(mytstat,4))
a<-table.element(a,round(1-pt(abs(mytstat),lengthx),6))
a<-table.row.end(a)
}
a<-table.end(a)
table.save(a,file='mytable1.tab')