Free Statistics

of Irreproducible Research!

Author's title

Author*Unverified author*
R Software Modulerwasp_autocorrelation.wasp
Title produced by software(Partial) Autocorrelation Function
Date of computationTue, 17 Aug 2010 12:16:20 +0000
Cite this page as followsStatistical Computations at FreeStatistics.org, Office for Research Development and Education, URL https://freestatistics.org/blog/index.php?v=date/2010/Aug/17/t12820473540y3zbo7f4uz4fsl.htm/, Retrieved Sat, 27 Apr 2024 08:52:02 +0000
Statistical Computations at FreeStatistics.org, Office for Research Development and Education, URL https://freestatistics.org/blog/index.php?pk=79096, Retrieved Sat, 27 Apr 2024 08:52:02 +0000
QR Codes:

Original text written by user:
IsPrivate?No (this computation is public)
User-defined keywordsTrouillard Olivier
Estimated Impact166
Family? (F = Feedback message, R = changed R code, M = changed R Module, P = changed Parameters, D = changed Data)
-       [(Partial) Autocorrelation Function] [aantal bezoekers] [2010-08-17 12:16:20] [b58dfa1c2951471c561e0016df4afa08] [Current]
Feedback Forum

Post a new message
Dataseries X:
80
79
78
76
74
73
74
76
77
77
78
80
90
90
89
82
78
76
74
78
81
82
88
99
117
113
106
100
97
96
100
104
104
111
117
118
140
147
134
126
116
114
120
122
117
119
132
134
154
152
132
130
123
129
124
128
128
129
141
138
155
160
142
133
131
140
134
134
134
136
145
137
152
168
160
157
147
161
159
164
163
158
175
163


Summary of computational transaction
Raw Inputview raw input (R code)
Raw Outputview raw output of R engine
Computing time1 seconds
R Server'George Udny Yule' @ 72.249.76.132

\begin{tabular}{lllllllll}
\hline
Summary of computational transaction \tabularnewline
Raw Input & view raw input (R code)  \tabularnewline
Raw Output & view raw output of R engine  \tabularnewline
Computing time & 1 seconds \tabularnewline
R Server & 'George Udny Yule' @ 72.249.76.132 \tabularnewline
\hline
\end{tabular}
%Source: https://freestatistics.org/blog/index.php?pk=79096&T=0

[TABLE]
[ROW][C]Summary of computational transaction[/C][/ROW]
[ROW][C]Raw Input[/C][C]view raw input (R code) [/C][/ROW]
[ROW][C]Raw Output[/C][C]view raw output of R engine [/C][/ROW]
[ROW][C]Computing time[/C][C]1 seconds[/C][/ROW]
[ROW][C]R Server[/C][C]'George Udny Yule' @ 72.249.76.132[/C][/ROW]
[/TABLE]
Source: https://freestatistics.org/blog/index.php?pk=79096&T=0

Globally Unique Identifier (entire table): ba.freestatistics.org/blog/index.php?pk=79096&T=0

As an alternative you can also use a QR Code:  

The GUIDs for individual cells are displayed in the table below:

Summary of computational transaction
Raw Inputview raw input (R code)
Raw Outputview raw output of R engine
Computing time1 seconds
R Server'George Udny Yule' @ 72.249.76.132


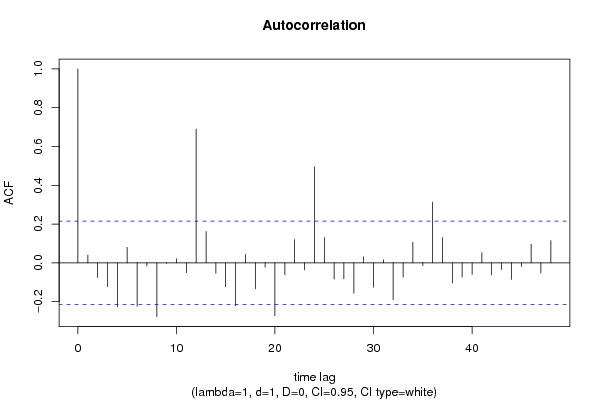
Autocorrelation Function
Time lag kACF(k)T-STATP-value
10.0401790.3660.357632
2-0.076079-0.69310.245087
3-0.123698-1.12690.131507
4-0.225818-2.05730.021398
50.0797990.7270.234634
6-0.22433-2.04370.022075
7-0.016555-0.15080.44024
8-0.27753-2.52840.006676
9-0.002232-0.02030.491912
100.0213910.19490.42298
11-0.050595-0.46090.323022
120.689366.28040
130.1614581.4710.072542
14-0.053385-0.48640.313995
15-0.123512-1.12520.131864
16-0.221726-2.020.023303
170.0433410.39490.346982
18-0.134115-1.22180.112613
19-0.022321-0.20340.419677
20-0.272321-2.4810.007561
21-0.061198-0.55750.28933
220.1207221.09980.137294
23-0.036086-0.32880.371582
240.4960944.51961e-05
250.1302081.18630.119453
26-0.083519-0.76090.224437
27-0.082589-0.75240.226962
28-0.156994-1.43030.078195
290.0308780.28130.389586
30-0.125372-1.14220.128329
310.0158110.1440.442907
32-0.189918-1.73020.043652
33-0.073475-0.66940.252553
340.1062130.96760.168017
35-0.014137-0.12880.448916
360.3130582.85210.00274
370.130581.18960.118789
38-0.104539-0.95240.171832
39-0.072917-0.66430.254169
40-0.059524-0.54230.294537
410.0522690.47620.317593
42-0.062686-0.57110.284739
43-0.034412-0.31350.37734
44-0.085379-0.77780.219436
45-0.018973-0.17290.431593
460.0961680.87610.191743
47-0.052083-0.47450.318194
480.1143971.04220.15017

\begin{tabular}{lllllllll}
\hline
Autocorrelation Function \tabularnewline
Time lag k & ACF(k) & T-STAT & P-value \tabularnewline
1 & 0.040179 & 0.366 & 0.357632 \tabularnewline
2 & -0.076079 & -0.6931 & 0.245087 \tabularnewline
3 & -0.123698 & -1.1269 & 0.131507 \tabularnewline
4 & -0.225818 & -2.0573 & 0.021398 \tabularnewline
5 & 0.079799 & 0.727 & 0.234634 \tabularnewline
6 & -0.22433 & -2.0437 & 0.022075 \tabularnewline
7 & -0.016555 & -0.1508 & 0.44024 \tabularnewline
8 & -0.27753 & -2.5284 & 0.006676 \tabularnewline
9 & -0.002232 & -0.0203 & 0.491912 \tabularnewline
10 & 0.021391 & 0.1949 & 0.42298 \tabularnewline
11 & -0.050595 & -0.4609 & 0.323022 \tabularnewline
12 & 0.68936 & 6.2804 & 0 \tabularnewline
13 & 0.161458 & 1.471 & 0.072542 \tabularnewline
14 & -0.053385 & -0.4864 & 0.313995 \tabularnewline
15 & -0.123512 & -1.1252 & 0.131864 \tabularnewline
16 & -0.221726 & -2.02 & 0.023303 \tabularnewline
17 & 0.043341 & 0.3949 & 0.346982 \tabularnewline
18 & -0.134115 & -1.2218 & 0.112613 \tabularnewline
19 & -0.022321 & -0.2034 & 0.419677 \tabularnewline
20 & -0.272321 & -2.481 & 0.007561 \tabularnewline
21 & -0.061198 & -0.5575 & 0.28933 \tabularnewline
22 & 0.120722 & 1.0998 & 0.137294 \tabularnewline
23 & -0.036086 & -0.3288 & 0.371582 \tabularnewline
24 & 0.496094 & 4.5196 & 1e-05 \tabularnewline
25 & 0.130208 & 1.1863 & 0.119453 \tabularnewline
26 & -0.083519 & -0.7609 & 0.224437 \tabularnewline
27 & -0.082589 & -0.7524 & 0.226962 \tabularnewline
28 & -0.156994 & -1.4303 & 0.078195 \tabularnewline
29 & 0.030878 & 0.2813 & 0.389586 \tabularnewline
30 & -0.125372 & -1.1422 & 0.128329 \tabularnewline
31 & 0.015811 & 0.144 & 0.442907 \tabularnewline
32 & -0.189918 & -1.7302 & 0.043652 \tabularnewline
33 & -0.073475 & -0.6694 & 0.252553 \tabularnewline
34 & 0.106213 & 0.9676 & 0.168017 \tabularnewline
35 & -0.014137 & -0.1288 & 0.448916 \tabularnewline
36 & 0.313058 & 2.8521 & 0.00274 \tabularnewline
37 & 0.13058 & 1.1896 & 0.118789 \tabularnewline
38 & -0.104539 & -0.9524 & 0.171832 \tabularnewline
39 & -0.072917 & -0.6643 & 0.254169 \tabularnewline
40 & -0.059524 & -0.5423 & 0.294537 \tabularnewline
41 & 0.052269 & 0.4762 & 0.317593 \tabularnewline
42 & -0.062686 & -0.5711 & 0.284739 \tabularnewline
43 & -0.034412 & -0.3135 & 0.37734 \tabularnewline
44 & -0.085379 & -0.7778 & 0.219436 \tabularnewline
45 & -0.018973 & -0.1729 & 0.431593 \tabularnewline
46 & 0.096168 & 0.8761 & 0.191743 \tabularnewline
47 & -0.052083 & -0.4745 & 0.318194 \tabularnewline
48 & 0.114397 & 1.0422 & 0.15017 \tabularnewline
\hline
\end{tabular}
%Source: https://freestatistics.org/blog/index.php?pk=79096&T=1

[TABLE]
[ROW][C]Autocorrelation Function[/C][/ROW]
[ROW][C]Time lag k[/C][C]ACF(k)[/C][C]T-STAT[/C][C]P-value[/C][/ROW]
[ROW][C]1[/C][C]0.040179[/C][C]0.366[/C][C]0.357632[/C][/ROW]
[ROW][C]2[/C][C]-0.076079[/C][C]-0.6931[/C][C]0.245087[/C][/ROW]
[ROW][C]3[/C][C]-0.123698[/C][C]-1.1269[/C][C]0.131507[/C][/ROW]
[ROW][C]4[/C][C]-0.225818[/C][C]-2.0573[/C][C]0.021398[/C][/ROW]
[ROW][C]5[/C][C]0.079799[/C][C]0.727[/C][C]0.234634[/C][/ROW]
[ROW][C]6[/C][C]-0.22433[/C][C]-2.0437[/C][C]0.022075[/C][/ROW]
[ROW][C]7[/C][C]-0.016555[/C][C]-0.1508[/C][C]0.44024[/C][/ROW]
[ROW][C]8[/C][C]-0.27753[/C][C]-2.5284[/C][C]0.006676[/C][/ROW]
[ROW][C]9[/C][C]-0.002232[/C][C]-0.0203[/C][C]0.491912[/C][/ROW]
[ROW][C]10[/C][C]0.021391[/C][C]0.1949[/C][C]0.42298[/C][/ROW]
[ROW][C]11[/C][C]-0.050595[/C][C]-0.4609[/C][C]0.323022[/C][/ROW]
[ROW][C]12[/C][C]0.68936[/C][C]6.2804[/C][C]0[/C][/ROW]
[ROW][C]13[/C][C]0.161458[/C][C]1.471[/C][C]0.072542[/C][/ROW]
[ROW][C]14[/C][C]-0.053385[/C][C]-0.4864[/C][C]0.313995[/C][/ROW]
[ROW][C]15[/C][C]-0.123512[/C][C]-1.1252[/C][C]0.131864[/C][/ROW]
[ROW][C]16[/C][C]-0.221726[/C][C]-2.02[/C][C]0.023303[/C][/ROW]
[ROW][C]17[/C][C]0.043341[/C][C]0.3949[/C][C]0.346982[/C][/ROW]
[ROW][C]18[/C][C]-0.134115[/C][C]-1.2218[/C][C]0.112613[/C][/ROW]
[ROW][C]19[/C][C]-0.022321[/C][C]-0.2034[/C][C]0.419677[/C][/ROW]
[ROW][C]20[/C][C]-0.272321[/C][C]-2.481[/C][C]0.007561[/C][/ROW]
[ROW][C]21[/C][C]-0.061198[/C][C]-0.5575[/C][C]0.28933[/C][/ROW]
[ROW][C]22[/C][C]0.120722[/C][C]1.0998[/C][C]0.137294[/C][/ROW]
[ROW][C]23[/C][C]-0.036086[/C][C]-0.3288[/C][C]0.371582[/C][/ROW]
[ROW][C]24[/C][C]0.496094[/C][C]4.5196[/C][C]1e-05[/C][/ROW]
[ROW][C]25[/C][C]0.130208[/C][C]1.1863[/C][C]0.119453[/C][/ROW]
[ROW][C]26[/C][C]-0.083519[/C][C]-0.7609[/C][C]0.224437[/C][/ROW]
[ROW][C]27[/C][C]-0.082589[/C][C]-0.7524[/C][C]0.226962[/C][/ROW]
[ROW][C]28[/C][C]-0.156994[/C][C]-1.4303[/C][C]0.078195[/C][/ROW]
[ROW][C]29[/C][C]0.030878[/C][C]0.2813[/C][C]0.389586[/C][/ROW]
[ROW][C]30[/C][C]-0.125372[/C][C]-1.1422[/C][C]0.128329[/C][/ROW]
[ROW][C]31[/C][C]0.015811[/C][C]0.144[/C][C]0.442907[/C][/ROW]
[ROW][C]32[/C][C]-0.189918[/C][C]-1.7302[/C][C]0.043652[/C][/ROW]
[ROW][C]33[/C][C]-0.073475[/C][C]-0.6694[/C][C]0.252553[/C][/ROW]
[ROW][C]34[/C][C]0.106213[/C][C]0.9676[/C][C]0.168017[/C][/ROW]
[ROW][C]35[/C][C]-0.014137[/C][C]-0.1288[/C][C]0.448916[/C][/ROW]
[ROW][C]36[/C][C]0.313058[/C][C]2.8521[/C][C]0.00274[/C][/ROW]
[ROW][C]37[/C][C]0.13058[/C][C]1.1896[/C][C]0.118789[/C][/ROW]
[ROW][C]38[/C][C]-0.104539[/C][C]-0.9524[/C][C]0.171832[/C][/ROW]
[ROW][C]39[/C][C]-0.072917[/C][C]-0.6643[/C][C]0.254169[/C][/ROW]
[ROW][C]40[/C][C]-0.059524[/C][C]-0.5423[/C][C]0.294537[/C][/ROW]
[ROW][C]41[/C][C]0.052269[/C][C]0.4762[/C][C]0.317593[/C][/ROW]
[ROW][C]42[/C][C]-0.062686[/C][C]-0.5711[/C][C]0.284739[/C][/ROW]
[ROW][C]43[/C][C]-0.034412[/C][C]-0.3135[/C][C]0.37734[/C][/ROW]
[ROW][C]44[/C][C]-0.085379[/C][C]-0.7778[/C][C]0.219436[/C][/ROW]
[ROW][C]45[/C][C]-0.018973[/C][C]-0.1729[/C][C]0.431593[/C][/ROW]
[ROW][C]46[/C][C]0.096168[/C][C]0.8761[/C][C]0.191743[/C][/ROW]
[ROW][C]47[/C][C]-0.052083[/C][C]-0.4745[/C][C]0.318194[/C][/ROW]
[ROW][C]48[/C][C]0.114397[/C][C]1.0422[/C][C]0.15017[/C][/ROW]
[/TABLE]
Source: https://freestatistics.org/blog/index.php?pk=79096&T=1

Globally Unique Identifier (entire table): ba.freestatistics.org/blog/index.php?pk=79096&T=1

As an alternative you can also use a QR Code:  

The GUIDs for individual cells are displayed in the table below:

Autocorrelation Function
Time lag kACF(k)T-STATP-value
10.0401790.3660.357632
2-0.076079-0.69310.245087
3-0.123698-1.12690.131507
4-0.225818-2.05730.021398
50.0797990.7270.234634
6-0.22433-2.04370.022075
7-0.016555-0.15080.44024
8-0.27753-2.52840.006676
9-0.002232-0.02030.491912
100.0213910.19490.42298
11-0.050595-0.46090.323022
120.689366.28040
130.1614581.4710.072542
14-0.053385-0.48640.313995
15-0.123512-1.12520.131864
16-0.221726-2.020.023303
170.0433410.39490.346982
18-0.134115-1.22180.112613
19-0.022321-0.20340.419677
20-0.272321-2.4810.007561
21-0.061198-0.55750.28933
220.1207221.09980.137294
23-0.036086-0.32880.371582
240.4960944.51961e-05
250.1302081.18630.119453
26-0.083519-0.76090.224437
27-0.082589-0.75240.226962
28-0.156994-1.43030.078195
290.0308780.28130.389586
30-0.125372-1.14220.128329
310.0158110.1440.442907
32-0.189918-1.73020.043652
33-0.073475-0.66940.252553
340.1062130.96760.168017
35-0.014137-0.12880.448916
360.3130582.85210.00274
370.130581.18960.118789
38-0.104539-0.95240.171832
39-0.072917-0.66430.254169
40-0.059524-0.54230.294537
410.0522690.47620.317593
42-0.062686-0.57110.284739
43-0.034412-0.31350.37734
44-0.085379-0.77780.219436
45-0.018973-0.17290.431593
460.0961680.87610.191743
47-0.052083-0.47450.318194
480.1143971.04220.15017


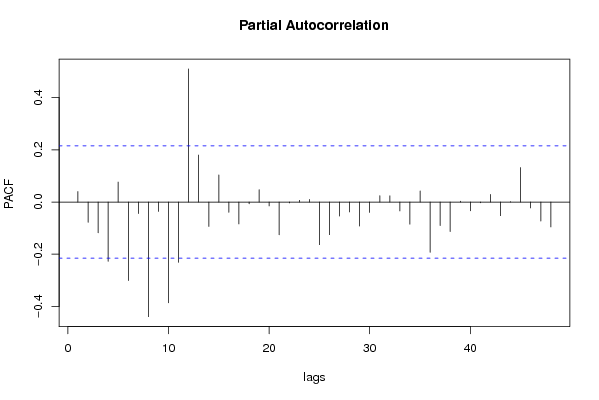
Partial Autocorrelation Function
Time lag kPACF(k)T-STATP-value
10.0401790.3660.357632
2-0.077819-0.7090.240167
3-0.118182-1.07670.142369
4-0.227273-2.07060.020754
50.0766530.69830.243457
6-0.301102-2.74320.003727
7-0.044175-0.40250.344194
8-0.439145-4.00086.8e-05
9-0.036309-0.33080.370819
10-0.386253-3.51890.000353
11-0.230789-2.10260.019266
120.5096874.64356e-06
130.1797981.6380.052599
14-0.093616-0.85290.198089
150.1037690.94540.173604
16-0.039609-0.36090.359563
17-0.084219-0.76730.222549
18-0.006704-0.06110.475724
190.0469840.4280.334864
20-0.015131-0.13790.445345
21-0.125551-1.14380.127992
22-0.003814-0.03470.486182
230.0065710.05990.476205
240.0100390.09150.463675
25-0.163356-1.48820.070239
26-0.125084-1.13960.128871
27-0.053953-0.49150.312172
28-0.038142-0.34750.364551
29-0.092047-0.83860.202055
30-0.040029-0.36470.358139
310.024140.21990.413234
320.023860.21740.414224
33-0.034415-0.31350.377329
34-0.08477-0.77230.221067
350.0424630.38690.349926
36-0.192589-1.75460.041512
37-0.090115-0.8210.207002
38-0.113083-1.03020.152945
390.0029230.02660.489409
40-0.033552-0.30570.380308
41-0.0029-0.02640.489492
420.0288310.26270.396729
43-0.052414-0.47750.317126
440.0012710.01160.495396
450.1321091.20360.116089
46-0.022721-0.2070.418259
47-0.072807-0.66330.254487
48-0.095393-0.86910.193656

\begin{tabular}{lllllllll}
\hline
Partial Autocorrelation Function \tabularnewline
Time lag k & PACF(k) & T-STAT & P-value \tabularnewline
1 & 0.040179 & 0.366 & 0.357632 \tabularnewline
2 & -0.077819 & -0.709 & 0.240167 \tabularnewline
3 & -0.118182 & -1.0767 & 0.142369 \tabularnewline
4 & -0.227273 & -2.0706 & 0.020754 \tabularnewline
5 & 0.076653 & 0.6983 & 0.243457 \tabularnewline
6 & -0.301102 & -2.7432 & 0.003727 \tabularnewline
7 & -0.044175 & -0.4025 & 0.344194 \tabularnewline
8 & -0.439145 & -4.0008 & 6.8e-05 \tabularnewline
9 & -0.036309 & -0.3308 & 0.370819 \tabularnewline
10 & -0.386253 & -3.5189 & 0.000353 \tabularnewline
11 & -0.230789 & -2.1026 & 0.019266 \tabularnewline
12 & 0.509687 & 4.6435 & 6e-06 \tabularnewline
13 & 0.179798 & 1.638 & 0.052599 \tabularnewline
14 & -0.093616 & -0.8529 & 0.198089 \tabularnewline
15 & 0.103769 & 0.9454 & 0.173604 \tabularnewline
16 & -0.039609 & -0.3609 & 0.359563 \tabularnewline
17 & -0.084219 & -0.7673 & 0.222549 \tabularnewline
18 & -0.006704 & -0.0611 & 0.475724 \tabularnewline
19 & 0.046984 & 0.428 & 0.334864 \tabularnewline
20 & -0.015131 & -0.1379 & 0.445345 \tabularnewline
21 & -0.125551 & -1.1438 & 0.127992 \tabularnewline
22 & -0.003814 & -0.0347 & 0.486182 \tabularnewline
23 & 0.006571 & 0.0599 & 0.476205 \tabularnewline
24 & 0.010039 & 0.0915 & 0.463675 \tabularnewline
25 & -0.163356 & -1.4882 & 0.070239 \tabularnewline
26 & -0.125084 & -1.1396 & 0.128871 \tabularnewline
27 & -0.053953 & -0.4915 & 0.312172 \tabularnewline
28 & -0.038142 & -0.3475 & 0.364551 \tabularnewline
29 & -0.092047 & -0.8386 & 0.202055 \tabularnewline
30 & -0.040029 & -0.3647 & 0.358139 \tabularnewline
31 & 0.02414 & 0.2199 & 0.413234 \tabularnewline
32 & 0.02386 & 0.2174 & 0.414224 \tabularnewline
33 & -0.034415 & -0.3135 & 0.377329 \tabularnewline
34 & -0.08477 & -0.7723 & 0.221067 \tabularnewline
35 & 0.042463 & 0.3869 & 0.349926 \tabularnewline
36 & -0.192589 & -1.7546 & 0.041512 \tabularnewline
37 & -0.090115 & -0.821 & 0.207002 \tabularnewline
38 & -0.113083 & -1.0302 & 0.152945 \tabularnewline
39 & 0.002923 & 0.0266 & 0.489409 \tabularnewline
40 & -0.033552 & -0.3057 & 0.380308 \tabularnewline
41 & -0.0029 & -0.0264 & 0.489492 \tabularnewline
42 & 0.028831 & 0.2627 & 0.396729 \tabularnewline
43 & -0.052414 & -0.4775 & 0.317126 \tabularnewline
44 & 0.001271 & 0.0116 & 0.495396 \tabularnewline
45 & 0.132109 & 1.2036 & 0.116089 \tabularnewline
46 & -0.022721 & -0.207 & 0.418259 \tabularnewline
47 & -0.072807 & -0.6633 & 0.254487 \tabularnewline
48 & -0.095393 & -0.8691 & 0.193656 \tabularnewline
\hline
\end{tabular}
%Source: https://freestatistics.org/blog/index.php?pk=79096&T=2

[TABLE]
[ROW][C]Partial Autocorrelation Function[/C][/ROW]
[ROW][C]Time lag k[/C][C]PACF(k)[/C][C]T-STAT[/C][C]P-value[/C][/ROW]
[ROW][C]1[/C][C]0.040179[/C][C]0.366[/C][C]0.357632[/C][/ROW]
[ROW][C]2[/C][C]-0.077819[/C][C]-0.709[/C][C]0.240167[/C][/ROW]
[ROW][C]3[/C][C]-0.118182[/C][C]-1.0767[/C][C]0.142369[/C][/ROW]
[ROW][C]4[/C][C]-0.227273[/C][C]-2.0706[/C][C]0.020754[/C][/ROW]
[ROW][C]5[/C][C]0.076653[/C][C]0.6983[/C][C]0.243457[/C][/ROW]
[ROW][C]6[/C][C]-0.301102[/C][C]-2.7432[/C][C]0.003727[/C][/ROW]
[ROW][C]7[/C][C]-0.044175[/C][C]-0.4025[/C][C]0.344194[/C][/ROW]
[ROW][C]8[/C][C]-0.439145[/C][C]-4.0008[/C][C]6.8e-05[/C][/ROW]
[ROW][C]9[/C][C]-0.036309[/C][C]-0.3308[/C][C]0.370819[/C][/ROW]
[ROW][C]10[/C][C]-0.386253[/C][C]-3.5189[/C][C]0.000353[/C][/ROW]
[ROW][C]11[/C][C]-0.230789[/C][C]-2.1026[/C][C]0.019266[/C][/ROW]
[ROW][C]12[/C][C]0.509687[/C][C]4.6435[/C][C]6e-06[/C][/ROW]
[ROW][C]13[/C][C]0.179798[/C][C]1.638[/C][C]0.052599[/C][/ROW]
[ROW][C]14[/C][C]-0.093616[/C][C]-0.8529[/C][C]0.198089[/C][/ROW]
[ROW][C]15[/C][C]0.103769[/C][C]0.9454[/C][C]0.173604[/C][/ROW]
[ROW][C]16[/C][C]-0.039609[/C][C]-0.3609[/C][C]0.359563[/C][/ROW]
[ROW][C]17[/C][C]-0.084219[/C][C]-0.7673[/C][C]0.222549[/C][/ROW]
[ROW][C]18[/C][C]-0.006704[/C][C]-0.0611[/C][C]0.475724[/C][/ROW]
[ROW][C]19[/C][C]0.046984[/C][C]0.428[/C][C]0.334864[/C][/ROW]
[ROW][C]20[/C][C]-0.015131[/C][C]-0.1379[/C][C]0.445345[/C][/ROW]
[ROW][C]21[/C][C]-0.125551[/C][C]-1.1438[/C][C]0.127992[/C][/ROW]
[ROW][C]22[/C][C]-0.003814[/C][C]-0.0347[/C][C]0.486182[/C][/ROW]
[ROW][C]23[/C][C]0.006571[/C][C]0.0599[/C][C]0.476205[/C][/ROW]
[ROW][C]24[/C][C]0.010039[/C][C]0.0915[/C][C]0.463675[/C][/ROW]
[ROW][C]25[/C][C]-0.163356[/C][C]-1.4882[/C][C]0.070239[/C][/ROW]
[ROW][C]26[/C][C]-0.125084[/C][C]-1.1396[/C][C]0.128871[/C][/ROW]
[ROW][C]27[/C][C]-0.053953[/C][C]-0.4915[/C][C]0.312172[/C][/ROW]
[ROW][C]28[/C][C]-0.038142[/C][C]-0.3475[/C][C]0.364551[/C][/ROW]
[ROW][C]29[/C][C]-0.092047[/C][C]-0.8386[/C][C]0.202055[/C][/ROW]
[ROW][C]30[/C][C]-0.040029[/C][C]-0.3647[/C][C]0.358139[/C][/ROW]
[ROW][C]31[/C][C]0.02414[/C][C]0.2199[/C][C]0.413234[/C][/ROW]
[ROW][C]32[/C][C]0.02386[/C][C]0.2174[/C][C]0.414224[/C][/ROW]
[ROW][C]33[/C][C]-0.034415[/C][C]-0.3135[/C][C]0.377329[/C][/ROW]
[ROW][C]34[/C][C]-0.08477[/C][C]-0.7723[/C][C]0.221067[/C][/ROW]
[ROW][C]35[/C][C]0.042463[/C][C]0.3869[/C][C]0.349926[/C][/ROW]
[ROW][C]36[/C][C]-0.192589[/C][C]-1.7546[/C][C]0.041512[/C][/ROW]
[ROW][C]37[/C][C]-0.090115[/C][C]-0.821[/C][C]0.207002[/C][/ROW]
[ROW][C]38[/C][C]-0.113083[/C][C]-1.0302[/C][C]0.152945[/C][/ROW]
[ROW][C]39[/C][C]0.002923[/C][C]0.0266[/C][C]0.489409[/C][/ROW]
[ROW][C]40[/C][C]-0.033552[/C][C]-0.3057[/C][C]0.380308[/C][/ROW]
[ROW][C]41[/C][C]-0.0029[/C][C]-0.0264[/C][C]0.489492[/C][/ROW]
[ROW][C]42[/C][C]0.028831[/C][C]0.2627[/C][C]0.396729[/C][/ROW]
[ROW][C]43[/C][C]-0.052414[/C][C]-0.4775[/C][C]0.317126[/C][/ROW]
[ROW][C]44[/C][C]0.001271[/C][C]0.0116[/C][C]0.495396[/C][/ROW]
[ROW][C]45[/C][C]0.132109[/C][C]1.2036[/C][C]0.116089[/C][/ROW]
[ROW][C]46[/C][C]-0.022721[/C][C]-0.207[/C][C]0.418259[/C][/ROW]
[ROW][C]47[/C][C]-0.072807[/C][C]-0.6633[/C][C]0.254487[/C][/ROW]
[ROW][C]48[/C][C]-0.095393[/C][C]-0.8691[/C][C]0.193656[/C][/ROW]
[/TABLE]
Source: https://freestatistics.org/blog/index.php?pk=79096&T=2

Globally Unique Identifier (entire table): ba.freestatistics.org/blog/index.php?pk=79096&T=2

As an alternative you can also use a QR Code:  

The GUIDs for individual cells are displayed in the table below:

Partial Autocorrelation Function
Time lag kPACF(k)T-STATP-value
10.0401790.3660.357632
2-0.077819-0.7090.240167
3-0.118182-1.07670.142369
4-0.227273-2.07060.020754
50.0766530.69830.243457
6-0.301102-2.74320.003727
7-0.044175-0.40250.344194
8-0.439145-4.00086.8e-05
9-0.036309-0.33080.370819
10-0.386253-3.51890.000353
11-0.230789-2.10260.019266
120.5096874.64356e-06
130.1797981.6380.052599
14-0.093616-0.85290.198089
150.1037690.94540.173604
16-0.039609-0.36090.359563
17-0.084219-0.76730.222549
18-0.006704-0.06110.475724
190.0469840.4280.334864
20-0.015131-0.13790.445345
21-0.125551-1.14380.127992
22-0.003814-0.03470.486182
230.0065710.05990.476205
240.0100390.09150.463675
25-0.163356-1.48820.070239
26-0.125084-1.13960.128871
27-0.053953-0.49150.312172
28-0.038142-0.34750.364551
29-0.092047-0.83860.202055
30-0.040029-0.36470.358139
310.024140.21990.413234
320.023860.21740.414224
33-0.034415-0.31350.377329
34-0.08477-0.77230.221067
350.0424630.38690.349926
36-0.192589-1.75460.041512
37-0.090115-0.8210.207002
38-0.113083-1.03020.152945
390.0029230.02660.489409
40-0.033552-0.30570.380308
41-0.0029-0.02640.489492
420.0288310.26270.396729
43-0.052414-0.47750.317126
440.0012710.01160.495396
450.1321091.20360.116089
46-0.022721-0.2070.418259
47-0.072807-0.66330.254487
48-0.095393-0.86910.193656


Parameters (Session):
par1 = 48 ; par2 = 1 ; par3 = 1 ; par4 = 0 ; par5 = 12 ; par6 = White Noise ; par7 = 0.95 ;
Parameters (R input):
par1 = 48 ; par2 = 1 ; par3 = 1 ; par4 = 0 ; par5 = 12 ; par6 = White Noise ; par7 = 0.95 ;
R code (references can be found in the software module):
if (par1 == 'Default') {
par1 = 10*log10(length(x))
} else {
par1 <- as.numeric(par1)
}
par2 <- as.numeric(par2)
par3 <- as.numeric(par3)
par4 <- as.numeric(par4)
par5 <- as.numeric(par5)
if (par6 == 'White Noise') par6 <- 'white' else par6 <- 'ma'
par7 <- as.numeric(par7)
if (par2 == 0) {
x <- log(x)
} else {
x <- (x ^ par2 - 1) / par2
}
if (par3 > 0) x <- diff(x,lag=1,difference=par3)
if (par4 > 0) x <- diff(x,lag=par5,difference=par4)
bitmap(file='pic1.png')
racf <- acf(x, par1, main='Autocorrelation', xlab='time lag', ylab='ACF', ci.type=par6, ci=par7, sub=paste('(lambda=',par2,', d=',par3,', D=',par4,', CI=', par7, ', CI type=',par6,')',sep=''))
dev.off()
bitmap(file='pic2.png')
rpacf <- pacf(x,par1,main='Partial Autocorrelation',xlab='lags',ylab='PACF')
dev.off()
(myacf <- c(racf$acf))
(mypacf <- c(rpacf$acf))
lengthx <- length(x)
sqrtn <- sqrt(lengthx)
load(file='createtable')
a<-table.start()
a<-table.row.start(a)
a<-table.element(a,'Autocorrelation Function',4,TRUE)
a<-table.row.end(a)
a<-table.row.start(a)
a<-table.element(a,'Time lag k',header=TRUE)
a<-table.element(a,hyperlink('basics.htm','ACF(k)','click here for more information about the Autocorrelation Function'),header=TRUE)
a<-table.element(a,'T-STAT',header=TRUE)
a<-table.element(a,'P-value',header=TRUE)
a<-table.row.end(a)
for (i in 2:(par1+1)) {
a<-table.row.start(a)
a<-table.element(a,i-1,header=TRUE)
a<-table.element(a,round(myacf[i],6))
mytstat <- myacf[i]*sqrtn
a<-table.element(a,round(mytstat,4))
a<-table.element(a,round(1-pt(abs(mytstat),lengthx),6))
a<-table.row.end(a)
}
a<-table.end(a)
table.save(a,file='mytable.tab')
a<-table.start()
a<-table.row.start(a)
a<-table.element(a,'Partial Autocorrelation Function',4,TRUE)
a<-table.row.end(a)
a<-table.row.start(a)
a<-table.element(a,'Time lag k',header=TRUE)
a<-table.element(a,hyperlink('basics.htm','PACF(k)','click here for more information about the Partial Autocorrelation Function'),header=TRUE)
a<-table.element(a,'T-STAT',header=TRUE)
a<-table.element(a,'P-value',header=TRUE)
a<-table.row.end(a)
for (i in 1:par1) {
a<-table.row.start(a)
a<-table.element(a,i,header=TRUE)
a<-table.element(a,round(mypacf[i],6))
mytstat <- mypacf[i]*sqrtn
a<-table.element(a,round(mytstat,4))
a<-table.element(a,round(1-pt(abs(mytstat),lengthx),6))
a<-table.row.end(a)
}
a<-table.end(a)
table.save(a,file='mytable1.tab')