Free Statistics

of Irreproducible Research!

Author's title

Author*Unverified author*
R Software Modulerwasp_autocorrelation.wasp
Title produced by software(Partial) Autocorrelation Function
Date of computationTue, 17 Aug 2010 12:08:18 +0000
Cite this page as followsStatistical Computations at FreeStatistics.org, Office for Research Development and Education, URL https://freestatistics.org/blog/index.php?v=date/2010/Aug/17/t12820468976tky1qphf2zs30s.htm/, Retrieved Sat, 27 Apr 2024 07:47:18 +0000
Statistical Computations at FreeStatistics.org, Office for Research Development and Education, URL https://freestatistics.org/blog/index.php?pk=79094, Retrieved Sat, 27 Apr 2024 07:47:18 +0000
QR Codes:

Original text written by user:
IsPrivate?No (this computation is public)
User-defined keywordsTrouillard Olivier
Estimated Impact144
Family? (F = Feedback message, R = changed R code, M = changed R Module, P = changed Parameters, D = changed Data)
-       [(Partial) Autocorrelation Function] [aantal bezoekers] [2010-08-17 12:08:18] [b58dfa1c2951471c561e0016df4afa08] [Current]
Feedback Forum

Post a new message
Dataseries X:
80
79
78
76
74
73
74
76
77
77
78
80
90
90
89
82
78
76
74
78
81
82
88
99
117
113
106
100
97
96
100
104
104
111
117
118
140
147
134
126
116
114
120
122
117
119
132
134
154
152
132
130
123
129
124
128
128
129
141
138
155
160
142
133
131
140
134
134
134
136
145
137
152
168
160
157
147
161
159
164
163
158
175
163


Summary of computational transaction
Raw Inputview raw input (R code)
Raw Outputview raw output of R engine
Computing time1 seconds
R Server'Gwilym Jenkins' @ 72.249.127.135

\begin{tabular}{lllllllll}
\hline
Summary of computational transaction \tabularnewline
Raw Input & view raw input (R code)  \tabularnewline
Raw Output & view raw output of R engine  \tabularnewline
Computing time & 1 seconds \tabularnewline
R Server & 'Gwilym Jenkins' @ 72.249.127.135 \tabularnewline
\hline
\end{tabular}
%Source: https://freestatistics.org/blog/index.php?pk=79094&T=0

[TABLE]
[ROW][C]Summary of computational transaction[/C][/ROW]
[ROW][C]Raw Input[/C][C]view raw input (R code) [/C][/ROW]
[ROW][C]Raw Output[/C][C]view raw output of R engine [/C][/ROW]
[ROW][C]Computing time[/C][C]1 seconds[/C][/ROW]
[ROW][C]R Server[/C][C]'Gwilym Jenkins' @ 72.249.127.135[/C][/ROW]
[/TABLE]
Source: https://freestatistics.org/blog/index.php?pk=79094&T=0

Globally Unique Identifier (entire table): ba.freestatistics.org/blog/index.php?pk=79094&T=0

As an alternative you can also use a QR Code:  

The GUIDs for individual cells are displayed in the table below:

Summary of computational transaction
Raw Inputview raw input (R code)
Raw Outputview raw output of R engine
Computing time1 seconds
R Server'Gwilym Jenkins' @ 72.249.127.135


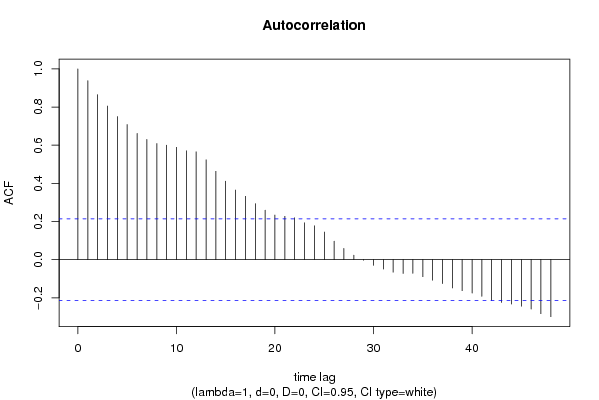
Autocorrelation Function
Time lag kACF(k)T-STATP-value
10.9385148.60160
20.8648147.92620
30.8055327.38280
40.7500456.87430
50.708326.49190
60.6619696.0670
70.630265.77640
80.6083615.57570
90.60025.50090
100.5890955.39910
110.5706435.231e-06
120.5656825.18461e-06
130.5233394.79653e-06
140.4631834.24512.8e-05
150.4111383.76810.000152
160.3648423.34380.000618
170.3318643.04160.00157
180.293582.69070.004301
190.2593322.37680.009868
200.2333912.13910.017666
210.2269982.08050.020265
220.2190252.00740.023961
230.1929351.76830.040322
240.177331.62530.053927
250.1443231.32270.094756
260.0969750.88880.188326
270.0588020.53890.29568
280.0234260.21470.41526
29-0.00272-0.02490.490084
30-0.030013-0.27510.391966
31-0.049782-0.45630.324691
32-0.065606-0.60130.274632
33-0.072457-0.66410.254228
34-0.072128-0.66110.25519
35-0.089724-0.82230.206608
36-0.107949-0.98940.162661
37-0.125846-1.15340.12601
38-0.148784-1.36360.088165
39-0.163196-1.49570.069237
40-0.17563-1.60970.055611
41-0.192656-1.76570.040538
42-0.214034-1.96170.026558
43-0.224399-2.05670.021411
44-0.232894-2.13450.017858
45-0.244583-2.24160.013811
46-0.259547-2.37880.009819
47-0.283574-2.5990.005521
48-0.299113-2.74140.003737

\begin{tabular}{lllllllll}
\hline
Autocorrelation Function \tabularnewline
Time lag k & ACF(k) & T-STAT & P-value \tabularnewline
1 & 0.938514 & 8.6016 & 0 \tabularnewline
2 & 0.864814 & 7.9262 & 0 \tabularnewline
3 & 0.805532 & 7.3828 & 0 \tabularnewline
4 & 0.750045 & 6.8743 & 0 \tabularnewline
5 & 0.70832 & 6.4919 & 0 \tabularnewline
6 & 0.661969 & 6.067 & 0 \tabularnewline
7 & 0.63026 & 5.7764 & 0 \tabularnewline
8 & 0.608361 & 5.5757 & 0 \tabularnewline
9 & 0.6002 & 5.5009 & 0 \tabularnewline
10 & 0.589095 & 5.3991 & 0 \tabularnewline
11 & 0.570643 & 5.23 & 1e-06 \tabularnewline
12 & 0.565682 & 5.1846 & 1e-06 \tabularnewline
13 & 0.523339 & 4.7965 & 3e-06 \tabularnewline
14 & 0.463183 & 4.2451 & 2.8e-05 \tabularnewline
15 & 0.411138 & 3.7681 & 0.000152 \tabularnewline
16 & 0.364842 & 3.3438 & 0.000618 \tabularnewline
17 & 0.331864 & 3.0416 & 0.00157 \tabularnewline
18 & 0.29358 & 2.6907 & 0.004301 \tabularnewline
19 & 0.259332 & 2.3768 & 0.009868 \tabularnewline
20 & 0.233391 & 2.1391 & 0.017666 \tabularnewline
21 & 0.226998 & 2.0805 & 0.020265 \tabularnewline
22 & 0.219025 & 2.0074 & 0.023961 \tabularnewline
23 & 0.192935 & 1.7683 & 0.040322 \tabularnewline
24 & 0.17733 & 1.6253 & 0.053927 \tabularnewline
25 & 0.144323 & 1.3227 & 0.094756 \tabularnewline
26 & 0.096975 & 0.8888 & 0.188326 \tabularnewline
27 & 0.058802 & 0.5389 & 0.29568 \tabularnewline
28 & 0.023426 & 0.2147 & 0.41526 \tabularnewline
29 & -0.00272 & -0.0249 & 0.490084 \tabularnewline
30 & -0.030013 & -0.2751 & 0.391966 \tabularnewline
31 & -0.049782 & -0.4563 & 0.324691 \tabularnewline
32 & -0.065606 & -0.6013 & 0.274632 \tabularnewline
33 & -0.072457 & -0.6641 & 0.254228 \tabularnewline
34 & -0.072128 & -0.6611 & 0.25519 \tabularnewline
35 & -0.089724 & -0.8223 & 0.206608 \tabularnewline
36 & -0.107949 & -0.9894 & 0.162661 \tabularnewline
37 & -0.125846 & -1.1534 & 0.12601 \tabularnewline
38 & -0.148784 & -1.3636 & 0.088165 \tabularnewline
39 & -0.163196 & -1.4957 & 0.069237 \tabularnewline
40 & -0.17563 & -1.6097 & 0.055611 \tabularnewline
41 & -0.192656 & -1.7657 & 0.040538 \tabularnewline
42 & -0.214034 & -1.9617 & 0.026558 \tabularnewline
43 & -0.224399 & -2.0567 & 0.021411 \tabularnewline
44 & -0.232894 & -2.1345 & 0.017858 \tabularnewline
45 & -0.244583 & -2.2416 & 0.013811 \tabularnewline
46 & -0.259547 & -2.3788 & 0.009819 \tabularnewline
47 & -0.283574 & -2.599 & 0.005521 \tabularnewline
48 & -0.299113 & -2.7414 & 0.003737 \tabularnewline
\hline
\end{tabular}
%Source: https://freestatistics.org/blog/index.php?pk=79094&T=1

[TABLE]
[ROW][C]Autocorrelation Function[/C][/ROW]
[ROW][C]Time lag k[/C][C]ACF(k)[/C][C]T-STAT[/C][C]P-value[/C][/ROW]
[ROW][C]1[/C][C]0.938514[/C][C]8.6016[/C][C]0[/C][/ROW]
[ROW][C]2[/C][C]0.864814[/C][C]7.9262[/C][C]0[/C][/ROW]
[ROW][C]3[/C][C]0.805532[/C][C]7.3828[/C][C]0[/C][/ROW]
[ROW][C]4[/C][C]0.750045[/C][C]6.8743[/C][C]0[/C][/ROW]
[ROW][C]5[/C][C]0.70832[/C][C]6.4919[/C][C]0[/C][/ROW]
[ROW][C]6[/C][C]0.661969[/C][C]6.067[/C][C]0[/C][/ROW]
[ROW][C]7[/C][C]0.63026[/C][C]5.7764[/C][C]0[/C][/ROW]
[ROW][C]8[/C][C]0.608361[/C][C]5.5757[/C][C]0[/C][/ROW]
[ROW][C]9[/C][C]0.6002[/C][C]5.5009[/C][C]0[/C][/ROW]
[ROW][C]10[/C][C]0.589095[/C][C]5.3991[/C][C]0[/C][/ROW]
[ROW][C]11[/C][C]0.570643[/C][C]5.23[/C][C]1e-06[/C][/ROW]
[ROW][C]12[/C][C]0.565682[/C][C]5.1846[/C][C]1e-06[/C][/ROW]
[ROW][C]13[/C][C]0.523339[/C][C]4.7965[/C][C]3e-06[/C][/ROW]
[ROW][C]14[/C][C]0.463183[/C][C]4.2451[/C][C]2.8e-05[/C][/ROW]
[ROW][C]15[/C][C]0.411138[/C][C]3.7681[/C][C]0.000152[/C][/ROW]
[ROW][C]16[/C][C]0.364842[/C][C]3.3438[/C][C]0.000618[/C][/ROW]
[ROW][C]17[/C][C]0.331864[/C][C]3.0416[/C][C]0.00157[/C][/ROW]
[ROW][C]18[/C][C]0.29358[/C][C]2.6907[/C][C]0.004301[/C][/ROW]
[ROW][C]19[/C][C]0.259332[/C][C]2.3768[/C][C]0.009868[/C][/ROW]
[ROW][C]20[/C][C]0.233391[/C][C]2.1391[/C][C]0.017666[/C][/ROW]
[ROW][C]21[/C][C]0.226998[/C][C]2.0805[/C][C]0.020265[/C][/ROW]
[ROW][C]22[/C][C]0.219025[/C][C]2.0074[/C][C]0.023961[/C][/ROW]
[ROW][C]23[/C][C]0.192935[/C][C]1.7683[/C][C]0.040322[/C][/ROW]
[ROW][C]24[/C][C]0.17733[/C][C]1.6253[/C][C]0.053927[/C][/ROW]
[ROW][C]25[/C][C]0.144323[/C][C]1.3227[/C][C]0.094756[/C][/ROW]
[ROW][C]26[/C][C]0.096975[/C][C]0.8888[/C][C]0.188326[/C][/ROW]
[ROW][C]27[/C][C]0.058802[/C][C]0.5389[/C][C]0.29568[/C][/ROW]
[ROW][C]28[/C][C]0.023426[/C][C]0.2147[/C][C]0.41526[/C][/ROW]
[ROW][C]29[/C][C]-0.00272[/C][C]-0.0249[/C][C]0.490084[/C][/ROW]
[ROW][C]30[/C][C]-0.030013[/C][C]-0.2751[/C][C]0.391966[/C][/ROW]
[ROW][C]31[/C][C]-0.049782[/C][C]-0.4563[/C][C]0.324691[/C][/ROW]
[ROW][C]32[/C][C]-0.065606[/C][C]-0.6013[/C][C]0.274632[/C][/ROW]
[ROW][C]33[/C][C]-0.072457[/C][C]-0.6641[/C][C]0.254228[/C][/ROW]
[ROW][C]34[/C][C]-0.072128[/C][C]-0.6611[/C][C]0.25519[/C][/ROW]
[ROW][C]35[/C][C]-0.089724[/C][C]-0.8223[/C][C]0.206608[/C][/ROW]
[ROW][C]36[/C][C]-0.107949[/C][C]-0.9894[/C][C]0.162661[/C][/ROW]
[ROW][C]37[/C][C]-0.125846[/C][C]-1.1534[/C][C]0.12601[/C][/ROW]
[ROW][C]38[/C][C]-0.148784[/C][C]-1.3636[/C][C]0.088165[/C][/ROW]
[ROW][C]39[/C][C]-0.163196[/C][C]-1.4957[/C][C]0.069237[/C][/ROW]
[ROW][C]40[/C][C]-0.17563[/C][C]-1.6097[/C][C]0.055611[/C][/ROW]
[ROW][C]41[/C][C]-0.192656[/C][C]-1.7657[/C][C]0.040538[/C][/ROW]
[ROW][C]42[/C][C]-0.214034[/C][C]-1.9617[/C][C]0.026558[/C][/ROW]
[ROW][C]43[/C][C]-0.224399[/C][C]-2.0567[/C][C]0.021411[/C][/ROW]
[ROW][C]44[/C][C]-0.232894[/C][C]-2.1345[/C][C]0.017858[/C][/ROW]
[ROW][C]45[/C][C]-0.244583[/C][C]-2.2416[/C][C]0.013811[/C][/ROW]
[ROW][C]46[/C][C]-0.259547[/C][C]-2.3788[/C][C]0.009819[/C][/ROW]
[ROW][C]47[/C][C]-0.283574[/C][C]-2.599[/C][C]0.005521[/C][/ROW]
[ROW][C]48[/C][C]-0.299113[/C][C]-2.7414[/C][C]0.003737[/C][/ROW]
[/TABLE]
Source: https://freestatistics.org/blog/index.php?pk=79094&T=1

Globally Unique Identifier (entire table): ba.freestatistics.org/blog/index.php?pk=79094&T=1

As an alternative you can also use a QR Code:  

The GUIDs for individual cells are displayed in the table below:

Autocorrelation Function
Time lag kACF(k)T-STATP-value
10.9385148.60160
20.8648147.92620
30.8055327.38280
40.7500456.87430
50.708326.49190
60.6619696.0670
70.630265.77640
80.6083615.57570
90.60025.50090
100.5890955.39910
110.5706435.231e-06
120.5656825.18461e-06
130.5233394.79653e-06
140.4631834.24512.8e-05
150.4111383.76810.000152
160.3648423.34380.000618
170.3318643.04160.00157
180.293582.69070.004301
190.2593322.37680.009868
200.2333912.13910.017666
210.2269982.08050.020265
220.2190252.00740.023961
230.1929351.76830.040322
240.177331.62530.053927
250.1443231.32270.094756
260.0969750.88880.188326
270.0588020.53890.29568
280.0234260.21470.41526
29-0.00272-0.02490.490084
30-0.030013-0.27510.391966
31-0.049782-0.45630.324691
32-0.065606-0.60130.274632
33-0.072457-0.66410.254228
34-0.072128-0.66110.25519
35-0.089724-0.82230.206608
36-0.107949-0.98940.162661
37-0.125846-1.15340.12601
38-0.148784-1.36360.088165
39-0.163196-1.49570.069237
40-0.17563-1.60970.055611
41-0.192656-1.76570.040538
42-0.214034-1.96170.026558
43-0.224399-2.05670.021411
44-0.232894-2.13450.017858
45-0.244583-2.24160.013811
46-0.259547-2.37880.009819
47-0.283574-2.5990.005521
48-0.299113-2.74140.003737


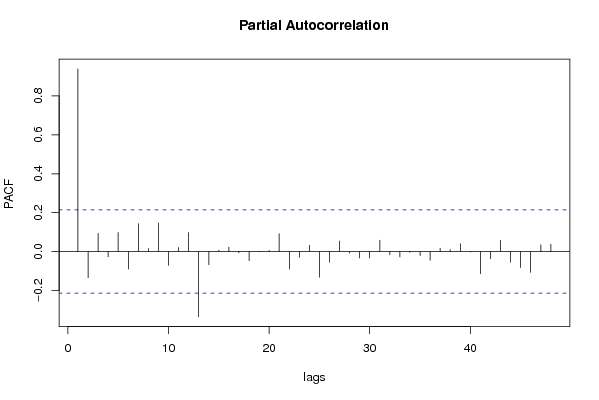
Partial Autocorrelation Function
Time lag kPACF(k)T-STATP-value
10.9385148.60160
2-0.134188-1.22990.111092
30.0932720.85480.197533
4-0.026842-0.2460.403137
50.0975860.89440.186834
6-0.089487-0.82020.207223
70.1431971.31240.096476
80.0156790.14370.44304
90.1473621.35060.090226
10-0.070672-0.64770.259465
110.0214140.19630.42244
120.0979180.89740.186027
13-0.334322-3.06410.001467
14-0.066989-0.6140.27045
150.006410.05870.476647
160.0224950.20620.41858
17-0.00561-0.05140.479558
18-0.046946-0.43030.33405
19-0.001148-0.01050.495816
200.006130.05620.477664
210.0921030.84410.200494
22-0.088922-0.8150.208694
23-0.02942-0.26960.394051
240.0328860.30140.381925
25-0.131567-1.20580.115634
26-0.054526-0.49970.309283
270.0540310.49520.310877
28-0.007814-0.07160.471537
29-0.032884-0.30140.381933
30-0.032627-0.2990.382828
310.058850.53940.295531
32-0.016164-0.14810.441293
33-0.027498-0.2520.400818
34-0.003531-0.03240.487129
35-0.020186-0.1850.426834
36-0.044669-0.40940.341644
370.0177560.16270.435558
380.0105450.09660.461618
390.039870.36540.35786
40-0.001844-0.01690.493277
41-0.113601-1.04120.150393
42-0.037182-0.34080.367062
430.0579160.53080.298476
44-0.054185-0.49660.310381
45-0.081826-0.750.22769
46-0.106795-0.97880.165248
470.0350480.32120.37442
480.0377720.34620.365034

\begin{tabular}{lllllllll}
\hline
Partial Autocorrelation Function \tabularnewline
Time lag k & PACF(k) & T-STAT & P-value \tabularnewline
1 & 0.938514 & 8.6016 & 0 \tabularnewline
2 & -0.134188 & -1.2299 & 0.111092 \tabularnewline
3 & 0.093272 & 0.8548 & 0.197533 \tabularnewline
4 & -0.026842 & -0.246 & 0.403137 \tabularnewline
5 & 0.097586 & 0.8944 & 0.186834 \tabularnewline
6 & -0.089487 & -0.8202 & 0.207223 \tabularnewline
7 & 0.143197 & 1.3124 & 0.096476 \tabularnewline
8 & 0.015679 & 0.1437 & 0.44304 \tabularnewline
9 & 0.147362 & 1.3506 & 0.090226 \tabularnewline
10 & -0.070672 & -0.6477 & 0.259465 \tabularnewline
11 & 0.021414 & 0.1963 & 0.42244 \tabularnewline
12 & 0.097918 & 0.8974 & 0.186027 \tabularnewline
13 & -0.334322 & -3.0641 & 0.001467 \tabularnewline
14 & -0.066989 & -0.614 & 0.27045 \tabularnewline
15 & 0.00641 & 0.0587 & 0.476647 \tabularnewline
16 & 0.022495 & 0.2062 & 0.41858 \tabularnewline
17 & -0.00561 & -0.0514 & 0.479558 \tabularnewline
18 & -0.046946 & -0.4303 & 0.33405 \tabularnewline
19 & -0.001148 & -0.0105 & 0.495816 \tabularnewline
20 & 0.00613 & 0.0562 & 0.477664 \tabularnewline
21 & 0.092103 & 0.8441 & 0.200494 \tabularnewline
22 & -0.088922 & -0.815 & 0.208694 \tabularnewline
23 & -0.02942 & -0.2696 & 0.394051 \tabularnewline
24 & 0.032886 & 0.3014 & 0.381925 \tabularnewline
25 & -0.131567 & -1.2058 & 0.115634 \tabularnewline
26 & -0.054526 & -0.4997 & 0.309283 \tabularnewline
27 & 0.054031 & 0.4952 & 0.310877 \tabularnewline
28 & -0.007814 & -0.0716 & 0.471537 \tabularnewline
29 & -0.032884 & -0.3014 & 0.381933 \tabularnewline
30 & -0.032627 & -0.299 & 0.382828 \tabularnewline
31 & 0.05885 & 0.5394 & 0.295531 \tabularnewline
32 & -0.016164 & -0.1481 & 0.441293 \tabularnewline
33 & -0.027498 & -0.252 & 0.400818 \tabularnewline
34 & -0.003531 & -0.0324 & 0.487129 \tabularnewline
35 & -0.020186 & -0.185 & 0.426834 \tabularnewline
36 & -0.044669 & -0.4094 & 0.341644 \tabularnewline
37 & 0.017756 & 0.1627 & 0.435558 \tabularnewline
38 & 0.010545 & 0.0966 & 0.461618 \tabularnewline
39 & 0.03987 & 0.3654 & 0.35786 \tabularnewline
40 & -0.001844 & -0.0169 & 0.493277 \tabularnewline
41 & -0.113601 & -1.0412 & 0.150393 \tabularnewline
42 & -0.037182 & -0.3408 & 0.367062 \tabularnewline
43 & 0.057916 & 0.5308 & 0.298476 \tabularnewline
44 & -0.054185 & -0.4966 & 0.310381 \tabularnewline
45 & -0.081826 & -0.75 & 0.22769 \tabularnewline
46 & -0.106795 & -0.9788 & 0.165248 \tabularnewline
47 & 0.035048 & 0.3212 & 0.37442 \tabularnewline
48 & 0.037772 & 0.3462 & 0.365034 \tabularnewline
\hline
\end{tabular}
%Source: https://freestatistics.org/blog/index.php?pk=79094&T=2

[TABLE]
[ROW][C]Partial Autocorrelation Function[/C][/ROW]
[ROW][C]Time lag k[/C][C]PACF(k)[/C][C]T-STAT[/C][C]P-value[/C][/ROW]
[ROW][C]1[/C][C]0.938514[/C][C]8.6016[/C][C]0[/C][/ROW]
[ROW][C]2[/C][C]-0.134188[/C][C]-1.2299[/C][C]0.111092[/C][/ROW]
[ROW][C]3[/C][C]0.093272[/C][C]0.8548[/C][C]0.197533[/C][/ROW]
[ROW][C]4[/C][C]-0.026842[/C][C]-0.246[/C][C]0.403137[/C][/ROW]
[ROW][C]5[/C][C]0.097586[/C][C]0.8944[/C][C]0.186834[/C][/ROW]
[ROW][C]6[/C][C]-0.089487[/C][C]-0.8202[/C][C]0.207223[/C][/ROW]
[ROW][C]7[/C][C]0.143197[/C][C]1.3124[/C][C]0.096476[/C][/ROW]
[ROW][C]8[/C][C]0.015679[/C][C]0.1437[/C][C]0.44304[/C][/ROW]
[ROW][C]9[/C][C]0.147362[/C][C]1.3506[/C][C]0.090226[/C][/ROW]
[ROW][C]10[/C][C]-0.070672[/C][C]-0.6477[/C][C]0.259465[/C][/ROW]
[ROW][C]11[/C][C]0.021414[/C][C]0.1963[/C][C]0.42244[/C][/ROW]
[ROW][C]12[/C][C]0.097918[/C][C]0.8974[/C][C]0.186027[/C][/ROW]
[ROW][C]13[/C][C]-0.334322[/C][C]-3.0641[/C][C]0.001467[/C][/ROW]
[ROW][C]14[/C][C]-0.066989[/C][C]-0.614[/C][C]0.27045[/C][/ROW]
[ROW][C]15[/C][C]0.00641[/C][C]0.0587[/C][C]0.476647[/C][/ROW]
[ROW][C]16[/C][C]0.022495[/C][C]0.2062[/C][C]0.41858[/C][/ROW]
[ROW][C]17[/C][C]-0.00561[/C][C]-0.0514[/C][C]0.479558[/C][/ROW]
[ROW][C]18[/C][C]-0.046946[/C][C]-0.4303[/C][C]0.33405[/C][/ROW]
[ROW][C]19[/C][C]-0.001148[/C][C]-0.0105[/C][C]0.495816[/C][/ROW]
[ROW][C]20[/C][C]0.00613[/C][C]0.0562[/C][C]0.477664[/C][/ROW]
[ROW][C]21[/C][C]0.092103[/C][C]0.8441[/C][C]0.200494[/C][/ROW]
[ROW][C]22[/C][C]-0.088922[/C][C]-0.815[/C][C]0.208694[/C][/ROW]
[ROW][C]23[/C][C]-0.02942[/C][C]-0.2696[/C][C]0.394051[/C][/ROW]
[ROW][C]24[/C][C]0.032886[/C][C]0.3014[/C][C]0.381925[/C][/ROW]
[ROW][C]25[/C][C]-0.131567[/C][C]-1.2058[/C][C]0.115634[/C][/ROW]
[ROW][C]26[/C][C]-0.054526[/C][C]-0.4997[/C][C]0.309283[/C][/ROW]
[ROW][C]27[/C][C]0.054031[/C][C]0.4952[/C][C]0.310877[/C][/ROW]
[ROW][C]28[/C][C]-0.007814[/C][C]-0.0716[/C][C]0.471537[/C][/ROW]
[ROW][C]29[/C][C]-0.032884[/C][C]-0.3014[/C][C]0.381933[/C][/ROW]
[ROW][C]30[/C][C]-0.032627[/C][C]-0.299[/C][C]0.382828[/C][/ROW]
[ROW][C]31[/C][C]0.05885[/C][C]0.5394[/C][C]0.295531[/C][/ROW]
[ROW][C]32[/C][C]-0.016164[/C][C]-0.1481[/C][C]0.441293[/C][/ROW]
[ROW][C]33[/C][C]-0.027498[/C][C]-0.252[/C][C]0.400818[/C][/ROW]
[ROW][C]34[/C][C]-0.003531[/C][C]-0.0324[/C][C]0.487129[/C][/ROW]
[ROW][C]35[/C][C]-0.020186[/C][C]-0.185[/C][C]0.426834[/C][/ROW]
[ROW][C]36[/C][C]-0.044669[/C][C]-0.4094[/C][C]0.341644[/C][/ROW]
[ROW][C]37[/C][C]0.017756[/C][C]0.1627[/C][C]0.435558[/C][/ROW]
[ROW][C]38[/C][C]0.010545[/C][C]0.0966[/C][C]0.461618[/C][/ROW]
[ROW][C]39[/C][C]0.03987[/C][C]0.3654[/C][C]0.35786[/C][/ROW]
[ROW][C]40[/C][C]-0.001844[/C][C]-0.0169[/C][C]0.493277[/C][/ROW]
[ROW][C]41[/C][C]-0.113601[/C][C]-1.0412[/C][C]0.150393[/C][/ROW]
[ROW][C]42[/C][C]-0.037182[/C][C]-0.3408[/C][C]0.367062[/C][/ROW]
[ROW][C]43[/C][C]0.057916[/C][C]0.5308[/C][C]0.298476[/C][/ROW]
[ROW][C]44[/C][C]-0.054185[/C][C]-0.4966[/C][C]0.310381[/C][/ROW]
[ROW][C]45[/C][C]-0.081826[/C][C]-0.75[/C][C]0.22769[/C][/ROW]
[ROW][C]46[/C][C]-0.106795[/C][C]-0.9788[/C][C]0.165248[/C][/ROW]
[ROW][C]47[/C][C]0.035048[/C][C]0.3212[/C][C]0.37442[/C][/ROW]
[ROW][C]48[/C][C]0.037772[/C][C]0.3462[/C][C]0.365034[/C][/ROW]
[/TABLE]
Source: https://freestatistics.org/blog/index.php?pk=79094&T=2

Globally Unique Identifier (entire table): ba.freestatistics.org/blog/index.php?pk=79094&T=2

As an alternative you can also use a QR Code:  

The GUIDs for individual cells are displayed in the table below:

Partial Autocorrelation Function
Time lag kPACF(k)T-STATP-value
10.9385148.60160
2-0.134188-1.22990.111092
30.0932720.85480.197533
4-0.026842-0.2460.403137
50.0975860.89440.186834
6-0.089487-0.82020.207223
70.1431971.31240.096476
80.0156790.14370.44304
90.1473621.35060.090226
10-0.070672-0.64770.259465
110.0214140.19630.42244
120.0979180.89740.186027
13-0.334322-3.06410.001467
14-0.066989-0.6140.27045
150.006410.05870.476647
160.0224950.20620.41858
17-0.00561-0.05140.479558
18-0.046946-0.43030.33405
19-0.001148-0.01050.495816
200.006130.05620.477664
210.0921030.84410.200494
22-0.088922-0.8150.208694
23-0.02942-0.26960.394051
240.0328860.30140.381925
25-0.131567-1.20580.115634
26-0.054526-0.49970.309283
270.0540310.49520.310877
28-0.007814-0.07160.471537
29-0.032884-0.30140.381933
30-0.032627-0.2990.382828
310.058850.53940.295531
32-0.016164-0.14810.441293
33-0.027498-0.2520.400818
34-0.003531-0.03240.487129
35-0.020186-0.1850.426834
36-0.044669-0.40940.341644
370.0177560.16270.435558
380.0105450.09660.461618
390.039870.36540.35786
40-0.001844-0.01690.493277
41-0.113601-1.04120.150393
42-0.037182-0.34080.367062
430.0579160.53080.298476
44-0.054185-0.49660.310381
45-0.081826-0.750.22769
46-0.106795-0.97880.165248
470.0350480.32120.37442
480.0377720.34620.365034


Parameters (Session):
par1 = 48 ; par2 = 1 ; par3 = 0 ; par4 = 0 ; par5 = 12 ; par6 = White Noise ; par7 = 0.95 ;
Parameters (R input):
par1 = 48 ; par2 = 1 ; par3 = 0 ; par4 = 0 ; par5 = 12 ; par6 = White Noise ; par7 = 0.95 ;
R code (references can be found in the software module):
if (par1 == 'Default') {
par1 = 10*log10(length(x))
} else {
par1 <- as.numeric(par1)
}
par2 <- as.numeric(par2)
par3 <- as.numeric(par3)
par4 <- as.numeric(par4)
par5 <- as.numeric(par5)
if (par6 == 'White Noise') par6 <- 'white' else par6 <- 'ma'
par7 <- as.numeric(par7)
if (par2 == 0) {
x <- log(x)
} else {
x <- (x ^ par2 - 1) / par2
}
if (par3 > 0) x <- diff(x,lag=1,difference=par3)
if (par4 > 0) x <- diff(x,lag=par5,difference=par4)
bitmap(file='pic1.png')
racf <- acf(x, par1, main='Autocorrelation', xlab='time lag', ylab='ACF', ci.type=par6, ci=par7, sub=paste('(lambda=',par2,', d=',par3,', D=',par4,', CI=', par7, ', CI type=',par6,')',sep=''))
dev.off()
bitmap(file='pic2.png')
rpacf <- pacf(x,par1,main='Partial Autocorrelation',xlab='lags',ylab='PACF')
dev.off()
(myacf <- c(racf$acf))
(mypacf <- c(rpacf$acf))
lengthx <- length(x)
sqrtn <- sqrt(lengthx)
load(file='createtable')
a<-table.start()
a<-table.row.start(a)
a<-table.element(a,'Autocorrelation Function',4,TRUE)
a<-table.row.end(a)
a<-table.row.start(a)
a<-table.element(a,'Time lag k',header=TRUE)
a<-table.element(a,hyperlink('basics.htm','ACF(k)','click here for more information about the Autocorrelation Function'),header=TRUE)
a<-table.element(a,'T-STAT',header=TRUE)
a<-table.element(a,'P-value',header=TRUE)
a<-table.row.end(a)
for (i in 2:(par1+1)) {
a<-table.row.start(a)
a<-table.element(a,i-1,header=TRUE)
a<-table.element(a,round(myacf[i],6))
mytstat <- myacf[i]*sqrtn
a<-table.element(a,round(mytstat,4))
a<-table.element(a,round(1-pt(abs(mytstat),lengthx),6))
a<-table.row.end(a)
}
a<-table.end(a)
table.save(a,file='mytable.tab')
a<-table.start()
a<-table.row.start(a)
a<-table.element(a,'Partial Autocorrelation Function',4,TRUE)
a<-table.row.end(a)
a<-table.row.start(a)
a<-table.element(a,'Time lag k',header=TRUE)
a<-table.element(a,hyperlink('basics.htm','PACF(k)','click here for more information about the Partial Autocorrelation Function'),header=TRUE)
a<-table.element(a,'T-STAT',header=TRUE)
a<-table.element(a,'P-value',header=TRUE)
a<-table.row.end(a)
for (i in 1:par1) {
a<-table.row.start(a)
a<-table.element(a,i,header=TRUE)
a<-table.element(a,round(mypacf[i],6))
mytstat <- mypacf[i]*sqrtn
a<-table.element(a,round(mytstat,4))
a<-table.element(a,round(1-pt(abs(mytstat),lengthx),6))
a<-table.row.end(a)
}
a<-table.end(a)
table.save(a,file='mytable1.tab')