Free Statistics

of Irreproducible Research!

Author's title

Author*Unverified author*
R Software Modulerwasp_smp.wasp
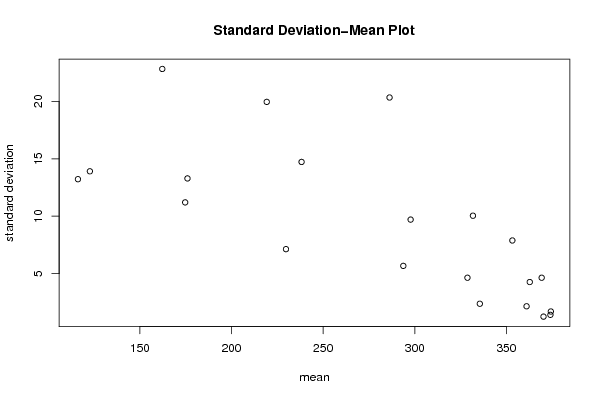
Title produced by softwareStandard Deviation-Mean Plot
Date of computationTue, 17 Aug 2010 11:11:11 +0000
Cite this page as followsStatistical Computations at FreeStatistics.org, Office for Research Development and Education, URL https://freestatistics.org/blog/index.php?v=date/2010/Aug/17/t128204344947c9h9t7pqea7fq.htm/, Retrieved Sat, 27 Apr 2024 08:05:03 +0000
Statistical Computations at FreeStatistics.org, Office for Research Development and Education, URL https://freestatistics.org/blog/index.php?pk=79083, Retrieved Sat, 27 Apr 2024 08:05:03 +0000
QR Codes:

Original text written by user:
IsPrivate?No (this computation is public)
User-defined keywordsmattias debbaut
Estimated Impact160
Family? (F = Feedback message, R = changed R code, M = changed R Module, P = changed Parameters, D = changed Data)
-       [Standard Deviation-Mean Plot] [sd mean plot - ve...] [2010-08-17 11:11:11] [59fa324537f53fb6459bc6951db20f7b] [Current]
Feedback Forum

Post a new message
Dataseries X:
376
375
374
372
370
369
370
372
373
373
374
376
371
374
369
363
357
366
362
366
361
362
358
363
360
360
348
345
332
333
323
327
332
337
336
337
343
337
326
321
309
302
293
287
292
292
289
302
310
295
276
264
257
243
227
226
226
229
224
240
244
226
208
199
193
180
167
164
166
173
169
191
193
166
143
147
139
129
115
108
106
116
108
135


Summary of computational transaction
Raw Inputview raw input (R code)
Raw Outputview raw output of R engine
Computing time1 seconds
R Server'George Udny Yule' @ 72.249.76.132

\begin{tabular}{lllllllll}
\hline
Summary of computational transaction \tabularnewline
Raw Input & view raw input (R code)  \tabularnewline
Raw Output & view raw output of R engine  \tabularnewline
Computing time & 1 seconds \tabularnewline
R Server & 'George Udny Yule' @ 72.249.76.132 \tabularnewline
\hline
\end{tabular}
%Source: https://freestatistics.org/blog/index.php?pk=79083&T=0

[TABLE]
[ROW][C]Summary of computational transaction[/C][/ROW]
[ROW][C]Raw Input[/C][C]view raw input (R code) [/C][/ROW]
[ROW][C]Raw Output[/C][C]view raw output of R engine [/C][/ROW]
[ROW][C]Computing time[/C][C]1 seconds[/C][/ROW]
[ROW][C]R Server[/C][C]'George Udny Yule' @ 72.249.76.132[/C][/ROW]
[/TABLE]
Source: https://freestatistics.org/blog/index.php?pk=79083&T=0

Globally Unique Identifier (entire table): ba.freestatistics.org/blog/index.php?pk=79083&T=0

As an alternative you can also use a QR Code:  

The GUIDs for individual cells are displayed in the table below:

Summary of computational transaction
Raw Inputview raw input (R code)
Raw Outputview raw output of R engine
Computing time1 seconds
R Server'George Udny Yule' @ 72.249.76.132


Standard Deviation-Mean Plot
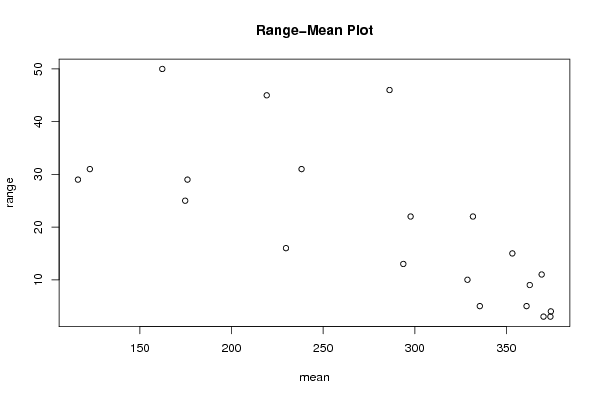
SectionMeanStandard DeviationRange
1374.251.707825127659934
2370.251.258305739211793
33741.414213562373103
4369.254.6457866215887811
5362.754.272001872658779
63612.160246899469295
7353.257.8898669190297515
8328.754.6457866215887810
9335.52.380476142847625
10331.7510.045728777279822
11297.759.708243919473822
12293.755.6789083458002713
13286.2520.336748347101446
14238.2514.728091073410231
15229.757.1355915428692216
16219.2519.956202043475145
1717613.291601358251329
18174.7511.206396982676225
19162.2522.823598898216450
20122.7513.913422775626931
21116.2513.225606476327229

\begin{tabular}{lllllllll}
\hline
Standard Deviation-Mean Plot \tabularnewline
Section & Mean & Standard Deviation & Range \tabularnewline
1 & 374.25 & 1.70782512765993 & 4 \tabularnewline
2 & 370.25 & 1.25830573921179 & 3 \tabularnewline
3 & 374 & 1.41421356237310 & 3 \tabularnewline
4 & 369.25 & 4.64578662158878 & 11 \tabularnewline
5 & 362.75 & 4.27200187265877 & 9 \tabularnewline
6 & 361 & 2.16024689946929 & 5 \tabularnewline
7 & 353.25 & 7.88986691902975 & 15 \tabularnewline
8 & 328.75 & 4.64578662158878 & 10 \tabularnewline
9 & 335.5 & 2.38047614284762 & 5 \tabularnewline
10 & 331.75 & 10.0457287772798 & 22 \tabularnewline
11 & 297.75 & 9.7082439194738 & 22 \tabularnewline
12 & 293.75 & 5.67890834580027 & 13 \tabularnewline
13 & 286.25 & 20.3367483471014 & 46 \tabularnewline
14 & 238.25 & 14.7280910734102 & 31 \tabularnewline
15 & 229.75 & 7.13559154286922 & 16 \tabularnewline
16 & 219.25 & 19.9562020434751 & 45 \tabularnewline
17 & 176 & 13.2916013582513 & 29 \tabularnewline
18 & 174.75 & 11.2063969826762 & 25 \tabularnewline
19 & 162.25 & 22.8235988982164 & 50 \tabularnewline
20 & 122.75 & 13.9134227756269 & 31 \tabularnewline
21 & 116.25 & 13.2256064763272 & 29 \tabularnewline
\hline
\end{tabular}
%Source: https://freestatistics.org/blog/index.php?pk=79083&T=1

[TABLE]
[ROW][C]Standard Deviation-Mean Plot[/C][/ROW]
[ROW][C]Section[/C][C]Mean[/C][C]Standard Deviation[/C][C]Range[/C][/ROW]
[ROW][C]1[/C][C]374.25[/C][C]1.70782512765993[/C][C]4[/C][/ROW]
[ROW][C]2[/C][C]370.25[/C][C]1.25830573921179[/C][C]3[/C][/ROW]
[ROW][C]3[/C][C]374[/C][C]1.41421356237310[/C][C]3[/C][/ROW]
[ROW][C]4[/C][C]369.25[/C][C]4.64578662158878[/C][C]11[/C][/ROW]
[ROW][C]5[/C][C]362.75[/C][C]4.27200187265877[/C][C]9[/C][/ROW]
[ROW][C]6[/C][C]361[/C][C]2.16024689946929[/C][C]5[/C][/ROW]
[ROW][C]7[/C][C]353.25[/C][C]7.88986691902975[/C][C]15[/C][/ROW]
[ROW][C]8[/C][C]328.75[/C][C]4.64578662158878[/C][C]10[/C][/ROW]
[ROW][C]9[/C][C]335.5[/C][C]2.38047614284762[/C][C]5[/C][/ROW]
[ROW][C]10[/C][C]331.75[/C][C]10.0457287772798[/C][C]22[/C][/ROW]
[ROW][C]11[/C][C]297.75[/C][C]9.7082439194738[/C][C]22[/C][/ROW]
[ROW][C]12[/C][C]293.75[/C][C]5.67890834580027[/C][C]13[/C][/ROW]
[ROW][C]13[/C][C]286.25[/C][C]20.3367483471014[/C][C]46[/C][/ROW]
[ROW][C]14[/C][C]238.25[/C][C]14.7280910734102[/C][C]31[/C][/ROW]
[ROW][C]15[/C][C]229.75[/C][C]7.13559154286922[/C][C]16[/C][/ROW]
[ROW][C]16[/C][C]219.25[/C][C]19.9562020434751[/C][C]45[/C][/ROW]
[ROW][C]17[/C][C]176[/C][C]13.2916013582513[/C][C]29[/C][/ROW]
[ROW][C]18[/C][C]174.75[/C][C]11.2063969826762[/C][C]25[/C][/ROW]
[ROW][C]19[/C][C]162.25[/C][C]22.8235988982164[/C][C]50[/C][/ROW]
[ROW][C]20[/C][C]122.75[/C][C]13.9134227756269[/C][C]31[/C][/ROW]
[ROW][C]21[/C][C]116.25[/C][C]13.2256064763272[/C][C]29[/C][/ROW]
[/TABLE]
Source: https://freestatistics.org/blog/index.php?pk=79083&T=1

Globally Unique Identifier (entire table): ba.freestatistics.org/blog/index.php?pk=79083&T=1

As an alternative you can also use a QR Code:  

The GUIDs for individual cells are displayed in the table below:

Standard Deviation-Mean Plot
SectionMeanStandard DeviationRange
1374.251.707825127659934
2370.251.258305739211793
33741.414213562373103
4369.254.6457866215887811
5362.754.272001872658779
63612.160246899469295
7353.257.8898669190297515
8328.754.6457866215887810
9335.52.380476142847625
10331.7510.045728777279822
11297.759.708243919473822
12293.755.6789083458002713
13286.2520.336748347101446
14238.2514.728091073410231
15229.757.1355915428692216
16219.2519.956202043475145
1717613.291601358251329
18174.7511.206396982676225
19162.2522.823598898216450
20122.7513.913422775626931
21116.2513.225606476327229


Regression: S.E.(k) = alpha + beta * Mean(k)
alpha24.5103682014567
beta-0.0548327305829024
S.D.0.0116746925064664
T-STAT-4.69671732703294
p-value0.000157081627755695

\begin{tabular}{lllllllll}
\hline
Regression: S.E.(k) = alpha + beta * Mean(k) \tabularnewline
alpha & 24.5103682014567 \tabularnewline
beta & -0.0548327305829024 \tabularnewline
S.D. & 0.0116746925064664 \tabularnewline
T-STAT & -4.69671732703294 \tabularnewline
p-value & 0.000157081627755695 \tabularnewline
\hline
\end{tabular}
%Source: https://freestatistics.org/blog/index.php?pk=79083&T=2

[TABLE]
[ROW][C]Regression: S.E.(k) = alpha + beta * Mean(k)[/C][/ROW]
[ROW][C]alpha[/C][C]24.5103682014567[/C][/ROW]
[ROW][C]beta[/C][C]-0.0548327305829024[/C][/ROW]
[ROW][C]S.D.[/C][C]0.0116746925064664[/C][/ROW]
[ROW][C]T-STAT[/C][C]-4.69671732703294[/C][/ROW]
[ROW][C]p-value[/C][C]0.000157081627755695[/C][/ROW]
[/TABLE]
Source: https://freestatistics.org/blog/index.php?pk=79083&T=2

Globally Unique Identifier (entire table): ba.freestatistics.org/blog/index.php?pk=79083&T=2

As an alternative you can also use a QR Code:  

The GUIDs for individual cells are displayed in the table below:

Regression: S.E.(k) = alpha + beta * Mean(k)
alpha24.5103682014567
beta-0.0548327305829024
S.D.0.0116746925064664
T-STAT-4.69671732703294
p-value0.000157081627755695


Regression: ln S.E.(k) = alpha + beta * ln Mean(k)
alpha11.2598696413651
beta-1.68106799655737
S.D.0.397360391371039
T-STAT-4.23058773109485
p-value0.000452611240680747
Lambda2.68106799655737

\begin{tabular}{lllllllll}
\hline
Regression: ln S.E.(k) = alpha + beta * ln Mean(k) \tabularnewline
alpha & 11.2598696413651 \tabularnewline
beta & -1.68106799655737 \tabularnewline
S.D. & 0.397360391371039 \tabularnewline
T-STAT & -4.23058773109485 \tabularnewline
p-value & 0.000452611240680747 \tabularnewline
Lambda & 2.68106799655737 \tabularnewline
\hline
\end{tabular}
%Source: https://freestatistics.org/blog/index.php?pk=79083&T=3

[TABLE]
[ROW][C]Regression: ln S.E.(k) = alpha + beta * ln Mean(k)[/C][/ROW]
[ROW][C]alpha[/C][C]11.2598696413651[/C][/ROW]
[ROW][C]beta[/C][C]-1.68106799655737[/C][/ROW]
[ROW][C]S.D.[/C][C]0.397360391371039[/C][/ROW]
[ROW][C]T-STAT[/C][C]-4.23058773109485[/C][/ROW]
[ROW][C]p-value[/C][C]0.000452611240680747[/C][/ROW]
[ROW][C]Lambda[/C][C]2.68106799655737[/C][/ROW]
[/TABLE]
Source: https://freestatistics.org/blog/index.php?pk=79083&T=3

Globally Unique Identifier (entire table): ba.freestatistics.org/blog/index.php?pk=79083&T=3

As an alternative you can also use a QR Code:  

The GUIDs for individual cells are displayed in the table below:

Regression: ln S.E.(k) = alpha + beta * ln Mean(k)
alpha11.2598696413651
beta-1.68106799655737
S.D.0.397360391371039
T-STAT-4.23058773109485
p-value0.000452611240680747
Lambda2.68106799655737


Parameters (Session):
par1 = 4 ;
Parameters (R input):
par1 = 4 ;
R code (references can be found in the software module):
par1 <- as.numeric(par1)
(n <- length(x))
(np <- floor(n / par1))
arr <- array(NA,dim=c(par1,np))
j <- 0
k <- 1
for (i in 1:(np*par1))
{
j = j + 1
arr[j,k] <- x[i]
if (j == par1) {
j = 0
k=k+1
}
}
arr
arr.mean <- array(NA,dim=np)
arr.sd <- array(NA,dim=np)
arr.range <- array(NA,dim=np)
for (j in 1:np)
{
arr.mean[j] <- mean(arr[,j],na.rm=TRUE)
arr.sd[j] <- sd(arr[,j],na.rm=TRUE)
arr.range[j] <- max(arr[,j],na.rm=TRUE) - min(arr[,j],na.rm=TRUE)
}
arr.mean
arr.sd
arr.range
(lm1 <- lm(arr.sd~arr.mean))
(lnlm1 <- lm(log(arr.sd)~log(arr.mean)))
(lm2 <- lm(arr.range~arr.mean))
bitmap(file='test1.png')
plot(arr.mean,arr.sd,main='Standard Deviation-Mean Plot',xlab='mean',ylab='standard deviation')
dev.off()
bitmap(file='test2.png')
plot(arr.mean,arr.range,main='Range-Mean Plot',xlab='mean',ylab='range')
dev.off()
load(file='createtable')
a<-table.start()
a<-table.row.start(a)
a<-table.element(a,'Standard Deviation-Mean Plot',4,TRUE)
a<-table.row.end(a)
a<-table.row.start(a)
a<-table.element(a,'Section',header=TRUE)
a<-table.element(a,'Mean',header=TRUE)
a<-table.element(a,'Standard Deviation',header=TRUE)
a<-table.element(a,'Range',header=TRUE)
a<-table.row.end(a)
for (j in 1:np) {
a<-table.row.start(a)
a<-table.element(a,j,header=TRUE)
a<-table.element(a,arr.mean[j])
a<-table.element(a,arr.sd[j] )
a<-table.element(a,arr.range[j] )
a<-table.row.end(a)
}
a<-table.end(a)
table.save(a,file='mytable.tab')
a<-table.start()
a<-table.row.start(a)
a<-table.element(a,'Regression: S.E.(k) = alpha + beta * Mean(k)',2,TRUE)
a<-table.row.end(a)
a<-table.row.start(a)
a<-table.element(a,'alpha',header=TRUE)
a<-table.element(a,lm1$coefficients[[1]])
a<-table.row.end(a)
a<-table.row.start(a)
a<-table.element(a,'beta',header=TRUE)
a<-table.element(a,lm1$coefficients[[2]])
a<-table.row.end(a)
a<-table.row.start(a)
a<-table.element(a,'S.D.',header=TRUE)
a<-table.element(a,summary(lm1)$coefficients[2,2])
a<-table.row.end(a)
a<-table.row.start(a)
a<-table.element(a,'T-STAT',header=TRUE)
a<-table.element(a,summary(lm1)$coefficients[2,3])
a<-table.row.end(a)
a<-table.row.start(a)
a<-table.element(a,'p-value',header=TRUE)
a<-table.element(a,summary(lm1)$coefficients[2,4])
a<-table.row.end(a)
a<-table.end(a)
table.save(a,file='mytable1.tab')
a<-table.start()
a<-table.row.start(a)
a<-table.element(a,'Regression: ln S.E.(k) = alpha + beta * ln Mean(k)',2,TRUE)
a<-table.row.end(a)
a<-table.row.start(a)
a<-table.element(a,'alpha',header=TRUE)
a<-table.element(a,lnlm1$coefficients[[1]])
a<-table.row.end(a)
a<-table.row.start(a)
a<-table.element(a,'beta',header=TRUE)
a<-table.element(a,lnlm1$coefficients[[2]])
a<-table.row.end(a)
a<-table.row.start(a)
a<-table.element(a,'S.D.',header=TRUE)
a<-table.element(a,summary(lnlm1)$coefficients[2,2])
a<-table.row.end(a)
a<-table.row.start(a)
a<-table.element(a,'T-STAT',header=TRUE)
a<-table.element(a,summary(lnlm1)$coefficients[2,3])
a<-table.row.end(a)
a<-table.row.start(a)
a<-table.element(a,'p-value',header=TRUE)
a<-table.element(a,summary(lnlm1)$coefficients[2,4])
a<-table.row.end(a)
a<-table.row.start(a)
a<-table.element(a,'Lambda',header=TRUE)
a<-table.element(a,1-lnlm1$coefficients[[2]])
a<-table.row.end(a)
a<-table.end(a)
table.save(a,file='mytable2.tab')