Free Statistics

of Irreproducible Research!

Author's title

Author*Unverified author*
R Software Modulerwasp_autocorrelation.wasp
Title produced by software(Partial) Autocorrelation Function
Date of computationTue, 17 Aug 2010 10:49:33 +0000
Cite this page as followsStatistical Computations at FreeStatistics.org, Office for Research Development and Education, URL https://freestatistics.org/blog/index.php?v=date/2010/Aug/17/t12820423825id32sop13khdup.htm/, Retrieved Sat, 27 Apr 2024 11:03:04 +0000
Statistical Computations at FreeStatistics.org, Office for Research Development and Education, URL https://freestatistics.org/blog/index.php?pk=79079, Retrieved Sat, 27 Apr 2024 11:03:04 +0000
QR Codes:

Original text written by user:
IsPrivate?No (this computation is public)
User-defined keywordsDeGroodtOlivierStap20
Estimated Impact155
Family? (F = Feedback message, R = changed R code, M = changed R Module, P = changed Parameters, D = changed Data)
-       [(Partial) Autocorrelation Function] [] [2010-08-17 10:49:33] [461523bf9c5715e033e9a40193969321] [Current]
Feedback Forum

Post a new message
Dataseries X:
356
355
354
352
372
371
356
346
347
347
348
350
353
351
348
351
370
370
351
335
330
328
332
334
343
334
336
343
365
364
351
326
320
312
315
316
319
311
315
322
336
339
317
295
291
283
285
289
296
283
285
289
306
306
283
258
255
248
244
249
258
252
246
249
267
284
261
235
229
218
218
229
237
231
229
233
245
256
224
194
192
178
170
187
192
182
178
186
204
224
194
173
178
168
152
163
172
170
156
155
178
194
164
135
139
135
109
121
131
135
119
121
151
169
135
105
112
105
82
81


Summary of computational transaction
Raw Inputview raw input (R code)
Raw Outputview raw output of R engine
Computing time2 seconds
R Server'George Udny Yule' @ 72.249.76.132

\begin{tabular}{lllllllll}
\hline
Summary of computational transaction \tabularnewline
Raw Input & view raw input (R code)  \tabularnewline
Raw Output & view raw output of R engine  \tabularnewline
Computing time & 2 seconds \tabularnewline
R Server & 'George Udny Yule' @ 72.249.76.132 \tabularnewline
\hline
\end{tabular}
%Source: https://freestatistics.org/blog/index.php?pk=79079&T=0

[TABLE]
[ROW][C]Summary of computational transaction[/C][/ROW]
[ROW][C]Raw Input[/C][C]view raw input (R code) [/C][/ROW]
[ROW][C]Raw Output[/C][C]view raw output of R engine [/C][/ROW]
[ROW][C]Computing time[/C][C]2 seconds[/C][/ROW]
[ROW][C]R Server[/C][C]'George Udny Yule' @ 72.249.76.132[/C][/ROW]
[/TABLE]
Source: https://freestatistics.org/blog/index.php?pk=79079&T=0

Globally Unique Identifier (entire table): ba.freestatistics.org/blog/index.php?pk=79079&T=0

As an alternative you can also use a QR Code:  

The GUIDs for individual cells are displayed in the table below:

Summary of computational transaction
Raw Inputview raw input (R code)
Raw Outputview raw output of R engine
Computing time2 seconds
R Server'George Udny Yule' @ 72.249.76.132


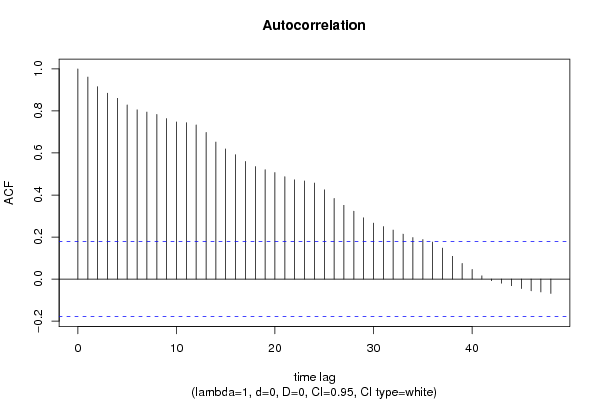
Autocorrelation Function
Time lag kACF(k)T-STATP-value
10.96132210.53080
20.91551410.0290
30.8846789.69120
40.8603169.42430
50.829019.08140
60.8056228.82510
70.7946338.70480
80.7833478.58110
90.7636788.36570
100.7478118.19190
110.7442348.15270
120.7337318.03760
130.697887.64490
140.6519647.14190
150.6194796.78610
160.5918676.48360
170.5599516.1340
180.535185.86260
190.5206935.70390
200.5066335.54990
210.4873825.3390
220.472435.17520
230.4669395.11511e-06
240.4569865.0061e-06
250.4249174.65474e-06
260.3837264.20352.5e-05
270.3508543.84349.8e-05
280.3230813.53920.000286
290.2917793.19630.00089
300.2662362.91650.002113
310.2496822.73510.003591
320.2333412.55610.005916
330.2139062.34320.010382
340.1974372.16280.01627
350.1878512.05780.020888
360.1761241.92930.028024
370.147251.6130.054681
380.1081511.18470.119232
390.0744610.81570.20815
400.0455440.49890.309378
410.0154280.1690.433039
42-0.007618-0.08350.466814
43-0.019821-0.21710.414237
44-0.031324-0.34310.366049
45-0.04544-0.49780.309777
46-0.056144-0.6150.269852
47-0.061033-0.66860.252523
48-0.068439-0.74970.227449

\begin{tabular}{lllllllll}
\hline
Autocorrelation Function \tabularnewline
Time lag k & ACF(k) & T-STAT & P-value \tabularnewline
1 & 0.961322 & 10.5308 & 0 \tabularnewline
2 & 0.915514 & 10.029 & 0 \tabularnewline
3 & 0.884678 & 9.6912 & 0 \tabularnewline
4 & 0.860316 & 9.4243 & 0 \tabularnewline
5 & 0.82901 & 9.0814 & 0 \tabularnewline
6 & 0.805622 & 8.8251 & 0 \tabularnewline
7 & 0.794633 & 8.7048 & 0 \tabularnewline
8 & 0.783347 & 8.5811 & 0 \tabularnewline
9 & 0.763678 & 8.3657 & 0 \tabularnewline
10 & 0.747811 & 8.1919 & 0 \tabularnewline
11 & 0.744234 & 8.1527 & 0 \tabularnewline
12 & 0.733731 & 8.0376 & 0 \tabularnewline
13 & 0.69788 & 7.6449 & 0 \tabularnewline
14 & 0.651964 & 7.1419 & 0 \tabularnewline
15 & 0.619479 & 6.7861 & 0 \tabularnewline
16 & 0.591867 & 6.4836 & 0 \tabularnewline
17 & 0.559951 & 6.134 & 0 \tabularnewline
18 & 0.53518 & 5.8626 & 0 \tabularnewline
19 & 0.520693 & 5.7039 & 0 \tabularnewline
20 & 0.506633 & 5.5499 & 0 \tabularnewline
21 & 0.487382 & 5.339 & 0 \tabularnewline
22 & 0.47243 & 5.1752 & 0 \tabularnewline
23 & 0.466939 & 5.1151 & 1e-06 \tabularnewline
24 & 0.456986 & 5.006 & 1e-06 \tabularnewline
25 & 0.424917 & 4.6547 & 4e-06 \tabularnewline
26 & 0.383726 & 4.2035 & 2.5e-05 \tabularnewline
27 & 0.350854 & 3.8434 & 9.8e-05 \tabularnewline
28 & 0.323081 & 3.5392 & 0.000286 \tabularnewline
29 & 0.291779 & 3.1963 & 0.00089 \tabularnewline
30 & 0.266236 & 2.9165 & 0.002113 \tabularnewline
31 & 0.249682 & 2.7351 & 0.003591 \tabularnewline
32 & 0.233341 & 2.5561 & 0.005916 \tabularnewline
33 & 0.213906 & 2.3432 & 0.010382 \tabularnewline
34 & 0.197437 & 2.1628 & 0.01627 \tabularnewline
35 & 0.187851 & 2.0578 & 0.020888 \tabularnewline
36 & 0.176124 & 1.9293 & 0.028024 \tabularnewline
37 & 0.14725 & 1.613 & 0.054681 \tabularnewline
38 & 0.108151 & 1.1847 & 0.119232 \tabularnewline
39 & 0.074461 & 0.8157 & 0.20815 \tabularnewline
40 & 0.045544 & 0.4989 & 0.309378 \tabularnewline
41 & 0.015428 & 0.169 & 0.433039 \tabularnewline
42 & -0.007618 & -0.0835 & 0.466814 \tabularnewline
43 & -0.019821 & -0.2171 & 0.414237 \tabularnewline
44 & -0.031324 & -0.3431 & 0.366049 \tabularnewline
45 & -0.04544 & -0.4978 & 0.309777 \tabularnewline
46 & -0.056144 & -0.615 & 0.269852 \tabularnewline
47 & -0.061033 & -0.6686 & 0.252523 \tabularnewline
48 & -0.068439 & -0.7497 & 0.227449 \tabularnewline
\hline
\end{tabular}
%Source: https://freestatistics.org/blog/index.php?pk=79079&T=1

[TABLE]
[ROW][C]Autocorrelation Function[/C][/ROW]
[ROW][C]Time lag k[/C][C]ACF(k)[/C][C]T-STAT[/C][C]P-value[/C][/ROW]
[ROW][C]1[/C][C]0.961322[/C][C]10.5308[/C][C]0[/C][/ROW]
[ROW][C]2[/C][C]0.915514[/C][C]10.029[/C][C]0[/C][/ROW]
[ROW][C]3[/C][C]0.884678[/C][C]9.6912[/C][C]0[/C][/ROW]
[ROW][C]4[/C][C]0.860316[/C][C]9.4243[/C][C]0[/C][/ROW]
[ROW][C]5[/C][C]0.82901[/C][C]9.0814[/C][C]0[/C][/ROW]
[ROW][C]6[/C][C]0.805622[/C][C]8.8251[/C][C]0[/C][/ROW]
[ROW][C]7[/C][C]0.794633[/C][C]8.7048[/C][C]0[/C][/ROW]
[ROW][C]8[/C][C]0.783347[/C][C]8.5811[/C][C]0[/C][/ROW]
[ROW][C]9[/C][C]0.763678[/C][C]8.3657[/C][C]0[/C][/ROW]
[ROW][C]10[/C][C]0.747811[/C][C]8.1919[/C][C]0[/C][/ROW]
[ROW][C]11[/C][C]0.744234[/C][C]8.1527[/C][C]0[/C][/ROW]
[ROW][C]12[/C][C]0.733731[/C][C]8.0376[/C][C]0[/C][/ROW]
[ROW][C]13[/C][C]0.69788[/C][C]7.6449[/C][C]0[/C][/ROW]
[ROW][C]14[/C][C]0.651964[/C][C]7.1419[/C][C]0[/C][/ROW]
[ROW][C]15[/C][C]0.619479[/C][C]6.7861[/C][C]0[/C][/ROW]
[ROW][C]16[/C][C]0.591867[/C][C]6.4836[/C][C]0[/C][/ROW]
[ROW][C]17[/C][C]0.559951[/C][C]6.134[/C][C]0[/C][/ROW]
[ROW][C]18[/C][C]0.53518[/C][C]5.8626[/C][C]0[/C][/ROW]
[ROW][C]19[/C][C]0.520693[/C][C]5.7039[/C][C]0[/C][/ROW]
[ROW][C]20[/C][C]0.506633[/C][C]5.5499[/C][C]0[/C][/ROW]
[ROW][C]21[/C][C]0.487382[/C][C]5.339[/C][C]0[/C][/ROW]
[ROW][C]22[/C][C]0.47243[/C][C]5.1752[/C][C]0[/C][/ROW]
[ROW][C]23[/C][C]0.466939[/C][C]5.1151[/C][C]1e-06[/C][/ROW]
[ROW][C]24[/C][C]0.456986[/C][C]5.006[/C][C]1e-06[/C][/ROW]
[ROW][C]25[/C][C]0.424917[/C][C]4.6547[/C][C]4e-06[/C][/ROW]
[ROW][C]26[/C][C]0.383726[/C][C]4.2035[/C][C]2.5e-05[/C][/ROW]
[ROW][C]27[/C][C]0.350854[/C][C]3.8434[/C][C]9.8e-05[/C][/ROW]
[ROW][C]28[/C][C]0.323081[/C][C]3.5392[/C][C]0.000286[/C][/ROW]
[ROW][C]29[/C][C]0.291779[/C][C]3.1963[/C][C]0.00089[/C][/ROW]
[ROW][C]30[/C][C]0.266236[/C][C]2.9165[/C][C]0.002113[/C][/ROW]
[ROW][C]31[/C][C]0.249682[/C][C]2.7351[/C][C]0.003591[/C][/ROW]
[ROW][C]32[/C][C]0.233341[/C][C]2.5561[/C][C]0.005916[/C][/ROW]
[ROW][C]33[/C][C]0.213906[/C][C]2.3432[/C][C]0.010382[/C][/ROW]
[ROW][C]34[/C][C]0.197437[/C][C]2.1628[/C][C]0.01627[/C][/ROW]
[ROW][C]35[/C][C]0.187851[/C][C]2.0578[/C][C]0.020888[/C][/ROW]
[ROW][C]36[/C][C]0.176124[/C][C]1.9293[/C][C]0.028024[/C][/ROW]
[ROW][C]37[/C][C]0.14725[/C][C]1.613[/C][C]0.054681[/C][/ROW]
[ROW][C]38[/C][C]0.108151[/C][C]1.1847[/C][C]0.119232[/C][/ROW]
[ROW][C]39[/C][C]0.074461[/C][C]0.8157[/C][C]0.20815[/C][/ROW]
[ROW][C]40[/C][C]0.045544[/C][C]0.4989[/C][C]0.309378[/C][/ROW]
[ROW][C]41[/C][C]0.015428[/C][C]0.169[/C][C]0.433039[/C][/ROW]
[ROW][C]42[/C][C]-0.007618[/C][C]-0.0835[/C][C]0.466814[/C][/ROW]
[ROW][C]43[/C][C]-0.019821[/C][C]-0.2171[/C][C]0.414237[/C][/ROW]
[ROW][C]44[/C][C]-0.031324[/C][C]-0.3431[/C][C]0.366049[/C][/ROW]
[ROW][C]45[/C][C]-0.04544[/C][C]-0.4978[/C][C]0.309777[/C][/ROW]
[ROW][C]46[/C][C]-0.056144[/C][C]-0.615[/C][C]0.269852[/C][/ROW]
[ROW][C]47[/C][C]-0.061033[/C][C]-0.6686[/C][C]0.252523[/C][/ROW]
[ROW][C]48[/C][C]-0.068439[/C][C]-0.7497[/C][C]0.227449[/C][/ROW]
[/TABLE]
Source: https://freestatistics.org/blog/index.php?pk=79079&T=1

Globally Unique Identifier (entire table): ba.freestatistics.org/blog/index.php?pk=79079&T=1

As an alternative you can also use a QR Code:  

The GUIDs for individual cells are displayed in the table below:

Autocorrelation Function
Time lag kACF(k)T-STATP-value
10.96132210.53080
20.91551410.0290
30.8846789.69120
40.8603169.42430
50.829019.08140
60.8056228.82510
70.7946338.70480
80.7833478.58110
90.7636788.36570
100.7478118.19190
110.7442348.15270
120.7337318.03760
130.697887.64490
140.6519647.14190
150.6194796.78610
160.5918676.48360
170.5599516.1340
180.535185.86260
190.5206935.70390
200.5066335.54990
210.4873825.3390
220.472435.17520
230.4669395.11511e-06
240.4569865.0061e-06
250.4249174.65474e-06
260.3837264.20352.5e-05
270.3508543.84349.8e-05
280.3230813.53920.000286
290.2917793.19630.00089
300.2662362.91650.002113
310.2496822.73510.003591
320.2333412.55610.005916
330.2139062.34320.010382
340.1974372.16280.01627
350.1878512.05780.020888
360.1761241.92930.028024
370.147251.6130.054681
380.1081511.18470.119232
390.0744610.81570.20815
400.0455440.49890.309378
410.0154280.1690.433039
42-0.007618-0.08350.466814
43-0.019821-0.21710.414237
44-0.031324-0.34310.366049
45-0.04544-0.49780.309777
46-0.056144-0.6150.269852
47-0.061033-0.66860.252523
48-0.068439-0.74970.227449


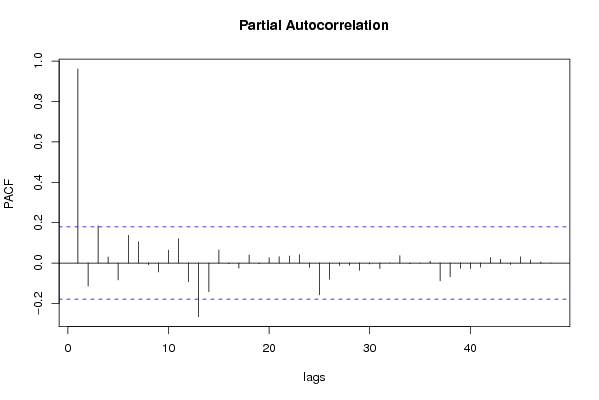
Partial Autocorrelation Function
Time lag kPACF(k)T-STATP-value
10.96132210.53080
2-0.113712-1.24570.107659
30.1844312.02030.022787
40.0301050.32980.371068
5-0.083663-0.91650.180625
60.1372221.50320.067709
70.1052331.15280.125649
8-0.007991-0.08750.465195
9-0.043749-0.47920.316319
100.0640730.70190.242055
110.1200381.3150.095516
12-0.092114-1.00910.157489
13-0.265393-2.90720.002172
14-0.141856-1.5540.061414
150.0647350.70910.239806
16-0.003006-0.03290.486894
17-0.024959-0.27340.392501
180.0397060.4350.332186
19-0.003783-0.04140.483506
200.026790.29350.384835
210.0313720.34370.365849
220.034880.38210.351533
230.0417730.45760.324032
24-0.020927-0.22920.409535
25-0.157121-1.72120.043898
26-0.079736-0.87350.192078
27-0.012361-0.13540.446257
28-0.010659-0.11680.45362
29-0.03607-0.39510.346725
30-0.004636-0.05080.479789
31-0.026379-0.2890.386552
320.0003290.00360.498567
330.0364030.39880.345383
34-0.003952-0.04330.482768
35-0.000911-0.010.496026
360.0090610.09930.46055
37-0.088042-0.96440.16838
38-0.067989-0.74480.228931
39-0.026055-0.28540.387909
40-0.027034-0.29610.383815
41-0.019846-0.21740.414132
420.0268130.29370.384739
430.0188540.20650.41836
44-0.007251-0.07940.468411
450.0307020.33630.368608
460.015710.17210.431828
470.0048980.05370.478649
480.0003030.00330.498677

\begin{tabular}{lllllllll}
\hline
Partial Autocorrelation Function \tabularnewline
Time lag k & PACF(k) & T-STAT & P-value \tabularnewline
1 & 0.961322 & 10.5308 & 0 \tabularnewline
2 & -0.113712 & -1.2457 & 0.107659 \tabularnewline
3 & 0.184431 & 2.0203 & 0.022787 \tabularnewline
4 & 0.030105 & 0.3298 & 0.371068 \tabularnewline
5 & -0.083663 & -0.9165 & 0.180625 \tabularnewline
6 & 0.137222 & 1.5032 & 0.067709 \tabularnewline
7 & 0.105233 & 1.1528 & 0.125649 \tabularnewline
8 & -0.007991 & -0.0875 & 0.465195 \tabularnewline
9 & -0.043749 & -0.4792 & 0.316319 \tabularnewline
10 & 0.064073 & 0.7019 & 0.242055 \tabularnewline
11 & 0.120038 & 1.315 & 0.095516 \tabularnewline
12 & -0.092114 & -1.0091 & 0.157489 \tabularnewline
13 & -0.265393 & -2.9072 & 0.002172 \tabularnewline
14 & -0.141856 & -1.554 & 0.061414 \tabularnewline
15 & 0.064735 & 0.7091 & 0.239806 \tabularnewline
16 & -0.003006 & -0.0329 & 0.486894 \tabularnewline
17 & -0.024959 & -0.2734 & 0.392501 \tabularnewline
18 & 0.039706 & 0.435 & 0.332186 \tabularnewline
19 & -0.003783 & -0.0414 & 0.483506 \tabularnewline
20 & 0.02679 & 0.2935 & 0.384835 \tabularnewline
21 & 0.031372 & 0.3437 & 0.365849 \tabularnewline
22 & 0.03488 & 0.3821 & 0.351533 \tabularnewline
23 & 0.041773 & 0.4576 & 0.324032 \tabularnewline
24 & -0.020927 & -0.2292 & 0.409535 \tabularnewline
25 & -0.157121 & -1.7212 & 0.043898 \tabularnewline
26 & -0.079736 & -0.8735 & 0.192078 \tabularnewline
27 & -0.012361 & -0.1354 & 0.446257 \tabularnewline
28 & -0.010659 & -0.1168 & 0.45362 \tabularnewline
29 & -0.03607 & -0.3951 & 0.346725 \tabularnewline
30 & -0.004636 & -0.0508 & 0.479789 \tabularnewline
31 & -0.026379 & -0.289 & 0.386552 \tabularnewline
32 & 0.000329 & 0.0036 & 0.498567 \tabularnewline
33 & 0.036403 & 0.3988 & 0.345383 \tabularnewline
34 & -0.003952 & -0.0433 & 0.482768 \tabularnewline
35 & -0.000911 & -0.01 & 0.496026 \tabularnewline
36 & 0.009061 & 0.0993 & 0.46055 \tabularnewline
37 & -0.088042 & -0.9644 & 0.16838 \tabularnewline
38 & -0.067989 & -0.7448 & 0.228931 \tabularnewline
39 & -0.026055 & -0.2854 & 0.387909 \tabularnewline
40 & -0.027034 & -0.2961 & 0.383815 \tabularnewline
41 & -0.019846 & -0.2174 & 0.414132 \tabularnewline
42 & 0.026813 & 0.2937 & 0.384739 \tabularnewline
43 & 0.018854 & 0.2065 & 0.41836 \tabularnewline
44 & -0.007251 & -0.0794 & 0.468411 \tabularnewline
45 & 0.030702 & 0.3363 & 0.368608 \tabularnewline
46 & 0.01571 & 0.1721 & 0.431828 \tabularnewline
47 & 0.004898 & 0.0537 & 0.478649 \tabularnewline
48 & 0.000303 & 0.0033 & 0.498677 \tabularnewline
\hline
\end{tabular}
%Source: https://freestatistics.org/blog/index.php?pk=79079&T=2

[TABLE]
[ROW][C]Partial Autocorrelation Function[/C][/ROW]
[ROW][C]Time lag k[/C][C]PACF(k)[/C][C]T-STAT[/C][C]P-value[/C][/ROW]
[ROW][C]1[/C][C]0.961322[/C][C]10.5308[/C][C]0[/C][/ROW]
[ROW][C]2[/C][C]-0.113712[/C][C]-1.2457[/C][C]0.107659[/C][/ROW]
[ROW][C]3[/C][C]0.184431[/C][C]2.0203[/C][C]0.022787[/C][/ROW]
[ROW][C]4[/C][C]0.030105[/C][C]0.3298[/C][C]0.371068[/C][/ROW]
[ROW][C]5[/C][C]-0.083663[/C][C]-0.9165[/C][C]0.180625[/C][/ROW]
[ROW][C]6[/C][C]0.137222[/C][C]1.5032[/C][C]0.067709[/C][/ROW]
[ROW][C]7[/C][C]0.105233[/C][C]1.1528[/C][C]0.125649[/C][/ROW]
[ROW][C]8[/C][C]-0.007991[/C][C]-0.0875[/C][C]0.465195[/C][/ROW]
[ROW][C]9[/C][C]-0.043749[/C][C]-0.4792[/C][C]0.316319[/C][/ROW]
[ROW][C]10[/C][C]0.064073[/C][C]0.7019[/C][C]0.242055[/C][/ROW]
[ROW][C]11[/C][C]0.120038[/C][C]1.315[/C][C]0.095516[/C][/ROW]
[ROW][C]12[/C][C]-0.092114[/C][C]-1.0091[/C][C]0.157489[/C][/ROW]
[ROW][C]13[/C][C]-0.265393[/C][C]-2.9072[/C][C]0.002172[/C][/ROW]
[ROW][C]14[/C][C]-0.141856[/C][C]-1.554[/C][C]0.061414[/C][/ROW]
[ROW][C]15[/C][C]0.064735[/C][C]0.7091[/C][C]0.239806[/C][/ROW]
[ROW][C]16[/C][C]-0.003006[/C][C]-0.0329[/C][C]0.486894[/C][/ROW]
[ROW][C]17[/C][C]-0.024959[/C][C]-0.2734[/C][C]0.392501[/C][/ROW]
[ROW][C]18[/C][C]0.039706[/C][C]0.435[/C][C]0.332186[/C][/ROW]
[ROW][C]19[/C][C]-0.003783[/C][C]-0.0414[/C][C]0.483506[/C][/ROW]
[ROW][C]20[/C][C]0.02679[/C][C]0.2935[/C][C]0.384835[/C][/ROW]
[ROW][C]21[/C][C]0.031372[/C][C]0.3437[/C][C]0.365849[/C][/ROW]
[ROW][C]22[/C][C]0.03488[/C][C]0.3821[/C][C]0.351533[/C][/ROW]
[ROW][C]23[/C][C]0.041773[/C][C]0.4576[/C][C]0.324032[/C][/ROW]
[ROW][C]24[/C][C]-0.020927[/C][C]-0.2292[/C][C]0.409535[/C][/ROW]
[ROW][C]25[/C][C]-0.157121[/C][C]-1.7212[/C][C]0.043898[/C][/ROW]
[ROW][C]26[/C][C]-0.079736[/C][C]-0.8735[/C][C]0.192078[/C][/ROW]
[ROW][C]27[/C][C]-0.012361[/C][C]-0.1354[/C][C]0.446257[/C][/ROW]
[ROW][C]28[/C][C]-0.010659[/C][C]-0.1168[/C][C]0.45362[/C][/ROW]
[ROW][C]29[/C][C]-0.03607[/C][C]-0.3951[/C][C]0.346725[/C][/ROW]
[ROW][C]30[/C][C]-0.004636[/C][C]-0.0508[/C][C]0.479789[/C][/ROW]
[ROW][C]31[/C][C]-0.026379[/C][C]-0.289[/C][C]0.386552[/C][/ROW]
[ROW][C]32[/C][C]0.000329[/C][C]0.0036[/C][C]0.498567[/C][/ROW]
[ROW][C]33[/C][C]0.036403[/C][C]0.3988[/C][C]0.345383[/C][/ROW]
[ROW][C]34[/C][C]-0.003952[/C][C]-0.0433[/C][C]0.482768[/C][/ROW]
[ROW][C]35[/C][C]-0.000911[/C][C]-0.01[/C][C]0.496026[/C][/ROW]
[ROW][C]36[/C][C]0.009061[/C][C]0.0993[/C][C]0.46055[/C][/ROW]
[ROW][C]37[/C][C]-0.088042[/C][C]-0.9644[/C][C]0.16838[/C][/ROW]
[ROW][C]38[/C][C]-0.067989[/C][C]-0.7448[/C][C]0.228931[/C][/ROW]
[ROW][C]39[/C][C]-0.026055[/C][C]-0.2854[/C][C]0.387909[/C][/ROW]
[ROW][C]40[/C][C]-0.027034[/C][C]-0.2961[/C][C]0.383815[/C][/ROW]
[ROW][C]41[/C][C]-0.019846[/C][C]-0.2174[/C][C]0.414132[/C][/ROW]
[ROW][C]42[/C][C]0.026813[/C][C]0.2937[/C][C]0.384739[/C][/ROW]
[ROW][C]43[/C][C]0.018854[/C][C]0.2065[/C][C]0.41836[/C][/ROW]
[ROW][C]44[/C][C]-0.007251[/C][C]-0.0794[/C][C]0.468411[/C][/ROW]
[ROW][C]45[/C][C]0.030702[/C][C]0.3363[/C][C]0.368608[/C][/ROW]
[ROW][C]46[/C][C]0.01571[/C][C]0.1721[/C][C]0.431828[/C][/ROW]
[ROW][C]47[/C][C]0.004898[/C][C]0.0537[/C][C]0.478649[/C][/ROW]
[ROW][C]48[/C][C]0.000303[/C][C]0.0033[/C][C]0.498677[/C][/ROW]
[/TABLE]
Source: https://freestatistics.org/blog/index.php?pk=79079&T=2

Globally Unique Identifier (entire table): ba.freestatistics.org/blog/index.php?pk=79079&T=2

As an alternative you can also use a QR Code:  

The GUIDs for individual cells are displayed in the table below:

Partial Autocorrelation Function
Time lag kPACF(k)T-STATP-value
10.96132210.53080
2-0.113712-1.24570.107659
30.1844312.02030.022787
40.0301050.32980.371068
5-0.083663-0.91650.180625
60.1372221.50320.067709
70.1052331.15280.125649
8-0.007991-0.08750.465195
9-0.043749-0.47920.316319
100.0640730.70190.242055
110.1200381.3150.095516
12-0.092114-1.00910.157489
13-0.265393-2.90720.002172
14-0.141856-1.5540.061414
150.0647350.70910.239806
16-0.003006-0.03290.486894
17-0.024959-0.27340.392501
180.0397060.4350.332186
19-0.003783-0.04140.483506
200.026790.29350.384835
210.0313720.34370.365849
220.034880.38210.351533
230.0417730.45760.324032
24-0.020927-0.22920.409535
25-0.157121-1.72120.043898
26-0.079736-0.87350.192078
27-0.012361-0.13540.446257
28-0.010659-0.11680.45362
29-0.03607-0.39510.346725
30-0.004636-0.05080.479789
31-0.026379-0.2890.386552
320.0003290.00360.498567
330.0364030.39880.345383
34-0.003952-0.04330.482768
35-0.000911-0.010.496026
360.0090610.09930.46055
37-0.088042-0.96440.16838
38-0.067989-0.74480.228931
39-0.026055-0.28540.387909
40-0.027034-0.29610.383815
41-0.019846-0.21740.414132
420.0268130.29370.384739
430.0188540.20650.41836
44-0.007251-0.07940.468411
450.0307020.33630.368608
460.015710.17210.431828
470.0048980.05370.478649
480.0003030.00330.498677


Parameters (Session):
par1 = grey ;
Parameters (R input):
par1 = 48 ; par2 = 1 ; par3 = 0 ; par4 = 0 ; par5 = 12 ; par6 = White Noise ; par7 = 0.95 ;
R code (references can be found in the software module):
if (par1 == 'Default') {
par1 = 10*log10(length(x))
} else {
par1 <- as.numeric(par1)
}
par2 <- as.numeric(par2)
par3 <- as.numeric(par3)
par4 <- as.numeric(par4)
par5 <- as.numeric(par5)
if (par6 == 'White Noise') par6 <- 'white' else par6 <- 'ma'
par7 <- as.numeric(par7)
if (par2 == 0) {
x <- log(x)
} else {
x <- (x ^ par2 - 1) / par2
}
if (par3 > 0) x <- diff(x,lag=1,difference=par3)
if (par4 > 0) x <- diff(x,lag=par5,difference=par4)
bitmap(file='pic1.png')
racf <- acf(x, par1, main='Autocorrelation', xlab='time lag', ylab='ACF', ci.type=par6, ci=par7, sub=paste('(lambda=',par2,', d=',par3,', D=',par4,', CI=', par7, ', CI type=',par6,')',sep=''))
dev.off()
bitmap(file='pic2.png')
rpacf <- pacf(x,par1,main='Partial Autocorrelation',xlab='lags',ylab='PACF')
dev.off()
(myacf <- c(racf$acf))
(mypacf <- c(rpacf$acf))
lengthx <- length(x)
sqrtn <- sqrt(lengthx)
load(file='createtable')
a<-table.start()
a<-table.row.start(a)
a<-table.element(a,'Autocorrelation Function',4,TRUE)
a<-table.row.end(a)
a<-table.row.start(a)
a<-table.element(a,'Time lag k',header=TRUE)
a<-table.element(a,hyperlink('basics.htm','ACF(k)','click here for more information about the Autocorrelation Function'),header=TRUE)
a<-table.element(a,'T-STAT',header=TRUE)
a<-table.element(a,'P-value',header=TRUE)
a<-table.row.end(a)
for (i in 2:(par1+1)) {
a<-table.row.start(a)
a<-table.element(a,i-1,header=TRUE)
a<-table.element(a,round(myacf[i],6))
mytstat <- myacf[i]*sqrtn
a<-table.element(a,round(mytstat,4))
a<-table.element(a,round(1-pt(abs(mytstat),lengthx),6))
a<-table.row.end(a)
}
a<-table.end(a)
table.save(a,file='mytable.tab')
a<-table.start()
a<-table.row.start(a)
a<-table.element(a,'Partial Autocorrelation Function',4,TRUE)
a<-table.row.end(a)
a<-table.row.start(a)
a<-table.element(a,'Time lag k',header=TRUE)
a<-table.element(a,hyperlink('basics.htm','PACF(k)','click here for more information about the Partial Autocorrelation Function'),header=TRUE)
a<-table.element(a,'T-STAT',header=TRUE)
a<-table.element(a,'P-value',header=TRUE)
a<-table.row.end(a)
for (i in 1:par1) {
a<-table.row.start(a)
a<-table.element(a,i,header=TRUE)
a<-table.element(a,round(mypacf[i],6))
mytstat <- mypacf[i]*sqrtn
a<-table.element(a,round(mytstat,4))
a<-table.element(a,round(1-pt(abs(mytstat),lengthx),6))
a<-table.row.end(a)
}
a<-table.end(a)
table.save(a,file='mytable1.tab')