Free Statistics

of Irreproducible Research!

Author's title

Author*Unverified author*
R Software Modulerwasp_smp.wasp
Title produced by softwareStandard Deviation-Mean Plot
Date of computationTue, 17 Aug 2010 08:18:54 +0000
Cite this page as followsStatistical Computations at FreeStatistics.org, Office for Research Development and Education, URL https://freestatistics.org/blog/index.php?v=date/2010/Aug/17/t1282033116efyvbimr0sumv2f.htm/, Retrieved Sat, 27 Apr 2024 13:05:55 +0000
Statistical Computations at FreeStatistics.org, Office for Research Development and Education, URL https://freestatistics.org/blog/index.php?pk=79058, Retrieved Sat, 27 Apr 2024 13:05:55 +0000
QR Codes:

Original text written by user:
IsPrivate?No (this computation is public)
User-defined keywords
Estimated Impact149
Family? (F = Feedback message, R = changed R code, M = changed R Module, P = changed Parameters, D = changed Data)
-       [Standard Deviation-Mean Plot] [Tijdreeks B Stap ...] [2010-08-17 08:18:54] [5e78ed906b09bab42b8ec3dd93b6358a] [Current]
Feedback Forum

Post a new message
Dataseries X:
93
92
91
89
87
86
87
89
90
90
91
93
93
87
89
92
98
92
92
87
92
98
101
102
102
90
87
92
105
90
88
83
98
109
118
118
115
107
101
111
128
115
111
105
120
132
135
142
139
127
113
130
143
139
137
134
139
157
152
153
147
132
117
123
139
134
134
128
118
144
140
151
144
135
122
124
146
146
147
148
132
161
159
173


Summary of computational transaction
Raw Inputview raw input (R code)
Raw Outputview raw output of R engine
Computing time2 seconds
R Server'Sir Ronald Aylmer Fisher' @ 193.190.124.24

\begin{tabular}{lllllllll}
\hline
Summary of computational transaction \tabularnewline
Raw Input & view raw input (R code)  \tabularnewline
Raw Output & view raw output of R engine  \tabularnewline
Computing time & 2 seconds \tabularnewline
R Server & 'Sir Ronald Aylmer Fisher' @ 193.190.124.24 \tabularnewline
\hline
\end{tabular}
%Source: https://freestatistics.org/blog/index.php?pk=79058&T=0

[TABLE]
[ROW][C]Summary of computational transaction[/C][/ROW]
[ROW][C]Raw Input[/C][C]view raw input (R code) [/C][/ROW]
[ROW][C]Raw Output[/C][C]view raw output of R engine [/C][/ROW]
[ROW][C]Computing time[/C][C]2 seconds[/C][/ROW]
[ROW][C]R Server[/C][C]'Sir Ronald Aylmer Fisher' @ 193.190.124.24[/C][/ROW]
[/TABLE]
Source: https://freestatistics.org/blog/index.php?pk=79058&T=0

Globally Unique Identifier (entire table): ba.freestatistics.org/blog/index.php?pk=79058&T=0

As an alternative you can also use a QR Code:  

The GUIDs for individual cells are displayed in the table below:

Summary of computational transaction
Raw Inputview raw input (R code)
Raw Outputview raw output of R engine
Computing time2 seconds
R Server'Sir Ronald Aylmer Fisher' @ 193.190.124.24


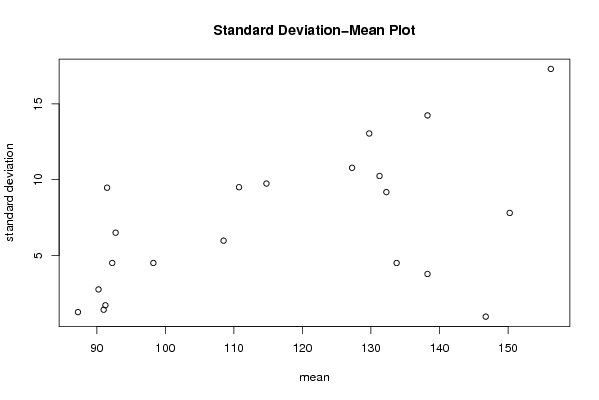
Standard Deviation-Mean Plot
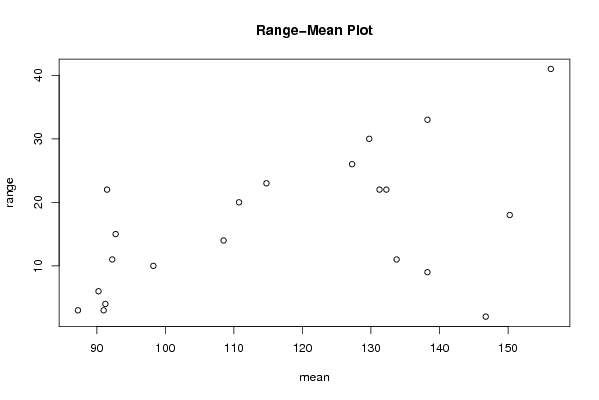
SectionMeanStandard DeviationRange
191.251.707825127659934
287.251.258305739211793
3911.414213562373103
490.252.753785273643056
592.254.511
698.254.510
792.756.515
891.59.4692484742278622
9110.759.520
10108.55.9721576223896414
11114.759.7425184971169923
12132.259.1787798753429122
13127.2510.781929326423926
14138.253.774917217635379
15150.257.804912982645418
16129.7513.047988350699930
17133.754.511
18138.2514.244882121894433
19131.2510.242883708539622
20146.750.9574271077563382
21156.2517.308475765743641

\begin{tabular}{lllllllll}
\hline
Standard Deviation-Mean Plot \tabularnewline
Section & Mean & Standard Deviation & Range \tabularnewline
1 & 91.25 & 1.70782512765993 & 4 \tabularnewline
2 & 87.25 & 1.25830573921179 & 3 \tabularnewline
3 & 91 & 1.41421356237310 & 3 \tabularnewline
4 & 90.25 & 2.75378527364305 & 6 \tabularnewline
5 & 92.25 & 4.5 & 11 \tabularnewline
6 & 98.25 & 4.5 & 10 \tabularnewline
7 & 92.75 & 6.5 & 15 \tabularnewline
8 & 91.5 & 9.46924847422786 & 22 \tabularnewline
9 & 110.75 & 9.5 & 20 \tabularnewline
10 & 108.5 & 5.97215762238964 & 14 \tabularnewline
11 & 114.75 & 9.74251849711699 & 23 \tabularnewline
12 & 132.25 & 9.17877987534291 & 22 \tabularnewline
13 & 127.25 & 10.7819293264239 & 26 \tabularnewline
14 & 138.25 & 3.77491721763537 & 9 \tabularnewline
15 & 150.25 & 7.8049129826454 & 18 \tabularnewline
16 & 129.75 & 13.0479883506999 & 30 \tabularnewline
17 & 133.75 & 4.5 & 11 \tabularnewline
18 & 138.25 & 14.2448821218944 & 33 \tabularnewline
19 & 131.25 & 10.2428837085396 & 22 \tabularnewline
20 & 146.75 & 0.957427107756338 & 2 \tabularnewline
21 & 156.25 & 17.3084757657436 & 41 \tabularnewline
\hline
\end{tabular}
%Source: https://freestatistics.org/blog/index.php?pk=79058&T=1

[TABLE]
[ROW][C]Standard Deviation-Mean Plot[/C][/ROW]
[ROW][C]Section[/C][C]Mean[/C][C]Standard Deviation[/C][C]Range[/C][/ROW]
[ROW][C]1[/C][C]91.25[/C][C]1.70782512765993[/C][C]4[/C][/ROW]
[ROW][C]2[/C][C]87.25[/C][C]1.25830573921179[/C][C]3[/C][/ROW]
[ROW][C]3[/C][C]91[/C][C]1.41421356237310[/C][C]3[/C][/ROW]
[ROW][C]4[/C][C]90.25[/C][C]2.75378527364305[/C][C]6[/C][/ROW]
[ROW][C]5[/C][C]92.25[/C][C]4.5[/C][C]11[/C][/ROW]
[ROW][C]6[/C][C]98.25[/C][C]4.5[/C][C]10[/C][/ROW]
[ROW][C]7[/C][C]92.75[/C][C]6.5[/C][C]15[/C][/ROW]
[ROW][C]8[/C][C]91.5[/C][C]9.46924847422786[/C][C]22[/C][/ROW]
[ROW][C]9[/C][C]110.75[/C][C]9.5[/C][C]20[/C][/ROW]
[ROW][C]10[/C][C]108.5[/C][C]5.97215762238964[/C][C]14[/C][/ROW]
[ROW][C]11[/C][C]114.75[/C][C]9.74251849711699[/C][C]23[/C][/ROW]
[ROW][C]12[/C][C]132.25[/C][C]9.17877987534291[/C][C]22[/C][/ROW]
[ROW][C]13[/C][C]127.25[/C][C]10.7819293264239[/C][C]26[/C][/ROW]
[ROW][C]14[/C][C]138.25[/C][C]3.77491721763537[/C][C]9[/C][/ROW]
[ROW][C]15[/C][C]150.25[/C][C]7.8049129826454[/C][C]18[/C][/ROW]
[ROW][C]16[/C][C]129.75[/C][C]13.0479883506999[/C][C]30[/C][/ROW]
[ROW][C]17[/C][C]133.75[/C][C]4.5[/C][C]11[/C][/ROW]
[ROW][C]18[/C][C]138.25[/C][C]14.2448821218944[/C][C]33[/C][/ROW]
[ROW][C]19[/C][C]131.25[/C][C]10.2428837085396[/C][C]22[/C][/ROW]
[ROW][C]20[/C][C]146.75[/C][C]0.957427107756338[/C][C]2[/C][/ROW]
[ROW][C]21[/C][C]156.25[/C][C]17.3084757657436[/C][C]41[/C][/ROW]
[/TABLE]
Source: https://freestatistics.org/blog/index.php?pk=79058&T=1

Globally Unique Identifier (entire table): ba.freestatistics.org/blog/index.php?pk=79058&T=1

As an alternative you can also use a QR Code:  

The GUIDs for individual cells are displayed in the table below:

Standard Deviation-Mean Plot
SectionMeanStandard DeviationRange
191.251.707825127659934
287.251.258305739211793
3911.414213562373103
490.252.753785273643056
592.254.511
698.254.510
792.756.515
891.59.4692484742278622
9110.759.520
10108.55.9721576223896414
11114.759.7425184971169923
12132.259.1787798753429122
13127.2510.781929326423926
14138.253.774917217635379
15150.257.804912982645418
16129.7513.047988350699930
17133.754.511
18138.2514.244882121894433
19131.2510.242883708539622
20146.750.9574271077563382
21156.2517.308475765743641


Regression: S.E.(k) = alpha + beta * Mean(k)
alpha-4.94892235533765
beta0.103195767671924
S.D.0.039010279550324
T-STAT2.64534806880325
p-value0.0159593577711054

\begin{tabular}{lllllllll}
\hline
Regression: S.E.(k) = alpha + beta * Mean(k) \tabularnewline
alpha & -4.94892235533765 \tabularnewline
beta & 0.103195767671924 \tabularnewline
S.D. & 0.039010279550324 \tabularnewline
T-STAT & 2.64534806880325 \tabularnewline
p-value & 0.0159593577711054 \tabularnewline
\hline
\end{tabular}
%Source: https://freestatistics.org/blog/index.php?pk=79058&T=2

[TABLE]
[ROW][C]Regression: S.E.(k) = alpha + beta * Mean(k)[/C][/ROW]
[ROW][C]alpha[/C][C]-4.94892235533765[/C][/ROW]
[ROW][C]beta[/C][C]0.103195767671924[/C][/ROW]
[ROW][C]S.D.[/C][C]0.039010279550324[/C][/ROW]
[ROW][C]T-STAT[/C][C]2.64534806880325[/C][/ROW]
[ROW][C]p-value[/C][C]0.0159593577711054[/C][/ROW]
[/TABLE]
Source: https://freestatistics.org/blog/index.php?pk=79058&T=2

Globally Unique Identifier (entire table): ba.freestatistics.org/blog/index.php?pk=79058&T=2

As an alternative you can also use a QR Code:  

The GUIDs for individual cells are displayed in the table below:

Regression: S.E.(k) = alpha + beta * Mean(k)
alpha-4.94892235533765
beta0.103195767671924
S.D.0.039010279550324
T-STAT2.64534806880325
p-value0.0159593577711054


Regression: ln S.E.(k) = alpha + beta * ln Mean(k)
alpha-7.06901156893613
beta1.84650081435865
S.D.0.875477095570863
T-STAT2.10913663384263
p-value0.0484293263469884
Lambda-0.846500814358652

\begin{tabular}{lllllllll}
\hline
Regression: ln S.E.(k) = alpha + beta * ln Mean(k) \tabularnewline
alpha & -7.06901156893613 \tabularnewline
beta & 1.84650081435865 \tabularnewline
S.D. & 0.875477095570863 \tabularnewline
T-STAT & 2.10913663384263 \tabularnewline
p-value & 0.0484293263469884 \tabularnewline
Lambda & -0.846500814358652 \tabularnewline
\hline
\end{tabular}
%Source: https://freestatistics.org/blog/index.php?pk=79058&T=3

[TABLE]
[ROW][C]Regression: ln S.E.(k) = alpha + beta * ln Mean(k)[/C][/ROW]
[ROW][C]alpha[/C][C]-7.06901156893613[/C][/ROW]
[ROW][C]beta[/C][C]1.84650081435865[/C][/ROW]
[ROW][C]S.D.[/C][C]0.875477095570863[/C][/ROW]
[ROW][C]T-STAT[/C][C]2.10913663384263[/C][/ROW]
[ROW][C]p-value[/C][C]0.0484293263469884[/C][/ROW]
[ROW][C]Lambda[/C][C]-0.846500814358652[/C][/ROW]
[/TABLE]
Source: https://freestatistics.org/blog/index.php?pk=79058&T=3

Globally Unique Identifier (entire table): ba.freestatistics.org/blog/index.php?pk=79058&T=3

As an alternative you can also use a QR Code:  

The GUIDs for individual cells are displayed in the table below:

Regression: ln S.E.(k) = alpha + beta * ln Mean(k)
alpha-7.06901156893613
beta1.84650081435865
S.D.0.875477095570863
T-STAT2.10913663384263
p-value0.0484293263469884
Lambda-0.846500814358652


Parameters (Session):
par1 = 4 ;
Parameters (R input):
par1 = 4 ;
R code (references can be found in the software module):
par1 <- as.numeric(par1)
(n <- length(x))
(np <- floor(n / par1))
arr <- array(NA,dim=c(par1,np))
j <- 0
k <- 1
for (i in 1:(np*par1))
{
j = j + 1
arr[j,k] <- x[i]
if (j == par1) {
j = 0
k=k+1
}
}
arr
arr.mean <- array(NA,dim=np)
arr.sd <- array(NA,dim=np)
arr.range <- array(NA,dim=np)
for (j in 1:np)
{
arr.mean[j] <- mean(arr[,j],na.rm=TRUE)
arr.sd[j] <- sd(arr[,j],na.rm=TRUE)
arr.range[j] <- max(arr[,j],na.rm=TRUE) - min(arr[,j],na.rm=TRUE)
}
arr.mean
arr.sd
arr.range
(lm1 <- lm(arr.sd~arr.mean))
(lnlm1 <- lm(log(arr.sd)~log(arr.mean)))
(lm2 <- lm(arr.range~arr.mean))
bitmap(file='test1.png')
plot(arr.mean,arr.sd,main='Standard Deviation-Mean Plot',xlab='mean',ylab='standard deviation')
dev.off()
bitmap(file='test2.png')
plot(arr.mean,arr.range,main='Range-Mean Plot',xlab='mean',ylab='range')
dev.off()
load(file='createtable')
a<-table.start()
a<-table.row.start(a)
a<-table.element(a,'Standard Deviation-Mean Plot',4,TRUE)
a<-table.row.end(a)
a<-table.row.start(a)
a<-table.element(a,'Section',header=TRUE)
a<-table.element(a,'Mean',header=TRUE)
a<-table.element(a,'Standard Deviation',header=TRUE)
a<-table.element(a,'Range',header=TRUE)
a<-table.row.end(a)
for (j in 1:np) {
a<-table.row.start(a)
a<-table.element(a,j,header=TRUE)
a<-table.element(a,arr.mean[j])
a<-table.element(a,arr.sd[j] )
a<-table.element(a,arr.range[j] )
a<-table.row.end(a)
}
a<-table.end(a)
table.save(a,file='mytable.tab')
a<-table.start()
a<-table.row.start(a)
a<-table.element(a,'Regression: S.E.(k) = alpha + beta * Mean(k)',2,TRUE)
a<-table.row.end(a)
a<-table.row.start(a)
a<-table.element(a,'alpha',header=TRUE)
a<-table.element(a,lm1$coefficients[[1]])
a<-table.row.end(a)
a<-table.row.start(a)
a<-table.element(a,'beta',header=TRUE)
a<-table.element(a,lm1$coefficients[[2]])
a<-table.row.end(a)
a<-table.row.start(a)
a<-table.element(a,'S.D.',header=TRUE)
a<-table.element(a,summary(lm1)$coefficients[2,2])
a<-table.row.end(a)
a<-table.row.start(a)
a<-table.element(a,'T-STAT',header=TRUE)
a<-table.element(a,summary(lm1)$coefficients[2,3])
a<-table.row.end(a)
a<-table.row.start(a)
a<-table.element(a,'p-value',header=TRUE)
a<-table.element(a,summary(lm1)$coefficients[2,4])
a<-table.row.end(a)
a<-table.end(a)
table.save(a,file='mytable1.tab')
a<-table.start()
a<-table.row.start(a)
a<-table.element(a,'Regression: ln S.E.(k) = alpha + beta * ln Mean(k)',2,TRUE)
a<-table.row.end(a)
a<-table.row.start(a)
a<-table.element(a,'alpha',header=TRUE)
a<-table.element(a,lnlm1$coefficients[[1]])
a<-table.row.end(a)
a<-table.row.start(a)
a<-table.element(a,'beta',header=TRUE)
a<-table.element(a,lnlm1$coefficients[[2]])
a<-table.row.end(a)
a<-table.row.start(a)
a<-table.element(a,'S.D.',header=TRUE)
a<-table.element(a,summary(lnlm1)$coefficients[2,2])
a<-table.row.end(a)
a<-table.row.start(a)
a<-table.element(a,'T-STAT',header=TRUE)
a<-table.element(a,summary(lnlm1)$coefficients[2,3])
a<-table.row.end(a)
a<-table.row.start(a)
a<-table.element(a,'p-value',header=TRUE)
a<-table.element(a,summary(lnlm1)$coefficients[2,4])
a<-table.row.end(a)
a<-table.row.start(a)
a<-table.element(a,'Lambda',header=TRUE)
a<-table.element(a,1-lnlm1$coefficients[[2]])
a<-table.row.end(a)
a<-table.end(a)
table.save(a,file='mytable2.tab')