Free Statistics

of Irreproducible Research!

Author's title

Author*Unverified author*
R Software Modulerwasp_autocorrelation.wasp
Title produced by software(Partial) Autocorrelation Function
Date of computationSun, 15 Aug 2010 20:36:24 +0000
Cite this page as followsStatistical Computations at FreeStatistics.org, Office for Research Development and Education, URL https://freestatistics.org/blog/index.php?v=date/2010/Aug/15/t1281904549id2726x94qw8na4.htm/, Retrieved Sun, 28 Apr 2024 08:59:59 +0000
Statistical Computations at FreeStatistics.org, Office for Research Development and Education, URL https://freestatistics.org/blog/index.php?pk=78917, Retrieved Sun, 28 Apr 2024 08:59:59 +0000
QR Codes:

Original text written by user:
IsPrivate?No (this computation is public)
User-defined keywords
Estimated Impact113
Family? (F = Feedback message, R = changed R code, M = changed R Module, P = changed Parameters, D = changed Data)
-       [(Partial) Autocorrelation Function] [gedifferentieerde...] [2010-08-15 20:36:24] [d41d8cd98f00b204e9800998ecf8427e] [Current]
Feedback Forum

Post a new message
Dataseries X:
244
243
242
240
260
259
244
234
235
235
236
238
240
233
233
233
247
251
233
226
233
233
227
225
223
212
206
202
223
221
212
205
204
200
195
193
196
180
174
164
192
189
181
167
166
164
167
164
161
141
134
111
147
144
142
140
143
137
140
130
129
112
101
74
104
103
100
98
99
91
92
94
93
76
64
32
62
69
69
68
68
59
66
73
70
57
48
22
64
74
67
61
61
52
54
69
69
53
50
22
69
78
74
63
67
59
60
80
77
58
54
32
78
86
84
78
72
64
62
72


Summary of computational transaction
Raw Inputview raw input (R code)
Raw Outputview raw output of R engine
Computing time2 seconds
R Server'Sir Ronald Aylmer Fisher' @ 193.190.124.24

\begin{tabular}{lllllllll}
\hline
Summary of computational transaction \tabularnewline
Raw Input & view raw input (R code)  \tabularnewline
Raw Output & view raw output of R engine  \tabularnewline
Computing time & 2 seconds \tabularnewline
R Server & 'Sir Ronald Aylmer Fisher' @ 193.190.124.24 \tabularnewline
\hline
\end{tabular}
%Source: https://freestatistics.org/blog/index.php?pk=78917&T=0

[TABLE]
[ROW][C]Summary of computational transaction[/C][/ROW]
[ROW][C]Raw Input[/C][C]view raw input (R code) [/C][/ROW]
[ROW][C]Raw Output[/C][C]view raw output of R engine [/C][/ROW]
[ROW][C]Computing time[/C][C]2 seconds[/C][/ROW]
[ROW][C]R Server[/C][C]'Sir Ronald Aylmer Fisher' @ 193.190.124.24[/C][/ROW]
[/TABLE]
Source: https://freestatistics.org/blog/index.php?pk=78917&T=0

Globally Unique Identifier (entire table): ba.freestatistics.org/blog/index.php?pk=78917&T=0

As an alternative you can also use a QR Code:  

The GUIDs for individual cells are displayed in the table below:

Summary of computational transaction
Raw Inputview raw input (R code)
Raw Outputview raw output of R engine
Computing time2 seconds
R Server'Sir Ronald Aylmer Fisher' @ 193.190.124.24


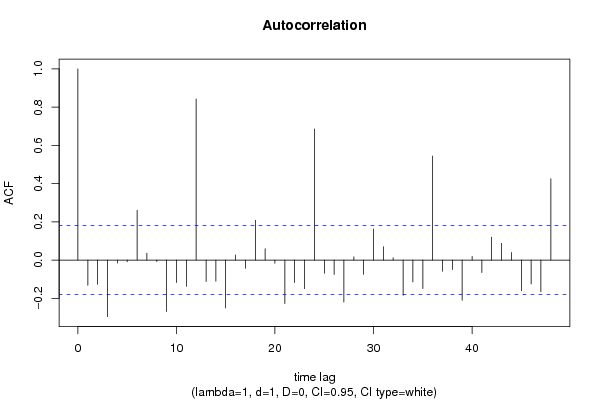
Autocorrelation Function
Time lag kACF(k)T-STATP-value
1-0.131826-1.4380.076523
2-0.12679-1.38310.084609
3-0.296051-3.22950.000802
4-0.015658-0.17080.43233
5-0.009259-0.1010.459857
60.2613142.85060.002573
70.0354430.38660.349857
8-0.007873-0.08590.465853
9-0.269196-2.93660.001992
10-0.117299-1.27960.101591
11-0.136706-1.49130.069266
120.8424889.19050
13-0.112609-1.22840.110857
14-0.110454-1.20490.115313
15-0.250423-2.73180.003629
160.02690.29340.384847
17-0.042952-0.46860.320124
180.2088192.27790.012257
190.0596350.65050.258298
20-0.017002-0.18550.42659
21-0.227301-2.47960.007277
22-0.117076-1.27710.102019
23-0.149494-1.63080.05279
240.6859397.48270
25-0.069171-0.75460.226001
26-0.074967-0.81780.207555
27-0.219284-2.39210.009159
280.017030.18580.426469
29-0.074316-0.81070.20958
300.1632061.78040.038784
310.0694950.75810.224945
320.0121360.13240.44745
33-0.184094-2.00820.023442
34-0.114281-1.24670.107485
35-0.149322-1.62890.052988
360.5439465.93370
37-0.058957-0.64310.260684
38-0.049315-0.5380.295805
39-0.210613-2.29750.011668
400.0183970.20070.420642
41-0.064929-0.70830.240074
420.1197251.30610.097027
430.0875490.9550.170745
440.0400160.43650.331623
45-0.159921-1.74450.041824
46-0.125614-1.37030.086589
47-0.165904-1.80980.036425
480.4257014.64384e-06

\begin{tabular}{lllllllll}
\hline
Autocorrelation Function \tabularnewline
Time lag k & ACF(k) & T-STAT & P-value \tabularnewline
1 & -0.131826 & -1.438 & 0.076523 \tabularnewline
2 & -0.12679 & -1.3831 & 0.084609 \tabularnewline
3 & -0.296051 & -3.2295 & 0.000802 \tabularnewline
4 & -0.015658 & -0.1708 & 0.43233 \tabularnewline
5 & -0.009259 & -0.101 & 0.459857 \tabularnewline
6 & 0.261314 & 2.8506 & 0.002573 \tabularnewline
7 & 0.035443 & 0.3866 & 0.349857 \tabularnewline
8 & -0.007873 & -0.0859 & 0.465853 \tabularnewline
9 & -0.269196 & -2.9366 & 0.001992 \tabularnewline
10 & -0.117299 & -1.2796 & 0.101591 \tabularnewline
11 & -0.136706 & -1.4913 & 0.069266 \tabularnewline
12 & 0.842488 & 9.1905 & 0 \tabularnewline
13 & -0.112609 & -1.2284 & 0.110857 \tabularnewline
14 & -0.110454 & -1.2049 & 0.115313 \tabularnewline
15 & -0.250423 & -2.7318 & 0.003629 \tabularnewline
16 & 0.0269 & 0.2934 & 0.384847 \tabularnewline
17 & -0.042952 & -0.4686 & 0.320124 \tabularnewline
18 & 0.208819 & 2.2779 & 0.012257 \tabularnewline
19 & 0.059635 & 0.6505 & 0.258298 \tabularnewline
20 & -0.017002 & -0.1855 & 0.42659 \tabularnewline
21 & -0.227301 & -2.4796 & 0.007277 \tabularnewline
22 & -0.117076 & -1.2771 & 0.102019 \tabularnewline
23 & -0.149494 & -1.6308 & 0.05279 \tabularnewline
24 & 0.685939 & 7.4827 & 0 \tabularnewline
25 & -0.069171 & -0.7546 & 0.226001 \tabularnewline
26 & -0.074967 & -0.8178 & 0.207555 \tabularnewline
27 & -0.219284 & -2.3921 & 0.009159 \tabularnewline
28 & 0.01703 & 0.1858 & 0.426469 \tabularnewline
29 & -0.074316 & -0.8107 & 0.20958 \tabularnewline
30 & 0.163206 & 1.7804 & 0.038784 \tabularnewline
31 & 0.069495 & 0.7581 & 0.224945 \tabularnewline
32 & 0.012136 & 0.1324 & 0.44745 \tabularnewline
33 & -0.184094 & -2.0082 & 0.023442 \tabularnewline
34 & -0.114281 & -1.2467 & 0.107485 \tabularnewline
35 & -0.149322 & -1.6289 & 0.052988 \tabularnewline
36 & 0.543946 & 5.9337 & 0 \tabularnewline
37 & -0.058957 & -0.6431 & 0.260684 \tabularnewline
38 & -0.049315 & -0.538 & 0.295805 \tabularnewline
39 & -0.210613 & -2.2975 & 0.011668 \tabularnewline
40 & 0.018397 & 0.2007 & 0.420642 \tabularnewline
41 & -0.064929 & -0.7083 & 0.240074 \tabularnewline
42 & 0.119725 & 1.3061 & 0.097027 \tabularnewline
43 & 0.087549 & 0.955 & 0.170745 \tabularnewline
44 & 0.040016 & 0.4365 & 0.331623 \tabularnewline
45 & -0.159921 & -1.7445 & 0.041824 \tabularnewline
46 & -0.125614 & -1.3703 & 0.086589 \tabularnewline
47 & -0.165904 & -1.8098 & 0.036425 \tabularnewline
48 & 0.425701 & 4.6438 & 4e-06 \tabularnewline
\hline
\end{tabular}
%Source: https://freestatistics.org/blog/index.php?pk=78917&T=1

[TABLE]
[ROW][C]Autocorrelation Function[/C][/ROW]
[ROW][C]Time lag k[/C][C]ACF(k)[/C][C]T-STAT[/C][C]P-value[/C][/ROW]
[ROW][C]1[/C][C]-0.131826[/C][C]-1.438[/C][C]0.076523[/C][/ROW]
[ROW][C]2[/C][C]-0.12679[/C][C]-1.3831[/C][C]0.084609[/C][/ROW]
[ROW][C]3[/C][C]-0.296051[/C][C]-3.2295[/C][C]0.000802[/C][/ROW]
[ROW][C]4[/C][C]-0.015658[/C][C]-0.1708[/C][C]0.43233[/C][/ROW]
[ROW][C]5[/C][C]-0.009259[/C][C]-0.101[/C][C]0.459857[/C][/ROW]
[ROW][C]6[/C][C]0.261314[/C][C]2.8506[/C][C]0.002573[/C][/ROW]
[ROW][C]7[/C][C]0.035443[/C][C]0.3866[/C][C]0.349857[/C][/ROW]
[ROW][C]8[/C][C]-0.007873[/C][C]-0.0859[/C][C]0.465853[/C][/ROW]
[ROW][C]9[/C][C]-0.269196[/C][C]-2.9366[/C][C]0.001992[/C][/ROW]
[ROW][C]10[/C][C]-0.117299[/C][C]-1.2796[/C][C]0.101591[/C][/ROW]
[ROW][C]11[/C][C]-0.136706[/C][C]-1.4913[/C][C]0.069266[/C][/ROW]
[ROW][C]12[/C][C]0.842488[/C][C]9.1905[/C][C]0[/C][/ROW]
[ROW][C]13[/C][C]-0.112609[/C][C]-1.2284[/C][C]0.110857[/C][/ROW]
[ROW][C]14[/C][C]-0.110454[/C][C]-1.2049[/C][C]0.115313[/C][/ROW]
[ROW][C]15[/C][C]-0.250423[/C][C]-2.7318[/C][C]0.003629[/C][/ROW]
[ROW][C]16[/C][C]0.0269[/C][C]0.2934[/C][C]0.384847[/C][/ROW]
[ROW][C]17[/C][C]-0.042952[/C][C]-0.4686[/C][C]0.320124[/C][/ROW]
[ROW][C]18[/C][C]0.208819[/C][C]2.2779[/C][C]0.012257[/C][/ROW]
[ROW][C]19[/C][C]0.059635[/C][C]0.6505[/C][C]0.258298[/C][/ROW]
[ROW][C]20[/C][C]-0.017002[/C][C]-0.1855[/C][C]0.42659[/C][/ROW]
[ROW][C]21[/C][C]-0.227301[/C][C]-2.4796[/C][C]0.007277[/C][/ROW]
[ROW][C]22[/C][C]-0.117076[/C][C]-1.2771[/C][C]0.102019[/C][/ROW]
[ROW][C]23[/C][C]-0.149494[/C][C]-1.6308[/C][C]0.05279[/C][/ROW]
[ROW][C]24[/C][C]0.685939[/C][C]7.4827[/C][C]0[/C][/ROW]
[ROW][C]25[/C][C]-0.069171[/C][C]-0.7546[/C][C]0.226001[/C][/ROW]
[ROW][C]26[/C][C]-0.074967[/C][C]-0.8178[/C][C]0.207555[/C][/ROW]
[ROW][C]27[/C][C]-0.219284[/C][C]-2.3921[/C][C]0.009159[/C][/ROW]
[ROW][C]28[/C][C]0.01703[/C][C]0.1858[/C][C]0.426469[/C][/ROW]
[ROW][C]29[/C][C]-0.074316[/C][C]-0.8107[/C][C]0.20958[/C][/ROW]
[ROW][C]30[/C][C]0.163206[/C][C]1.7804[/C][C]0.038784[/C][/ROW]
[ROW][C]31[/C][C]0.069495[/C][C]0.7581[/C][C]0.224945[/C][/ROW]
[ROW][C]32[/C][C]0.012136[/C][C]0.1324[/C][C]0.44745[/C][/ROW]
[ROW][C]33[/C][C]-0.184094[/C][C]-2.0082[/C][C]0.023442[/C][/ROW]
[ROW][C]34[/C][C]-0.114281[/C][C]-1.2467[/C][C]0.107485[/C][/ROW]
[ROW][C]35[/C][C]-0.149322[/C][C]-1.6289[/C][C]0.052988[/C][/ROW]
[ROW][C]36[/C][C]0.543946[/C][C]5.9337[/C][C]0[/C][/ROW]
[ROW][C]37[/C][C]-0.058957[/C][C]-0.6431[/C][C]0.260684[/C][/ROW]
[ROW][C]38[/C][C]-0.049315[/C][C]-0.538[/C][C]0.295805[/C][/ROW]
[ROW][C]39[/C][C]-0.210613[/C][C]-2.2975[/C][C]0.011668[/C][/ROW]
[ROW][C]40[/C][C]0.018397[/C][C]0.2007[/C][C]0.420642[/C][/ROW]
[ROW][C]41[/C][C]-0.064929[/C][C]-0.7083[/C][C]0.240074[/C][/ROW]
[ROW][C]42[/C][C]0.119725[/C][C]1.3061[/C][C]0.097027[/C][/ROW]
[ROW][C]43[/C][C]0.087549[/C][C]0.955[/C][C]0.170745[/C][/ROW]
[ROW][C]44[/C][C]0.040016[/C][C]0.4365[/C][C]0.331623[/C][/ROW]
[ROW][C]45[/C][C]-0.159921[/C][C]-1.7445[/C][C]0.041824[/C][/ROW]
[ROW][C]46[/C][C]-0.125614[/C][C]-1.3703[/C][C]0.086589[/C][/ROW]
[ROW][C]47[/C][C]-0.165904[/C][C]-1.8098[/C][C]0.036425[/C][/ROW]
[ROW][C]48[/C][C]0.425701[/C][C]4.6438[/C][C]4e-06[/C][/ROW]
[/TABLE]
Source: https://freestatistics.org/blog/index.php?pk=78917&T=1

Globally Unique Identifier (entire table): ba.freestatistics.org/blog/index.php?pk=78917&T=1

As an alternative you can also use a QR Code:  

The GUIDs for individual cells are displayed in the table below:

Autocorrelation Function
Time lag kACF(k)T-STATP-value
1-0.131826-1.4380.076523
2-0.12679-1.38310.084609
3-0.296051-3.22950.000802
4-0.015658-0.17080.43233
5-0.009259-0.1010.459857
60.2613142.85060.002573
70.0354430.38660.349857
8-0.007873-0.08590.465853
9-0.269196-2.93660.001992
10-0.117299-1.27960.101591
11-0.136706-1.49130.069266
120.8424889.19050
13-0.112609-1.22840.110857
14-0.110454-1.20490.115313
15-0.250423-2.73180.003629
160.02690.29340.384847
17-0.042952-0.46860.320124
180.2088192.27790.012257
190.0596350.65050.258298
20-0.017002-0.18550.42659
21-0.227301-2.47960.007277
22-0.117076-1.27710.102019
23-0.149494-1.63080.05279
240.6859397.48270
25-0.069171-0.75460.226001
26-0.074967-0.81780.207555
27-0.219284-2.39210.009159
280.017030.18580.426469
29-0.074316-0.81070.20958
300.1632061.78040.038784
310.0694950.75810.224945
320.0121360.13240.44745
33-0.184094-2.00820.023442
34-0.114281-1.24670.107485
35-0.149322-1.62890.052988
360.5439465.93370
37-0.058957-0.64310.260684
38-0.049315-0.5380.295805
39-0.210613-2.29750.011668
400.0183970.20070.420642
41-0.064929-0.70830.240074
420.1197251.30610.097027
430.0875490.9550.170745
440.0400160.43650.331623
45-0.159921-1.74450.041824
46-0.125614-1.37030.086589
47-0.165904-1.80980.036425
480.4257014.64384e-06


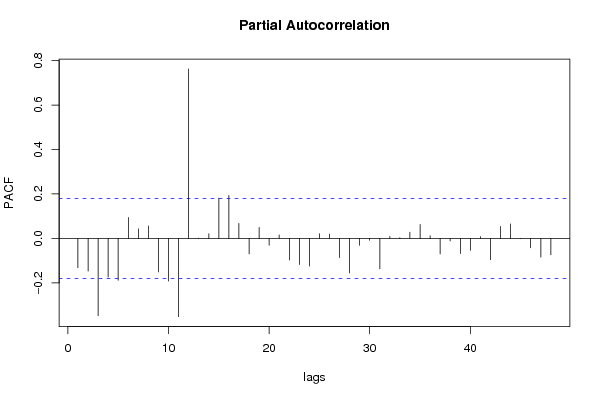
Partial Autocorrelation Function
Time lag kPACF(k)T-STATP-value
1-0.131826-1.4380.076523
2-0.146718-1.60050.056069
3-0.347966-3.79590.000116
4-0.173561-1.89330.030372
5-0.187982-2.05060.021249
60.0941.02540.153622
70.0432220.47150.319077
80.0560350.61130.271095
9-0.150436-1.64110.051712
10-0.191757-2.09180.01929
11-0.351907-3.83891e-04
120.7626548.31960
130.0008550.00930.496289
140.0212310.23160.408624
150.1805711.96980.025593
160.1930422.10580.01866
170.0677810.73940.230558
18-0.069616-0.75940.224552
190.0495280.54030.295005
20-0.03108-0.3390.367588
210.0152170.1660.43422
22-0.097038-1.05860.145973
23-0.117181-1.27830.101816
24-0.124325-1.35620.088798
250.0210230.22930.4095
260.0195450.21320.415766
27-0.085599-0.93380.176156
28-0.154952-1.69030.046791
29-0.030835-0.33640.368594
30-0.008575-0.09350.462815
31-0.136845-1.49280.069068
320.0085250.0930.463033
330.0030870.03370.486596
340.0278310.30360.380981
350.0629040.68620.246959
360.0123210.13440.446654
37-0.069487-0.7580.22497
38-0.011007-0.12010.452313
39-0.068003-0.74180.229828
40-0.053664-0.58540.279691
410.0082350.08980.464284
42-0.096057-1.04790.148414
430.0540490.58960.278287
440.0649210.70820.240103
45-0.000724-0.00790.496857
46-0.041863-0.45670.324371
47-0.084089-0.91730.180419
48-0.073864-0.80580.210994

\begin{tabular}{lllllllll}
\hline
Partial Autocorrelation Function \tabularnewline
Time lag k & PACF(k) & T-STAT & P-value \tabularnewline
1 & -0.131826 & -1.438 & 0.076523 \tabularnewline
2 & -0.146718 & -1.6005 & 0.056069 \tabularnewline
3 & -0.347966 & -3.7959 & 0.000116 \tabularnewline
4 & -0.173561 & -1.8933 & 0.030372 \tabularnewline
5 & -0.187982 & -2.0506 & 0.021249 \tabularnewline
6 & 0.094 & 1.0254 & 0.153622 \tabularnewline
7 & 0.043222 & 0.4715 & 0.319077 \tabularnewline
8 & 0.056035 & 0.6113 & 0.271095 \tabularnewline
9 & -0.150436 & -1.6411 & 0.051712 \tabularnewline
10 & -0.191757 & -2.0918 & 0.01929 \tabularnewline
11 & -0.351907 & -3.8389 & 1e-04 \tabularnewline
12 & 0.762654 & 8.3196 & 0 \tabularnewline
13 & 0.000855 & 0.0093 & 0.496289 \tabularnewline
14 & 0.021231 & 0.2316 & 0.408624 \tabularnewline
15 & 0.180571 & 1.9698 & 0.025593 \tabularnewline
16 & 0.193042 & 2.1058 & 0.01866 \tabularnewline
17 & 0.067781 & 0.7394 & 0.230558 \tabularnewline
18 & -0.069616 & -0.7594 & 0.224552 \tabularnewline
19 & 0.049528 & 0.5403 & 0.295005 \tabularnewline
20 & -0.03108 & -0.339 & 0.367588 \tabularnewline
21 & 0.015217 & 0.166 & 0.43422 \tabularnewline
22 & -0.097038 & -1.0586 & 0.145973 \tabularnewline
23 & -0.117181 & -1.2783 & 0.101816 \tabularnewline
24 & -0.124325 & -1.3562 & 0.088798 \tabularnewline
25 & 0.021023 & 0.2293 & 0.4095 \tabularnewline
26 & 0.019545 & 0.2132 & 0.415766 \tabularnewline
27 & -0.085599 & -0.9338 & 0.176156 \tabularnewline
28 & -0.154952 & -1.6903 & 0.046791 \tabularnewline
29 & -0.030835 & -0.3364 & 0.368594 \tabularnewline
30 & -0.008575 & -0.0935 & 0.462815 \tabularnewline
31 & -0.136845 & -1.4928 & 0.069068 \tabularnewline
32 & 0.008525 & 0.093 & 0.463033 \tabularnewline
33 & 0.003087 & 0.0337 & 0.486596 \tabularnewline
34 & 0.027831 & 0.3036 & 0.380981 \tabularnewline
35 & 0.062904 & 0.6862 & 0.246959 \tabularnewline
36 & 0.012321 & 0.1344 & 0.446654 \tabularnewline
37 & -0.069487 & -0.758 & 0.22497 \tabularnewline
38 & -0.011007 & -0.1201 & 0.452313 \tabularnewline
39 & -0.068003 & -0.7418 & 0.229828 \tabularnewline
40 & -0.053664 & -0.5854 & 0.279691 \tabularnewline
41 & 0.008235 & 0.0898 & 0.464284 \tabularnewline
42 & -0.096057 & -1.0479 & 0.148414 \tabularnewline
43 & 0.054049 & 0.5896 & 0.278287 \tabularnewline
44 & 0.064921 & 0.7082 & 0.240103 \tabularnewline
45 & -0.000724 & -0.0079 & 0.496857 \tabularnewline
46 & -0.041863 & -0.4567 & 0.324371 \tabularnewline
47 & -0.084089 & -0.9173 & 0.180419 \tabularnewline
48 & -0.073864 & -0.8058 & 0.210994 \tabularnewline
\hline
\end{tabular}
%Source: https://freestatistics.org/blog/index.php?pk=78917&T=2

[TABLE]
[ROW][C]Partial Autocorrelation Function[/C][/ROW]
[ROW][C]Time lag k[/C][C]PACF(k)[/C][C]T-STAT[/C][C]P-value[/C][/ROW]
[ROW][C]1[/C][C]-0.131826[/C][C]-1.438[/C][C]0.076523[/C][/ROW]
[ROW][C]2[/C][C]-0.146718[/C][C]-1.6005[/C][C]0.056069[/C][/ROW]
[ROW][C]3[/C][C]-0.347966[/C][C]-3.7959[/C][C]0.000116[/C][/ROW]
[ROW][C]4[/C][C]-0.173561[/C][C]-1.8933[/C][C]0.030372[/C][/ROW]
[ROW][C]5[/C][C]-0.187982[/C][C]-2.0506[/C][C]0.021249[/C][/ROW]
[ROW][C]6[/C][C]0.094[/C][C]1.0254[/C][C]0.153622[/C][/ROW]
[ROW][C]7[/C][C]0.043222[/C][C]0.4715[/C][C]0.319077[/C][/ROW]
[ROW][C]8[/C][C]0.056035[/C][C]0.6113[/C][C]0.271095[/C][/ROW]
[ROW][C]9[/C][C]-0.150436[/C][C]-1.6411[/C][C]0.051712[/C][/ROW]
[ROW][C]10[/C][C]-0.191757[/C][C]-2.0918[/C][C]0.01929[/C][/ROW]
[ROW][C]11[/C][C]-0.351907[/C][C]-3.8389[/C][C]1e-04[/C][/ROW]
[ROW][C]12[/C][C]0.762654[/C][C]8.3196[/C][C]0[/C][/ROW]
[ROW][C]13[/C][C]0.000855[/C][C]0.0093[/C][C]0.496289[/C][/ROW]
[ROW][C]14[/C][C]0.021231[/C][C]0.2316[/C][C]0.408624[/C][/ROW]
[ROW][C]15[/C][C]0.180571[/C][C]1.9698[/C][C]0.025593[/C][/ROW]
[ROW][C]16[/C][C]0.193042[/C][C]2.1058[/C][C]0.01866[/C][/ROW]
[ROW][C]17[/C][C]0.067781[/C][C]0.7394[/C][C]0.230558[/C][/ROW]
[ROW][C]18[/C][C]-0.069616[/C][C]-0.7594[/C][C]0.224552[/C][/ROW]
[ROW][C]19[/C][C]0.049528[/C][C]0.5403[/C][C]0.295005[/C][/ROW]
[ROW][C]20[/C][C]-0.03108[/C][C]-0.339[/C][C]0.367588[/C][/ROW]
[ROW][C]21[/C][C]0.015217[/C][C]0.166[/C][C]0.43422[/C][/ROW]
[ROW][C]22[/C][C]-0.097038[/C][C]-1.0586[/C][C]0.145973[/C][/ROW]
[ROW][C]23[/C][C]-0.117181[/C][C]-1.2783[/C][C]0.101816[/C][/ROW]
[ROW][C]24[/C][C]-0.124325[/C][C]-1.3562[/C][C]0.088798[/C][/ROW]
[ROW][C]25[/C][C]0.021023[/C][C]0.2293[/C][C]0.4095[/C][/ROW]
[ROW][C]26[/C][C]0.019545[/C][C]0.2132[/C][C]0.415766[/C][/ROW]
[ROW][C]27[/C][C]-0.085599[/C][C]-0.9338[/C][C]0.176156[/C][/ROW]
[ROW][C]28[/C][C]-0.154952[/C][C]-1.6903[/C][C]0.046791[/C][/ROW]
[ROW][C]29[/C][C]-0.030835[/C][C]-0.3364[/C][C]0.368594[/C][/ROW]
[ROW][C]30[/C][C]-0.008575[/C][C]-0.0935[/C][C]0.462815[/C][/ROW]
[ROW][C]31[/C][C]-0.136845[/C][C]-1.4928[/C][C]0.069068[/C][/ROW]
[ROW][C]32[/C][C]0.008525[/C][C]0.093[/C][C]0.463033[/C][/ROW]
[ROW][C]33[/C][C]0.003087[/C][C]0.0337[/C][C]0.486596[/C][/ROW]
[ROW][C]34[/C][C]0.027831[/C][C]0.3036[/C][C]0.380981[/C][/ROW]
[ROW][C]35[/C][C]0.062904[/C][C]0.6862[/C][C]0.246959[/C][/ROW]
[ROW][C]36[/C][C]0.012321[/C][C]0.1344[/C][C]0.446654[/C][/ROW]
[ROW][C]37[/C][C]-0.069487[/C][C]-0.758[/C][C]0.22497[/C][/ROW]
[ROW][C]38[/C][C]-0.011007[/C][C]-0.1201[/C][C]0.452313[/C][/ROW]
[ROW][C]39[/C][C]-0.068003[/C][C]-0.7418[/C][C]0.229828[/C][/ROW]
[ROW][C]40[/C][C]-0.053664[/C][C]-0.5854[/C][C]0.279691[/C][/ROW]
[ROW][C]41[/C][C]0.008235[/C][C]0.0898[/C][C]0.464284[/C][/ROW]
[ROW][C]42[/C][C]-0.096057[/C][C]-1.0479[/C][C]0.148414[/C][/ROW]
[ROW][C]43[/C][C]0.054049[/C][C]0.5896[/C][C]0.278287[/C][/ROW]
[ROW][C]44[/C][C]0.064921[/C][C]0.7082[/C][C]0.240103[/C][/ROW]
[ROW][C]45[/C][C]-0.000724[/C][C]-0.0079[/C][C]0.496857[/C][/ROW]
[ROW][C]46[/C][C]-0.041863[/C][C]-0.4567[/C][C]0.324371[/C][/ROW]
[ROW][C]47[/C][C]-0.084089[/C][C]-0.9173[/C][C]0.180419[/C][/ROW]
[ROW][C]48[/C][C]-0.073864[/C][C]-0.8058[/C][C]0.210994[/C][/ROW]
[/TABLE]
Source: https://freestatistics.org/blog/index.php?pk=78917&T=2

Globally Unique Identifier (entire table): ba.freestatistics.org/blog/index.php?pk=78917&T=2

As an alternative you can also use a QR Code:  

The GUIDs for individual cells are displayed in the table below:

Partial Autocorrelation Function
Time lag kPACF(k)T-STATP-value
1-0.131826-1.4380.076523
2-0.146718-1.60050.056069
3-0.347966-3.79590.000116
4-0.173561-1.89330.030372
5-0.187982-2.05060.021249
60.0941.02540.153622
70.0432220.47150.319077
80.0560350.61130.271095
9-0.150436-1.64110.051712
10-0.191757-2.09180.01929
11-0.351907-3.83891e-04
120.7626548.31960
130.0008550.00930.496289
140.0212310.23160.408624
150.1805711.96980.025593
160.1930422.10580.01866
170.0677810.73940.230558
18-0.069616-0.75940.224552
190.0495280.54030.295005
20-0.03108-0.3390.367588
210.0152170.1660.43422
22-0.097038-1.05860.145973
23-0.117181-1.27830.101816
24-0.124325-1.35620.088798
250.0210230.22930.4095
260.0195450.21320.415766
27-0.085599-0.93380.176156
28-0.154952-1.69030.046791
29-0.030835-0.33640.368594
30-0.008575-0.09350.462815
31-0.136845-1.49280.069068
320.0085250.0930.463033
330.0030870.03370.486596
340.0278310.30360.380981
350.0629040.68620.246959
360.0123210.13440.446654
37-0.069487-0.7580.22497
38-0.011007-0.12010.452313
39-0.068003-0.74180.229828
40-0.053664-0.58540.279691
410.0082350.08980.464284
42-0.096057-1.04790.148414
430.0540490.58960.278287
440.0649210.70820.240103
45-0.000724-0.00790.496857
46-0.041863-0.45670.324371
47-0.084089-0.91730.180419
48-0.073864-0.80580.210994


Parameters (Session):
par1 = 48 ; par2 = 1 ; par3 = 1 ; par4 = 0 ; par5 = 12 ; par6 = White Noise ; par7 = 0.95 ;
Parameters (R input):
par1 = 48 ; par2 = 1 ; par3 = 1 ; par4 = 0 ; par5 = 12 ; par6 = White Noise ; par7 = 0.95 ;
R code (references can be found in the software module):
if (par1 == 'Default') {
par1 = 10*log10(length(x))
} else {
par1 <- as.numeric(par1)
}
par2 <- as.numeric(par2)
par3 <- as.numeric(par3)
par4 <- as.numeric(par4)
par5 <- as.numeric(par5)
if (par6 == 'White Noise') par6 <- 'white' else par6 <- 'ma'
par7 <- as.numeric(par7)
if (par2 == 0) {
x <- log(x)
} else {
x <- (x ^ par2 - 1) / par2
}
if (par3 > 0) x <- diff(x,lag=1,difference=par3)
if (par4 > 0) x <- diff(x,lag=par5,difference=par4)
bitmap(file='pic1.png')
racf <- acf(x, par1, main='Autocorrelation', xlab='time lag', ylab='ACF', ci.type=par6, ci=par7, sub=paste('(lambda=',par2,', d=',par3,', D=',par4,', CI=', par7, ', CI type=',par6,')',sep=''))
dev.off()
bitmap(file='pic2.png')
rpacf <- pacf(x,par1,main='Partial Autocorrelation',xlab='lags',ylab='PACF')
dev.off()
(myacf <- c(racf$acf))
(mypacf <- c(rpacf$acf))
lengthx <- length(x)
sqrtn <- sqrt(lengthx)
load(file='createtable')
a<-table.start()
a<-table.row.start(a)
a<-table.element(a,'Autocorrelation Function',4,TRUE)
a<-table.row.end(a)
a<-table.row.start(a)
a<-table.element(a,'Time lag k',header=TRUE)
a<-table.element(a,hyperlink('basics.htm','ACF(k)','click here for more information about the Autocorrelation Function'),header=TRUE)
a<-table.element(a,'T-STAT',header=TRUE)
a<-table.element(a,'P-value',header=TRUE)
a<-table.row.end(a)
for (i in 2:(par1+1)) {
a<-table.row.start(a)
a<-table.element(a,i-1,header=TRUE)
a<-table.element(a,round(myacf[i],6))
mytstat <- myacf[i]*sqrtn
a<-table.element(a,round(mytstat,4))
a<-table.element(a,round(1-pt(abs(mytstat),lengthx),6))
a<-table.row.end(a)
}
a<-table.end(a)
table.save(a,file='mytable.tab')
a<-table.start()
a<-table.row.start(a)
a<-table.element(a,'Partial Autocorrelation Function',4,TRUE)
a<-table.row.end(a)
a<-table.row.start(a)
a<-table.element(a,'Time lag k',header=TRUE)
a<-table.element(a,hyperlink('basics.htm','PACF(k)','click here for more information about the Partial Autocorrelation Function'),header=TRUE)
a<-table.element(a,'T-STAT',header=TRUE)
a<-table.element(a,'P-value',header=TRUE)
a<-table.row.end(a)
for (i in 1:par1) {
a<-table.row.start(a)
a<-table.element(a,i,header=TRUE)
a<-table.element(a,round(mypacf[i],6))
mytstat <- mypacf[i]*sqrtn
a<-table.element(a,round(mytstat,4))
a<-table.element(a,round(1-pt(abs(mytstat),lengthx),6))
a<-table.row.end(a)
}
a<-table.end(a)
table.save(a,file='mytable1.tab')