Free Statistics

of Irreproducible Research!

Author's title

Author*Unverified author*
R Software Modulerwasp_autocorrelation.wasp
Title produced by software(Partial) Autocorrelation Function
Date of computationSun, 15 Aug 2010 20:24:45 +0000
Cite this page as followsStatistical Computations at FreeStatistics.org, Office for Research Development and Education, URL https://freestatistics.org/blog/index.php?v=date/2010/Aug/15/t1281903858u1re30sf3ads7u8.htm/, Retrieved Sun, 28 Apr 2024 14:20:15 +0000
Statistical Computations at FreeStatistics.org, Office for Research Development and Education, URL https://freestatistics.org/blog/index.php?pk=78916, Retrieved Sun, 28 Apr 2024 14:20:15 +0000
QR Codes:

Original text written by user:
IsPrivate?No (this computation is public)
User-defined keywords
Estimated Impact128
Family? (F = Feedback message, R = changed R code, M = changed R Module, P = changed Parameters, D = changed Data)
-       [(Partial) Autocorrelation Function] [Autocorrelation] [2010-08-15 20:24:45] [d41d8cd98f00b204e9800998ecf8427e] [Current]
Feedback Forum

Post a new message
Dataseries X:
244
243
242
240
260
259
244
234
235
235
236
238
240
233
233
233
247
251
233
226
233
233
227
225
223
212
206
202
223
221
212
205
204
200
195
193
196
180
174
164
192
189
181
167
166
164
167
164
161
141
134
111
147
144
142
140
143
137
140
130
129
112
101
74
104
103
100
98
99
91
92
94
93
76
64
32
62
69
69
68
68
59
66
73
70
57
48
22
64
74
67
61
61
52
54
69
69
53
50
22
69
78
74
63
67
59
60
80
77
58
54
32
78
86
84
78
72
64
62
72


Summary of computational transaction
Raw Inputview raw input (R code)
Raw Outputview raw output of R engine
Computing time1 seconds
R Server'Gwilym Jenkins' @ 72.249.127.135

\begin{tabular}{lllllllll}
\hline
Summary of computational transaction \tabularnewline
Raw Input & view raw input (R code)  \tabularnewline
Raw Output & view raw output of R engine  \tabularnewline
Computing time & 1 seconds \tabularnewline
R Server & 'Gwilym Jenkins' @ 72.249.127.135 \tabularnewline
\hline
\end{tabular}
%Source: https://freestatistics.org/blog/index.php?pk=78916&T=0

[TABLE]
[ROW][C]Summary of computational transaction[/C][/ROW]
[ROW][C]Raw Input[/C][C]view raw input (R code) [/C][/ROW]
[ROW][C]Raw Output[/C][C]view raw output of R engine [/C][/ROW]
[ROW][C]Computing time[/C][C]1 seconds[/C][/ROW]
[ROW][C]R Server[/C][C]'Gwilym Jenkins' @ 72.249.127.135[/C][/ROW]
[/TABLE]
Source: https://freestatistics.org/blog/index.php?pk=78916&T=0

Globally Unique Identifier (entire table): ba.freestatistics.org/blog/index.php?pk=78916&T=0

As an alternative you can also use a QR Code:  

The GUIDs for individual cells are displayed in the table below:

Summary of computational transaction
Raw Inputview raw input (R code)
Raw Outputview raw output of R engine
Computing time1 seconds
R Server'Gwilym Jenkins' @ 72.249.127.135


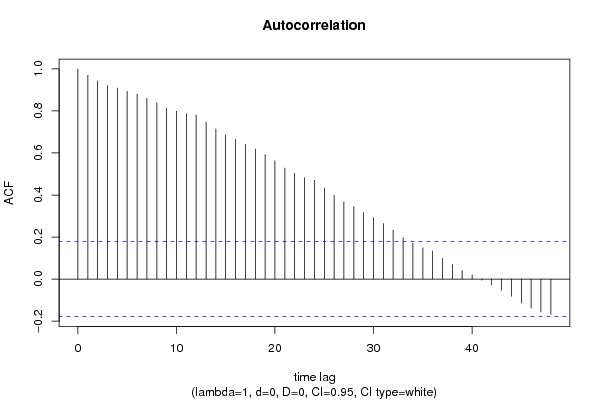
Autocorrelation Function
Time lag kACF(k)T-STATP-value
10.96991710.62490
20.94306110.33070
30.92049310.08350
40.9088099.95550
50.8943219.79680
60.8805159.64560
70.8602339.42340
80.8392899.1940
90.8132138.90830
100.7981388.74320
110.7868558.61960
120.7814278.56010
130.7467598.18030
140.7146677.82880
150.685797.51250
160.6658517.2940
170.6416377.02880
180.6188446.77910
190.5920696.48580
200.5631316.16880
210.5281575.78570
220.5033245.51360
230.4833715.29510
240.4700775.14941e-06
250.433264.74613e-06
260.3987454.3681.3e-05
270.3671924.02245.1e-05
280.3443363.7720.000126
290.3167343.46960.000362
300.2921793.20070.000877
310.2639252.89120.002279
320.2330662.55310.005965
330.1971222.15940.016406
340.1703721.86630.032218
350.1488921.6310.052753
360.1337931.46560.072682
370.0994821.08980.138998
380.0688880.75460.225975
390.0399170.43730.331352
400.0204660.22420.411494
41-0.004961-0.05430.478376
42-0.027959-0.30630.379963
43-0.054045-0.5920.277471
44-0.081771-0.89580.186089
45-0.11423-1.25130.106624
46-0.137975-1.51140.066652
47-0.157093-1.72090.043926
48-0.168596-1.84690.033615

\begin{tabular}{lllllllll}
\hline
Autocorrelation Function \tabularnewline
Time lag k & ACF(k) & T-STAT & P-value \tabularnewline
1 & 0.969917 & 10.6249 & 0 \tabularnewline
2 & 0.943061 & 10.3307 & 0 \tabularnewline
3 & 0.920493 & 10.0835 & 0 \tabularnewline
4 & 0.908809 & 9.9555 & 0 \tabularnewline
5 & 0.894321 & 9.7968 & 0 \tabularnewline
6 & 0.880515 & 9.6456 & 0 \tabularnewline
7 & 0.860233 & 9.4234 & 0 \tabularnewline
8 & 0.839289 & 9.194 & 0 \tabularnewline
9 & 0.813213 & 8.9083 & 0 \tabularnewline
10 & 0.798138 & 8.7432 & 0 \tabularnewline
11 & 0.786855 & 8.6196 & 0 \tabularnewline
12 & 0.781427 & 8.5601 & 0 \tabularnewline
13 & 0.746759 & 8.1803 & 0 \tabularnewline
14 & 0.714667 & 7.8288 & 0 \tabularnewline
15 & 0.68579 & 7.5125 & 0 \tabularnewline
16 & 0.665851 & 7.294 & 0 \tabularnewline
17 & 0.641637 & 7.0288 & 0 \tabularnewline
18 & 0.618844 & 6.7791 & 0 \tabularnewline
19 & 0.592069 & 6.4858 & 0 \tabularnewline
20 & 0.563131 & 6.1688 & 0 \tabularnewline
21 & 0.528157 & 5.7857 & 0 \tabularnewline
22 & 0.503324 & 5.5136 & 0 \tabularnewline
23 & 0.483371 & 5.2951 & 0 \tabularnewline
24 & 0.470077 & 5.1494 & 1e-06 \tabularnewline
25 & 0.43326 & 4.7461 & 3e-06 \tabularnewline
26 & 0.398745 & 4.368 & 1.3e-05 \tabularnewline
27 & 0.367192 & 4.0224 & 5.1e-05 \tabularnewline
28 & 0.344336 & 3.772 & 0.000126 \tabularnewline
29 & 0.316734 & 3.4696 & 0.000362 \tabularnewline
30 & 0.292179 & 3.2007 & 0.000877 \tabularnewline
31 & 0.263925 & 2.8912 & 0.002279 \tabularnewline
32 & 0.233066 & 2.5531 & 0.005965 \tabularnewline
33 & 0.197122 & 2.1594 & 0.016406 \tabularnewline
34 & 0.170372 & 1.8663 & 0.032218 \tabularnewline
35 & 0.148892 & 1.631 & 0.052753 \tabularnewline
36 & 0.133793 & 1.4656 & 0.072682 \tabularnewline
37 & 0.099482 & 1.0898 & 0.138998 \tabularnewline
38 & 0.068888 & 0.7546 & 0.225975 \tabularnewline
39 & 0.039917 & 0.4373 & 0.331352 \tabularnewline
40 & 0.020466 & 0.2242 & 0.411494 \tabularnewline
41 & -0.004961 & -0.0543 & 0.478376 \tabularnewline
42 & -0.027959 & -0.3063 & 0.379963 \tabularnewline
43 & -0.054045 & -0.592 & 0.277471 \tabularnewline
44 & -0.081771 & -0.8958 & 0.186089 \tabularnewline
45 & -0.11423 & -1.2513 & 0.106624 \tabularnewline
46 & -0.137975 & -1.5114 & 0.066652 \tabularnewline
47 & -0.157093 & -1.7209 & 0.043926 \tabularnewline
48 & -0.168596 & -1.8469 & 0.033615 \tabularnewline
\hline
\end{tabular}
%Source: https://freestatistics.org/blog/index.php?pk=78916&T=1

[TABLE]
[ROW][C]Autocorrelation Function[/C][/ROW]
[ROW][C]Time lag k[/C][C]ACF(k)[/C][C]T-STAT[/C][C]P-value[/C][/ROW]
[ROW][C]1[/C][C]0.969917[/C][C]10.6249[/C][C]0[/C][/ROW]
[ROW][C]2[/C][C]0.943061[/C][C]10.3307[/C][C]0[/C][/ROW]
[ROW][C]3[/C][C]0.920493[/C][C]10.0835[/C][C]0[/C][/ROW]
[ROW][C]4[/C][C]0.908809[/C][C]9.9555[/C][C]0[/C][/ROW]
[ROW][C]5[/C][C]0.894321[/C][C]9.7968[/C][C]0[/C][/ROW]
[ROW][C]6[/C][C]0.880515[/C][C]9.6456[/C][C]0[/C][/ROW]
[ROW][C]7[/C][C]0.860233[/C][C]9.4234[/C][C]0[/C][/ROW]
[ROW][C]8[/C][C]0.839289[/C][C]9.194[/C][C]0[/C][/ROW]
[ROW][C]9[/C][C]0.813213[/C][C]8.9083[/C][C]0[/C][/ROW]
[ROW][C]10[/C][C]0.798138[/C][C]8.7432[/C][C]0[/C][/ROW]
[ROW][C]11[/C][C]0.786855[/C][C]8.6196[/C][C]0[/C][/ROW]
[ROW][C]12[/C][C]0.781427[/C][C]8.5601[/C][C]0[/C][/ROW]
[ROW][C]13[/C][C]0.746759[/C][C]8.1803[/C][C]0[/C][/ROW]
[ROW][C]14[/C][C]0.714667[/C][C]7.8288[/C][C]0[/C][/ROW]
[ROW][C]15[/C][C]0.68579[/C][C]7.5125[/C][C]0[/C][/ROW]
[ROW][C]16[/C][C]0.665851[/C][C]7.294[/C][C]0[/C][/ROW]
[ROW][C]17[/C][C]0.641637[/C][C]7.0288[/C][C]0[/C][/ROW]
[ROW][C]18[/C][C]0.618844[/C][C]6.7791[/C][C]0[/C][/ROW]
[ROW][C]19[/C][C]0.592069[/C][C]6.4858[/C][C]0[/C][/ROW]
[ROW][C]20[/C][C]0.563131[/C][C]6.1688[/C][C]0[/C][/ROW]
[ROW][C]21[/C][C]0.528157[/C][C]5.7857[/C][C]0[/C][/ROW]
[ROW][C]22[/C][C]0.503324[/C][C]5.5136[/C][C]0[/C][/ROW]
[ROW][C]23[/C][C]0.483371[/C][C]5.2951[/C][C]0[/C][/ROW]
[ROW][C]24[/C][C]0.470077[/C][C]5.1494[/C][C]1e-06[/C][/ROW]
[ROW][C]25[/C][C]0.43326[/C][C]4.7461[/C][C]3e-06[/C][/ROW]
[ROW][C]26[/C][C]0.398745[/C][C]4.368[/C][C]1.3e-05[/C][/ROW]
[ROW][C]27[/C][C]0.367192[/C][C]4.0224[/C][C]5.1e-05[/C][/ROW]
[ROW][C]28[/C][C]0.344336[/C][C]3.772[/C][C]0.000126[/C][/ROW]
[ROW][C]29[/C][C]0.316734[/C][C]3.4696[/C][C]0.000362[/C][/ROW]
[ROW][C]30[/C][C]0.292179[/C][C]3.2007[/C][C]0.000877[/C][/ROW]
[ROW][C]31[/C][C]0.263925[/C][C]2.8912[/C][C]0.002279[/C][/ROW]
[ROW][C]32[/C][C]0.233066[/C][C]2.5531[/C][C]0.005965[/C][/ROW]
[ROW][C]33[/C][C]0.197122[/C][C]2.1594[/C][C]0.016406[/C][/ROW]
[ROW][C]34[/C][C]0.170372[/C][C]1.8663[/C][C]0.032218[/C][/ROW]
[ROW][C]35[/C][C]0.148892[/C][C]1.631[/C][C]0.052753[/C][/ROW]
[ROW][C]36[/C][C]0.133793[/C][C]1.4656[/C][C]0.072682[/C][/ROW]
[ROW][C]37[/C][C]0.099482[/C][C]1.0898[/C][C]0.138998[/C][/ROW]
[ROW][C]38[/C][C]0.068888[/C][C]0.7546[/C][C]0.225975[/C][/ROW]
[ROW][C]39[/C][C]0.039917[/C][C]0.4373[/C][C]0.331352[/C][/ROW]
[ROW][C]40[/C][C]0.020466[/C][C]0.2242[/C][C]0.411494[/C][/ROW]
[ROW][C]41[/C][C]-0.004961[/C][C]-0.0543[/C][C]0.478376[/C][/ROW]
[ROW][C]42[/C][C]-0.027959[/C][C]-0.3063[/C][C]0.379963[/C][/ROW]
[ROW][C]43[/C][C]-0.054045[/C][C]-0.592[/C][C]0.277471[/C][/ROW]
[ROW][C]44[/C][C]-0.081771[/C][C]-0.8958[/C][C]0.186089[/C][/ROW]
[ROW][C]45[/C][C]-0.11423[/C][C]-1.2513[/C][C]0.106624[/C][/ROW]
[ROW][C]46[/C][C]-0.137975[/C][C]-1.5114[/C][C]0.066652[/C][/ROW]
[ROW][C]47[/C][C]-0.157093[/C][C]-1.7209[/C][C]0.043926[/C][/ROW]
[ROW][C]48[/C][C]-0.168596[/C][C]-1.8469[/C][C]0.033615[/C][/ROW]
[/TABLE]
Source: https://freestatistics.org/blog/index.php?pk=78916&T=1

Globally Unique Identifier (entire table): ba.freestatistics.org/blog/index.php?pk=78916&T=1

As an alternative you can also use a QR Code:  

The GUIDs for individual cells are displayed in the table below:

Autocorrelation Function
Time lag kACF(k)T-STATP-value
10.96991710.62490
20.94306110.33070
30.92049310.08350
40.9088099.95550
50.8943219.79680
60.8805159.64560
70.8602339.42340
80.8392899.1940
90.8132138.90830
100.7981388.74320
110.7868558.61960
120.7814278.56010
130.7467598.18030
140.7146677.82880
150.685797.51250
160.6658517.2940
170.6416377.02880
180.6188446.77910
190.5920696.48580
200.5631316.16880
210.5281575.78570
220.5033245.51360
230.4833715.29510
240.4700775.14941e-06
250.433264.74613e-06
260.3987454.3681.3e-05
270.3671924.02245.1e-05
280.3443363.7720.000126
290.3167343.46960.000362
300.2921793.20070.000877
310.2639252.89120.002279
320.2330662.55310.005965
330.1971222.15940.016406
340.1703721.86630.032218
350.1488921.6310.052753
360.1337931.46560.072682
370.0994821.08980.138998
380.0688880.75460.225975
390.0399170.43730.331352
400.0204660.22420.411494
41-0.004961-0.05430.478376
42-0.027959-0.30630.379963
43-0.054045-0.5920.277471
44-0.081771-0.89580.186089
45-0.11423-1.25130.106624
46-0.137975-1.51140.066652
47-0.157093-1.72090.043926
48-0.168596-1.84690.033615


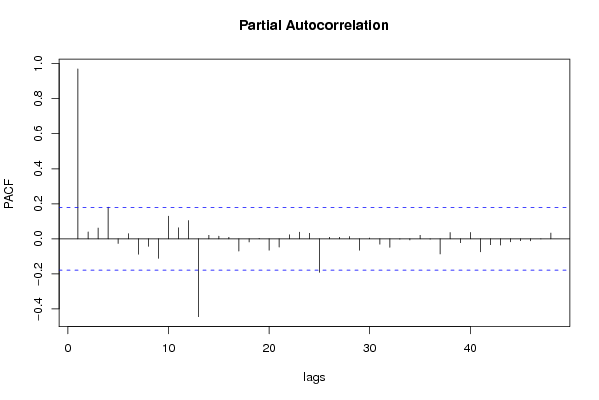
Partial Autocorrelation Function
Time lag kPACF(k)T-STATP-value
10.96991710.62490
20.0391620.4290.334346
30.0615090.67380.250868
40.1807751.98030.024979
5-0.026591-0.29130.385665
60.029140.31920.37506
7-0.087795-0.96170.169055
8-0.042907-0.470.319595
9-0.111505-1.22150.112149
100.129281.41620.079655
110.0624760.68440.247523
120.1040991.14030.128206
13-0.444567-4.872e-06
140.020090.22010.413093
150.01480.16210.435738
160.0088550.0970.461444
17-0.069942-0.76620.222539
18-0.018053-0.19780.421782
190.0019520.02140.491489
20-0.065207-0.71430.238212
21-0.046972-0.51460.303905
220.0229010.25090.401174
230.0380770.41710.338672
240.0315320.34540.365195
25-0.191613-2.0990.018956
260.0087610.0960.461851
270.0084340.09240.463272
280.0128610.14090.444097
29-0.065391-0.71630.237592
300.003890.04260.48304
31-0.030722-0.33650.368524
32-0.048438-0.53060.298335
33-0.00213-0.02330.490711
34-0.006452-0.07070.471887
350.0198930.21790.413933
36-0.001938-0.02120.491548
37-0.086259-0.94490.1733
380.0359190.39350.347334
39-0.022529-0.24680.402745
400.036570.40060.344714
41-0.074612-0.81730.20768
42-0.033897-0.37130.355526
43-0.035479-0.38870.349111
44-0.017321-0.18970.424917
45-0.010731-0.11760.453308
46-0.01133-0.12410.450716
47-0.001029-0.01130.495513
480.0328030.35930.359987

\begin{tabular}{lllllllll}
\hline
Partial Autocorrelation Function \tabularnewline
Time lag k & PACF(k) & T-STAT & P-value \tabularnewline
1 & 0.969917 & 10.6249 & 0 \tabularnewline
2 & 0.039162 & 0.429 & 0.334346 \tabularnewline
3 & 0.061509 & 0.6738 & 0.250868 \tabularnewline
4 & 0.180775 & 1.9803 & 0.024979 \tabularnewline
5 & -0.026591 & -0.2913 & 0.385665 \tabularnewline
6 & 0.02914 & 0.3192 & 0.37506 \tabularnewline
7 & -0.087795 & -0.9617 & 0.169055 \tabularnewline
8 & -0.042907 & -0.47 & 0.319595 \tabularnewline
9 & -0.111505 & -1.2215 & 0.112149 \tabularnewline
10 & 0.12928 & 1.4162 & 0.079655 \tabularnewline
11 & 0.062476 & 0.6844 & 0.247523 \tabularnewline
12 & 0.104099 & 1.1403 & 0.128206 \tabularnewline
13 & -0.444567 & -4.87 & 2e-06 \tabularnewline
14 & 0.02009 & 0.2201 & 0.413093 \tabularnewline
15 & 0.0148 & 0.1621 & 0.435738 \tabularnewline
16 & 0.008855 & 0.097 & 0.461444 \tabularnewline
17 & -0.069942 & -0.7662 & 0.222539 \tabularnewline
18 & -0.018053 & -0.1978 & 0.421782 \tabularnewline
19 & 0.001952 & 0.0214 & 0.491489 \tabularnewline
20 & -0.065207 & -0.7143 & 0.238212 \tabularnewline
21 & -0.046972 & -0.5146 & 0.303905 \tabularnewline
22 & 0.022901 & 0.2509 & 0.401174 \tabularnewline
23 & 0.038077 & 0.4171 & 0.338672 \tabularnewline
24 & 0.031532 & 0.3454 & 0.365195 \tabularnewline
25 & -0.191613 & -2.099 & 0.018956 \tabularnewline
26 & 0.008761 & 0.096 & 0.461851 \tabularnewline
27 & 0.008434 & 0.0924 & 0.463272 \tabularnewline
28 & 0.012861 & 0.1409 & 0.444097 \tabularnewline
29 & -0.065391 & -0.7163 & 0.237592 \tabularnewline
30 & 0.00389 & 0.0426 & 0.48304 \tabularnewline
31 & -0.030722 & -0.3365 & 0.368524 \tabularnewline
32 & -0.048438 & -0.5306 & 0.298335 \tabularnewline
33 & -0.00213 & -0.0233 & 0.490711 \tabularnewline
34 & -0.006452 & -0.0707 & 0.471887 \tabularnewline
35 & 0.019893 & 0.2179 & 0.413933 \tabularnewline
36 & -0.001938 & -0.0212 & 0.491548 \tabularnewline
37 & -0.086259 & -0.9449 & 0.1733 \tabularnewline
38 & 0.035919 & 0.3935 & 0.347334 \tabularnewline
39 & -0.022529 & -0.2468 & 0.402745 \tabularnewline
40 & 0.03657 & 0.4006 & 0.344714 \tabularnewline
41 & -0.074612 & -0.8173 & 0.20768 \tabularnewline
42 & -0.033897 & -0.3713 & 0.355526 \tabularnewline
43 & -0.035479 & -0.3887 & 0.349111 \tabularnewline
44 & -0.017321 & -0.1897 & 0.424917 \tabularnewline
45 & -0.010731 & -0.1176 & 0.453308 \tabularnewline
46 & -0.01133 & -0.1241 & 0.450716 \tabularnewline
47 & -0.001029 & -0.0113 & 0.495513 \tabularnewline
48 & 0.032803 & 0.3593 & 0.359987 \tabularnewline
\hline
\end{tabular}
%Source: https://freestatistics.org/blog/index.php?pk=78916&T=2

[TABLE]
[ROW][C]Partial Autocorrelation Function[/C][/ROW]
[ROW][C]Time lag k[/C][C]PACF(k)[/C][C]T-STAT[/C][C]P-value[/C][/ROW]
[ROW][C]1[/C][C]0.969917[/C][C]10.6249[/C][C]0[/C][/ROW]
[ROW][C]2[/C][C]0.039162[/C][C]0.429[/C][C]0.334346[/C][/ROW]
[ROW][C]3[/C][C]0.061509[/C][C]0.6738[/C][C]0.250868[/C][/ROW]
[ROW][C]4[/C][C]0.180775[/C][C]1.9803[/C][C]0.024979[/C][/ROW]
[ROW][C]5[/C][C]-0.026591[/C][C]-0.2913[/C][C]0.385665[/C][/ROW]
[ROW][C]6[/C][C]0.02914[/C][C]0.3192[/C][C]0.37506[/C][/ROW]
[ROW][C]7[/C][C]-0.087795[/C][C]-0.9617[/C][C]0.169055[/C][/ROW]
[ROW][C]8[/C][C]-0.042907[/C][C]-0.47[/C][C]0.319595[/C][/ROW]
[ROW][C]9[/C][C]-0.111505[/C][C]-1.2215[/C][C]0.112149[/C][/ROW]
[ROW][C]10[/C][C]0.12928[/C][C]1.4162[/C][C]0.079655[/C][/ROW]
[ROW][C]11[/C][C]0.062476[/C][C]0.6844[/C][C]0.247523[/C][/ROW]
[ROW][C]12[/C][C]0.104099[/C][C]1.1403[/C][C]0.128206[/C][/ROW]
[ROW][C]13[/C][C]-0.444567[/C][C]-4.87[/C][C]2e-06[/C][/ROW]
[ROW][C]14[/C][C]0.02009[/C][C]0.2201[/C][C]0.413093[/C][/ROW]
[ROW][C]15[/C][C]0.0148[/C][C]0.1621[/C][C]0.435738[/C][/ROW]
[ROW][C]16[/C][C]0.008855[/C][C]0.097[/C][C]0.461444[/C][/ROW]
[ROW][C]17[/C][C]-0.069942[/C][C]-0.7662[/C][C]0.222539[/C][/ROW]
[ROW][C]18[/C][C]-0.018053[/C][C]-0.1978[/C][C]0.421782[/C][/ROW]
[ROW][C]19[/C][C]0.001952[/C][C]0.0214[/C][C]0.491489[/C][/ROW]
[ROW][C]20[/C][C]-0.065207[/C][C]-0.7143[/C][C]0.238212[/C][/ROW]
[ROW][C]21[/C][C]-0.046972[/C][C]-0.5146[/C][C]0.303905[/C][/ROW]
[ROW][C]22[/C][C]0.022901[/C][C]0.2509[/C][C]0.401174[/C][/ROW]
[ROW][C]23[/C][C]0.038077[/C][C]0.4171[/C][C]0.338672[/C][/ROW]
[ROW][C]24[/C][C]0.031532[/C][C]0.3454[/C][C]0.365195[/C][/ROW]
[ROW][C]25[/C][C]-0.191613[/C][C]-2.099[/C][C]0.018956[/C][/ROW]
[ROW][C]26[/C][C]0.008761[/C][C]0.096[/C][C]0.461851[/C][/ROW]
[ROW][C]27[/C][C]0.008434[/C][C]0.0924[/C][C]0.463272[/C][/ROW]
[ROW][C]28[/C][C]0.012861[/C][C]0.1409[/C][C]0.444097[/C][/ROW]
[ROW][C]29[/C][C]-0.065391[/C][C]-0.7163[/C][C]0.237592[/C][/ROW]
[ROW][C]30[/C][C]0.00389[/C][C]0.0426[/C][C]0.48304[/C][/ROW]
[ROW][C]31[/C][C]-0.030722[/C][C]-0.3365[/C][C]0.368524[/C][/ROW]
[ROW][C]32[/C][C]-0.048438[/C][C]-0.5306[/C][C]0.298335[/C][/ROW]
[ROW][C]33[/C][C]-0.00213[/C][C]-0.0233[/C][C]0.490711[/C][/ROW]
[ROW][C]34[/C][C]-0.006452[/C][C]-0.0707[/C][C]0.471887[/C][/ROW]
[ROW][C]35[/C][C]0.019893[/C][C]0.2179[/C][C]0.413933[/C][/ROW]
[ROW][C]36[/C][C]-0.001938[/C][C]-0.0212[/C][C]0.491548[/C][/ROW]
[ROW][C]37[/C][C]-0.086259[/C][C]-0.9449[/C][C]0.1733[/C][/ROW]
[ROW][C]38[/C][C]0.035919[/C][C]0.3935[/C][C]0.347334[/C][/ROW]
[ROW][C]39[/C][C]-0.022529[/C][C]-0.2468[/C][C]0.402745[/C][/ROW]
[ROW][C]40[/C][C]0.03657[/C][C]0.4006[/C][C]0.344714[/C][/ROW]
[ROW][C]41[/C][C]-0.074612[/C][C]-0.8173[/C][C]0.20768[/C][/ROW]
[ROW][C]42[/C][C]-0.033897[/C][C]-0.3713[/C][C]0.355526[/C][/ROW]
[ROW][C]43[/C][C]-0.035479[/C][C]-0.3887[/C][C]0.349111[/C][/ROW]
[ROW][C]44[/C][C]-0.017321[/C][C]-0.1897[/C][C]0.424917[/C][/ROW]
[ROW][C]45[/C][C]-0.010731[/C][C]-0.1176[/C][C]0.453308[/C][/ROW]
[ROW][C]46[/C][C]-0.01133[/C][C]-0.1241[/C][C]0.450716[/C][/ROW]
[ROW][C]47[/C][C]-0.001029[/C][C]-0.0113[/C][C]0.495513[/C][/ROW]
[ROW][C]48[/C][C]0.032803[/C][C]0.3593[/C][C]0.359987[/C][/ROW]
[/TABLE]
Source: https://freestatistics.org/blog/index.php?pk=78916&T=2

Globally Unique Identifier (entire table): ba.freestatistics.org/blog/index.php?pk=78916&T=2

As an alternative you can also use a QR Code:  

The GUIDs for individual cells are displayed in the table below:

Partial Autocorrelation Function
Time lag kPACF(k)T-STATP-value
10.96991710.62490
20.0391620.4290.334346
30.0615090.67380.250868
40.1807751.98030.024979
5-0.026591-0.29130.385665
60.029140.31920.37506
7-0.087795-0.96170.169055
8-0.042907-0.470.319595
9-0.111505-1.22150.112149
100.129281.41620.079655
110.0624760.68440.247523
120.1040991.14030.128206
13-0.444567-4.872e-06
140.020090.22010.413093
150.01480.16210.435738
160.0088550.0970.461444
17-0.069942-0.76620.222539
18-0.018053-0.19780.421782
190.0019520.02140.491489
20-0.065207-0.71430.238212
21-0.046972-0.51460.303905
220.0229010.25090.401174
230.0380770.41710.338672
240.0315320.34540.365195
25-0.191613-2.0990.018956
260.0087610.0960.461851
270.0084340.09240.463272
280.0128610.14090.444097
29-0.065391-0.71630.237592
300.003890.04260.48304
31-0.030722-0.33650.368524
32-0.048438-0.53060.298335
33-0.00213-0.02330.490711
34-0.006452-0.07070.471887
350.0198930.21790.413933
36-0.001938-0.02120.491548
37-0.086259-0.94490.1733
380.0359190.39350.347334
39-0.022529-0.24680.402745
400.036570.40060.344714
41-0.074612-0.81730.20768
42-0.033897-0.37130.355526
43-0.035479-0.38870.349111
44-0.017321-0.18970.424917
45-0.010731-0.11760.453308
46-0.01133-0.12410.450716
47-0.001029-0.01130.495513
480.0328030.35930.359987


Parameters (Session):
par1 = 48 ; par2 = 1 ; par3 = 0 ; par4 = 0 ; par5 = 12 ; par6 = White Noise ; par7 = 0.95 ;
Parameters (R input):
par1 = 48 ; par2 = 1 ; par3 = 0 ; par4 = 0 ; par5 = 12 ; par6 = White Noise ; par7 = 0.95 ;
R code (references can be found in the software module):
if (par1 == 'Default') {
par1 = 10*log10(length(x))
} else {
par1 <- as.numeric(par1)
}
par2 <- as.numeric(par2)
par3 <- as.numeric(par3)
par4 <- as.numeric(par4)
par5 <- as.numeric(par5)
if (par6 == 'White Noise') par6 <- 'white' else par6 <- 'ma'
par7 <- as.numeric(par7)
if (par2 == 0) {
x <- log(x)
} else {
x <- (x ^ par2 - 1) / par2
}
if (par3 > 0) x <- diff(x,lag=1,difference=par3)
if (par4 > 0) x <- diff(x,lag=par5,difference=par4)
bitmap(file='pic1.png')
racf <- acf(x, par1, main='Autocorrelation', xlab='time lag', ylab='ACF', ci.type=par6, ci=par7, sub=paste('(lambda=',par2,', d=',par3,', D=',par4,', CI=', par7, ', CI type=',par6,')',sep=''))
dev.off()
bitmap(file='pic2.png')
rpacf <- pacf(x,par1,main='Partial Autocorrelation',xlab='lags',ylab='PACF')
dev.off()
(myacf <- c(racf$acf))
(mypacf <- c(rpacf$acf))
lengthx <- length(x)
sqrtn <- sqrt(lengthx)
load(file='createtable')
a<-table.start()
a<-table.row.start(a)
a<-table.element(a,'Autocorrelation Function',4,TRUE)
a<-table.row.end(a)
a<-table.row.start(a)
a<-table.element(a,'Time lag k',header=TRUE)
a<-table.element(a,hyperlink('basics.htm','ACF(k)','click here for more information about the Autocorrelation Function'),header=TRUE)
a<-table.element(a,'T-STAT',header=TRUE)
a<-table.element(a,'P-value',header=TRUE)
a<-table.row.end(a)
for (i in 2:(par1+1)) {
a<-table.row.start(a)
a<-table.element(a,i-1,header=TRUE)
a<-table.element(a,round(myacf[i],6))
mytstat <- myacf[i]*sqrtn
a<-table.element(a,round(mytstat,4))
a<-table.element(a,round(1-pt(abs(mytstat),lengthx),6))
a<-table.row.end(a)
}
a<-table.end(a)
table.save(a,file='mytable.tab')
a<-table.start()
a<-table.row.start(a)
a<-table.element(a,'Partial Autocorrelation Function',4,TRUE)
a<-table.row.end(a)
a<-table.row.start(a)
a<-table.element(a,'Time lag k',header=TRUE)
a<-table.element(a,hyperlink('basics.htm','PACF(k)','click here for more information about the Partial Autocorrelation Function'),header=TRUE)
a<-table.element(a,'T-STAT',header=TRUE)
a<-table.element(a,'P-value',header=TRUE)
a<-table.row.end(a)
for (i in 1:par1) {
a<-table.row.start(a)
a<-table.element(a,i,header=TRUE)
a<-table.element(a,round(mypacf[i],6))
mytstat <- mypacf[i]*sqrtn
a<-table.element(a,round(mytstat,4))
a<-table.element(a,round(1-pt(abs(mytstat),lengthx),6))
a<-table.row.end(a)
}
a<-table.end(a)
table.save(a,file='mytable1.tab')