Free Statistics

of Irreproducible Research!

Author's title

Author*Unverified author*
R Software Modulerwasp_smp.wasp
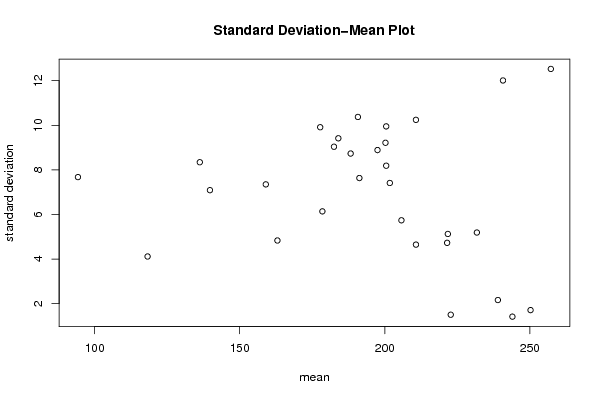
Title produced by softwareStandard Deviation-Mean Plot
Date of computationSun, 15 Aug 2010 20:19:41 +0000
Cite this page as followsStatistical Computations at FreeStatistics.org, Office for Research Development and Education, URL https://freestatistics.org/blog/index.php?v=date/2010/Aug/15/t1281903576pysdo7tm499f6iy.htm/, Retrieved Sat, 27 Apr 2024 20:49:11 +0000
Statistical Computations at FreeStatistics.org, Office for Research Development and Education, URL https://freestatistics.org/blog/index.php?pk=78915, Retrieved Sat, 27 Apr 2024 20:49:11 +0000
QR Codes:

Original text written by user:
IsPrivate?No (this computation is public)
User-defined keywordsDe Cock Nicola
Estimated Impact121
Family? (F = Feedback message, R = changed R code, M = changed R Module, P = changed Parameters, D = changed Data)
-       [Standard Deviation-Mean Plot] [TIJDREEKS A - STA...] [2010-08-15 20:19:41] [c2fbba04702f7f714f5f9c5d7ee07bac] [Current]
Feedback Forum

Post a new message
Dataseries X:
252
251
250
248
268
267
252
242
243
243
244
246
236
241
240
239
253
249
232
229
221
222
224
224
215
225
225
221
238
234
228
227
216
219
225
227
205
215
214
209
222
216
206
199
189
198
203
211
199
211
210
203
214
202
193
193
176
192
200
195
180
197
194
194
212
202
195
198
170
187
190
189
176
188
195
194
211
203
194
194
163
183
181
184
171
178
179
186
205
204
195
186
156
167
164
165
153
160
154
169
186
188
187
169
131
146
145
137
119
118
113
123
142
141
138
124
83
100
96
98


Summary of computational transaction
Raw Inputview raw input (R code)
Raw Outputview raw output of R engine
Computing time2 seconds
R Server'RServer@AstonUniversity' @ vre.aston.ac.uk

\begin{tabular}{lllllllll}
\hline
Summary of computational transaction \tabularnewline
Raw Input & view raw input (R code)  \tabularnewline
Raw Output & view raw output of R engine  \tabularnewline
Computing time & 2 seconds \tabularnewline
R Server & 'RServer@AstonUniversity' @ vre.aston.ac.uk \tabularnewline
\hline
\end{tabular}
%Source: https://freestatistics.org/blog/index.php?pk=78915&T=0

[TABLE]
[ROW][C]Summary of computational transaction[/C][/ROW]
[ROW][C]Raw Input[/C][C]view raw input (R code) [/C][/ROW]
[ROW][C]Raw Output[/C][C]view raw output of R engine [/C][/ROW]
[ROW][C]Computing time[/C][C]2 seconds[/C][/ROW]
[ROW][C]R Server[/C][C]'RServer@AstonUniversity' @ vre.aston.ac.uk[/C][/ROW]
[/TABLE]
Source: https://freestatistics.org/blog/index.php?pk=78915&T=0

Globally Unique Identifier (entire table): ba.freestatistics.org/blog/index.php?pk=78915&T=0

As an alternative you can also use a QR Code:  

The GUIDs for individual cells are displayed in the table below:

Summary of computational transaction
Raw Inputview raw input (R code)
Raw Outputview raw output of R engine
Computing time2 seconds
R Server'RServer@AstonUniversity' @ vre.aston.ac.uk


Standard Deviation-Mean Plot
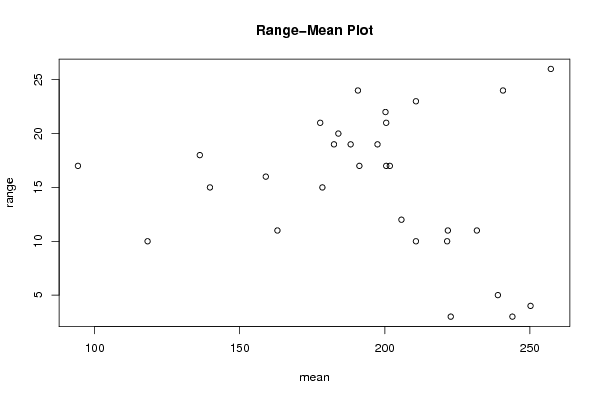
SectionMeanStandard DeviationRange
1250.251.707825127659934
2257.2512.526638282742426
32441.41421356237313
42392.160246899469295
5240.7512.010412149464324
6222.751.53
7221.54.7258156262526110
8231.755.1881274720911311
9221.755.123475382979811
10210.754.6457866215887810
11210.7510.242883708539623
12200.259.2150239645193922
13205.755.737304826019512
14200.59.949874371066221
15190.7510.372238588334424
16191.257.6321687612368717
17201.757.4105780251385717
181849.4162979278836920
19188.258.7321245982864919
20200.58.1853527718724517
21177.759.912113800799521
22178.56.1373175465073215
23197.58.8881944173155919
241634.8304589153964811
251597.3484692283495316
26182.59.0369611411506419
27139.757.0887234393789115
28118.254.1129875597510210
29136.258.3416625041614718
3094.257.6757192931129717

\begin{tabular}{lllllllll}
\hline
Standard Deviation-Mean Plot \tabularnewline
Section & Mean & Standard Deviation & Range \tabularnewline
1 & 250.25 & 1.70782512765993 & 4 \tabularnewline
2 & 257.25 & 12.5266382827424 & 26 \tabularnewline
3 & 244 & 1.4142135623731 & 3 \tabularnewline
4 & 239 & 2.16024689946929 & 5 \tabularnewline
5 & 240.75 & 12.0104121494643 & 24 \tabularnewline
6 & 222.75 & 1.5 & 3 \tabularnewline
7 & 221.5 & 4.72581562625261 & 10 \tabularnewline
8 & 231.75 & 5.18812747209113 & 11 \tabularnewline
9 & 221.75 & 5.1234753829798 & 11 \tabularnewline
10 & 210.75 & 4.64578662158878 & 10 \tabularnewline
11 & 210.75 & 10.2428837085396 & 23 \tabularnewline
12 & 200.25 & 9.21502396451939 & 22 \tabularnewline
13 & 205.75 & 5.7373048260195 & 12 \tabularnewline
14 & 200.5 & 9.9498743710662 & 21 \tabularnewline
15 & 190.75 & 10.3722385883344 & 24 \tabularnewline
16 & 191.25 & 7.63216876123687 & 17 \tabularnewline
17 & 201.75 & 7.41057802513857 & 17 \tabularnewline
18 & 184 & 9.41629792788369 & 20 \tabularnewline
19 & 188.25 & 8.73212459828649 & 19 \tabularnewline
20 & 200.5 & 8.18535277187245 & 17 \tabularnewline
21 & 177.75 & 9.9121138007995 & 21 \tabularnewline
22 & 178.5 & 6.13731754650732 & 15 \tabularnewline
23 & 197.5 & 8.88819441731559 & 19 \tabularnewline
24 & 163 & 4.83045891539648 & 11 \tabularnewline
25 & 159 & 7.34846922834953 & 16 \tabularnewline
26 & 182.5 & 9.03696114115064 & 19 \tabularnewline
27 & 139.75 & 7.08872343937891 & 15 \tabularnewline
28 & 118.25 & 4.11298755975102 & 10 \tabularnewline
29 & 136.25 & 8.34166250416147 & 18 \tabularnewline
30 & 94.25 & 7.67571929311297 & 17 \tabularnewline
\hline
\end{tabular}
%Source: https://freestatistics.org/blog/index.php?pk=78915&T=1

[TABLE]
[ROW][C]Standard Deviation-Mean Plot[/C][/ROW]
[ROW][C]Section[/C][C]Mean[/C][C]Standard Deviation[/C][C]Range[/C][/ROW]
[ROW][C]1[/C][C]250.25[/C][C]1.70782512765993[/C][C]4[/C][/ROW]
[ROW][C]2[/C][C]257.25[/C][C]12.5266382827424[/C][C]26[/C][/ROW]
[ROW][C]3[/C][C]244[/C][C]1.4142135623731[/C][C]3[/C][/ROW]
[ROW][C]4[/C][C]239[/C][C]2.16024689946929[/C][C]5[/C][/ROW]
[ROW][C]5[/C][C]240.75[/C][C]12.0104121494643[/C][C]24[/C][/ROW]
[ROW][C]6[/C][C]222.75[/C][C]1.5[/C][C]3[/C][/ROW]
[ROW][C]7[/C][C]221.5[/C][C]4.72581562625261[/C][C]10[/C][/ROW]
[ROW][C]8[/C][C]231.75[/C][C]5.18812747209113[/C][C]11[/C][/ROW]
[ROW][C]9[/C][C]221.75[/C][C]5.1234753829798[/C][C]11[/C][/ROW]
[ROW][C]10[/C][C]210.75[/C][C]4.64578662158878[/C][C]10[/C][/ROW]
[ROW][C]11[/C][C]210.75[/C][C]10.2428837085396[/C][C]23[/C][/ROW]
[ROW][C]12[/C][C]200.25[/C][C]9.21502396451939[/C][C]22[/C][/ROW]
[ROW][C]13[/C][C]205.75[/C][C]5.7373048260195[/C][C]12[/C][/ROW]
[ROW][C]14[/C][C]200.5[/C][C]9.9498743710662[/C][C]21[/C][/ROW]
[ROW][C]15[/C][C]190.75[/C][C]10.3722385883344[/C][C]24[/C][/ROW]
[ROW][C]16[/C][C]191.25[/C][C]7.63216876123687[/C][C]17[/C][/ROW]
[ROW][C]17[/C][C]201.75[/C][C]7.41057802513857[/C][C]17[/C][/ROW]
[ROW][C]18[/C][C]184[/C][C]9.41629792788369[/C][C]20[/C][/ROW]
[ROW][C]19[/C][C]188.25[/C][C]8.73212459828649[/C][C]19[/C][/ROW]
[ROW][C]20[/C][C]200.5[/C][C]8.18535277187245[/C][C]17[/C][/ROW]
[ROW][C]21[/C][C]177.75[/C][C]9.9121138007995[/C][C]21[/C][/ROW]
[ROW][C]22[/C][C]178.5[/C][C]6.13731754650732[/C][C]15[/C][/ROW]
[ROW][C]23[/C][C]197.5[/C][C]8.88819441731559[/C][C]19[/C][/ROW]
[ROW][C]24[/C][C]163[/C][C]4.83045891539648[/C][C]11[/C][/ROW]
[ROW][C]25[/C][C]159[/C][C]7.34846922834953[/C][C]16[/C][/ROW]
[ROW][C]26[/C][C]182.5[/C][C]9.03696114115064[/C][C]19[/C][/ROW]
[ROW][C]27[/C][C]139.75[/C][C]7.08872343937891[/C][C]15[/C][/ROW]
[ROW][C]28[/C][C]118.25[/C][C]4.11298755975102[/C][C]10[/C][/ROW]
[ROW][C]29[/C][C]136.25[/C][C]8.34166250416147[/C][C]18[/C][/ROW]
[ROW][C]30[/C][C]94.25[/C][C]7.67571929311297[/C][C]17[/C][/ROW]
[/TABLE]
Source: https://freestatistics.org/blog/index.php?pk=78915&T=1

Globally Unique Identifier (entire table): ba.freestatistics.org/blog/index.php?pk=78915&T=1

As an alternative you can also use a QR Code:  

The GUIDs for individual cells are displayed in the table below:

Standard Deviation-Mean Plot
SectionMeanStandard DeviationRange
1250.251.707825127659934
2257.2512.526638282742426
32441.41421356237313
42392.160246899469295
5240.7512.010412149464324
6222.751.53
7221.54.7258156262526110
8231.755.1881274720911311
9221.755.123475382979811
10210.754.6457866215887810
11210.7510.242883708539623
12200.259.2150239645193922
13205.755.737304826019512
14200.59.949874371066221
15190.7510.372238588334424
16191.257.6321687612368717
17201.757.4105780251385717
181849.4162979278836920
19188.258.7321245982864919
20200.58.1853527718724517
21177.759.912113800799521
22178.56.1373175465073215
23197.58.8881944173155919
241634.8304589153964811
251597.3484692283495316
26182.59.0369611411506419
27139.757.0887234393789115
28118.254.1129875597510210
29136.258.3416625041614718
3094.257.6757192931129717


Regression: S.E.(k) = alpha + beta * Mean(k)
alpha9.21629157118917
beta-0.0111291754826557
S.D.0.0146463319648786
T-STAT-0.759860933737066
p-value0.453688476853477

\begin{tabular}{lllllllll}
\hline
Regression: S.E.(k) = alpha + beta * Mean(k) \tabularnewline
alpha & 9.21629157118917 \tabularnewline
beta & -0.0111291754826557 \tabularnewline
S.D. & 0.0146463319648786 \tabularnewline
T-STAT & -0.759860933737066 \tabularnewline
p-value & 0.453688476853477 \tabularnewline
\hline
\end{tabular}
%Source: https://freestatistics.org/blog/index.php?pk=78915&T=2

[TABLE]
[ROW][C]Regression: S.E.(k) = alpha + beta * Mean(k)[/C][/ROW]
[ROW][C]alpha[/C][C]9.21629157118917[/C][/ROW]
[ROW][C]beta[/C][C]-0.0111291754826557[/C][/ROW]
[ROW][C]S.D.[/C][C]0.0146463319648786[/C][/ROW]
[ROW][C]T-STAT[/C][C]-0.759860933737066[/C][/ROW]
[ROW][C]p-value[/C][C]0.453688476853477[/C][/ROW]
[/TABLE]
Source: https://freestatistics.org/blog/index.php?pk=78915&T=2

Globally Unique Identifier (entire table): ba.freestatistics.org/blog/index.php?pk=78915&T=2

As an alternative you can also use a QR Code:  

The GUIDs for individual cells are displayed in the table below:

Regression: S.E.(k) = alpha + beta * Mean(k)
alpha9.21629157118917
beta-0.0111291754826557
S.D.0.0146463319648786
T-STAT-0.759860933737066
p-value0.453688476853477


Regression: ln S.E.(k) = alpha + beta * ln Mean(k)
alpha5.26865910768464
beta-0.657139620211465
S.D.0.48489294429476
T-STAT-1.35522619568578
p-value0.186178361977016
Lambda1.65713962021147

\begin{tabular}{lllllllll}
\hline
Regression: ln S.E.(k) = alpha + beta * ln Mean(k) \tabularnewline
alpha & 5.26865910768464 \tabularnewline
beta & -0.657139620211465 \tabularnewline
S.D. & 0.48489294429476 \tabularnewline
T-STAT & -1.35522619568578 \tabularnewline
p-value & 0.186178361977016 \tabularnewline
Lambda & 1.65713962021147 \tabularnewline
\hline
\end{tabular}
%Source: https://freestatistics.org/blog/index.php?pk=78915&T=3

[TABLE]
[ROW][C]Regression: ln S.E.(k) = alpha + beta * ln Mean(k)[/C][/ROW]
[ROW][C]alpha[/C][C]5.26865910768464[/C][/ROW]
[ROW][C]beta[/C][C]-0.657139620211465[/C][/ROW]
[ROW][C]S.D.[/C][C]0.48489294429476[/C][/ROW]
[ROW][C]T-STAT[/C][C]-1.35522619568578[/C][/ROW]
[ROW][C]p-value[/C][C]0.186178361977016[/C][/ROW]
[ROW][C]Lambda[/C][C]1.65713962021147[/C][/ROW]
[/TABLE]
Source: https://freestatistics.org/blog/index.php?pk=78915&T=3

Globally Unique Identifier (entire table): ba.freestatistics.org/blog/index.php?pk=78915&T=3

As an alternative you can also use a QR Code:  

The GUIDs for individual cells are displayed in the table below:

Regression: ln S.E.(k) = alpha + beta * ln Mean(k)
alpha5.26865910768464
beta-0.657139620211465
S.D.0.48489294429476
T-STAT-1.35522619568578
p-value0.186178361977016
Lambda1.65713962021147


Parameters (Session):
par1 = 4 ;
Parameters (R input):
par1 = 4 ;
R code (references can be found in the software module):
par1 <- as.numeric(par1)
(n <- length(x))
(np <- floor(n / par1))
arr <- array(NA,dim=c(par1,np))
j <- 0
k <- 1
for (i in 1:(np*par1))
{
j = j + 1
arr[j,k] <- x[i]
if (j == par1) {
j = 0
k=k+1
}
}
arr
arr.mean <- array(NA,dim=np)
arr.sd <- array(NA,dim=np)
arr.range <- array(NA,dim=np)
for (j in 1:np)
{
arr.mean[j] <- mean(arr[,j],na.rm=TRUE)
arr.sd[j] <- sd(arr[,j],na.rm=TRUE)
arr.range[j] <- max(arr[,j],na.rm=TRUE) - min(arr[,j],na.rm=TRUE)
}
arr.mean
arr.sd
arr.range
(lm1 <- lm(arr.sd~arr.mean))
(lnlm1 <- lm(log(arr.sd)~log(arr.mean)))
(lm2 <- lm(arr.range~arr.mean))
bitmap(file='test1.png')
plot(arr.mean,arr.sd,main='Standard Deviation-Mean Plot',xlab='mean',ylab='standard deviation')
dev.off()
bitmap(file='test2.png')
plot(arr.mean,arr.range,main='Range-Mean Plot',xlab='mean',ylab='range')
dev.off()
load(file='createtable')
a<-table.start()
a<-table.row.start(a)
a<-table.element(a,'Standard Deviation-Mean Plot',4,TRUE)
a<-table.row.end(a)
a<-table.row.start(a)
a<-table.element(a,'Section',header=TRUE)
a<-table.element(a,'Mean',header=TRUE)
a<-table.element(a,'Standard Deviation',header=TRUE)
a<-table.element(a,'Range',header=TRUE)
a<-table.row.end(a)
for (j in 1:np) {
a<-table.row.start(a)
a<-table.element(a,j,header=TRUE)
a<-table.element(a,arr.mean[j])
a<-table.element(a,arr.sd[j] )
a<-table.element(a,arr.range[j] )
a<-table.row.end(a)
}
a<-table.end(a)
table.save(a,file='mytable.tab')
a<-table.start()
a<-table.row.start(a)
a<-table.element(a,'Regression: S.E.(k) = alpha + beta * Mean(k)',2,TRUE)
a<-table.row.end(a)
a<-table.row.start(a)
a<-table.element(a,'alpha',header=TRUE)
a<-table.element(a,lm1$coefficients[[1]])
a<-table.row.end(a)
a<-table.row.start(a)
a<-table.element(a,'beta',header=TRUE)
a<-table.element(a,lm1$coefficients[[2]])
a<-table.row.end(a)
a<-table.row.start(a)
a<-table.element(a,'S.D.',header=TRUE)
a<-table.element(a,summary(lm1)$coefficients[2,2])
a<-table.row.end(a)
a<-table.row.start(a)
a<-table.element(a,'T-STAT',header=TRUE)
a<-table.element(a,summary(lm1)$coefficients[2,3])
a<-table.row.end(a)
a<-table.row.start(a)
a<-table.element(a,'p-value',header=TRUE)
a<-table.element(a,summary(lm1)$coefficients[2,4])
a<-table.row.end(a)
a<-table.end(a)
table.save(a,file='mytable1.tab')
a<-table.start()
a<-table.row.start(a)
a<-table.element(a,'Regression: ln S.E.(k) = alpha + beta * ln Mean(k)',2,TRUE)
a<-table.row.end(a)
a<-table.row.start(a)
a<-table.element(a,'alpha',header=TRUE)
a<-table.element(a,lnlm1$coefficients[[1]])
a<-table.row.end(a)
a<-table.row.start(a)
a<-table.element(a,'beta',header=TRUE)
a<-table.element(a,lnlm1$coefficients[[2]])
a<-table.row.end(a)
a<-table.row.start(a)
a<-table.element(a,'S.D.',header=TRUE)
a<-table.element(a,summary(lnlm1)$coefficients[2,2])
a<-table.row.end(a)
a<-table.row.start(a)
a<-table.element(a,'T-STAT',header=TRUE)
a<-table.element(a,summary(lnlm1)$coefficients[2,3])
a<-table.row.end(a)
a<-table.row.start(a)
a<-table.element(a,'p-value',header=TRUE)
a<-table.element(a,summary(lnlm1)$coefficients[2,4])
a<-table.row.end(a)
a<-table.row.start(a)
a<-table.element(a,'Lambda',header=TRUE)
a<-table.element(a,1-lnlm1$coefficients[[2]])
a<-table.row.end(a)
a<-table.end(a)
table.save(a,file='mytable2.tab')