Free Statistics

of Irreproducible Research!

Author's title

Author*Unverified author*
R Software Modulerwasp_autocorrelation.wasp
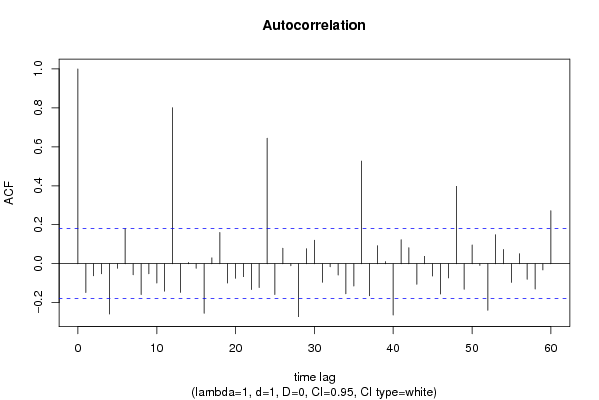
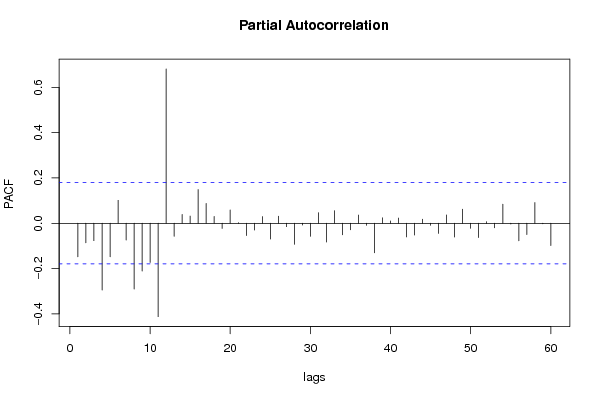
Title produced by software(Partial) Autocorrelation Function
Date of computationSun, 15 Aug 2010 19:44:38 +0000
Cite this page as followsStatistical Computations at FreeStatistics.org, Office for Research Development and Education, URL https://freestatistics.org/blog/index.php?v=date/2010/Aug/15/t12819019452bxuzebig2vhv4q.htm/, Retrieved Sun, 28 Apr 2024 03:51:13 +0000
Statistical Computations at FreeStatistics.org, Office for Research Development and Education, URL https://freestatistics.org/blog/index.php?pk=78911, Retrieved Sun, 28 Apr 2024 03:51:13 +0000
QR Codes:

Original text written by user:
IsPrivate?No (this computation is public)
User-defined keywordsDe Cock Nicola
Estimated Impact123
Family? (F = Feedback message, R = changed R code, M = changed R Module, P = changed Parameters, D = changed Data)
-     [] [] [1970-01-01 00:00:00] [cc366ae8d7d1b3a5c939935b2f92f2a3]
- RMPD    [(Partial) Autocorrelation Function] [TIJDREEKS A - STA...] [2010-08-15 19:44:38] [c2fbba04702f7f714f5f9c5d7ee07bac] [Current]
Feedback Forum

Post a new message
Dataseries X:
252
251
250
248
268
267
252
242
243
243
244
246
236
241
240
239
253
249
232
229
221
222
224
224
215
225
225
221
238
234
228
227
216
219
225
227
205
215
214
209
222
216
206
199
189
198
203
211
199
211
210
203
214
202
193
193
176
192
200
195
180
197
194
194
212
202
195
198
170
187
190
189
176
188
195
194
211
203
194
194
163
183
181
184
171
178
179
186
205
204
195
186
156
167
164
165
153
160
154
169
186
188
187
169
131
146
145
137
119
118
113
123
142
141
138
124
83
100
96
98


Summary of computational transaction
Raw Inputview raw input (R code)
Raw Outputview raw output of R engine
Computing time1 seconds
R Server'RServer@AstonUniversity' @ vre.aston.ac.uk

\begin{tabular}{lllllllll}
\hline
Summary of computational transaction \tabularnewline
Raw Input & view raw input (R code)  \tabularnewline
Raw Output & view raw output of R engine  \tabularnewline
Computing time & 1 seconds \tabularnewline
R Server & 'RServer@AstonUniversity' @ vre.aston.ac.uk \tabularnewline
\hline
\end{tabular}
%Source: https://freestatistics.org/blog/index.php?pk=78911&T=0

[TABLE]
[ROW][C]Summary of computational transaction[/C][/ROW]
[ROW][C]Raw Input[/C][C]view raw input (R code) [/C][/ROW]
[ROW][C]Raw Output[/C][C]view raw output of R engine [/C][/ROW]
[ROW][C]Computing time[/C][C]1 seconds[/C][/ROW]
[ROW][C]R Server[/C][C]'RServer@AstonUniversity' @ vre.aston.ac.uk[/C][/ROW]
[/TABLE]
Source: https://freestatistics.org/blog/index.php?pk=78911&T=0

Globally Unique Identifier (entire table): ba.freestatistics.org/blog/index.php?pk=78911&T=0

As an alternative you can also use a QR Code:  

The GUIDs for individual cells are displayed in the table below:

Summary of computational transaction
Raw Inputview raw input (R code)
Raw Outputview raw output of R engine
Computing time1 seconds
R Server'RServer@AstonUniversity' @ vre.aston.ac.uk


Autocorrelation Function
Time lag kACF(k)T-STATP-value
1-0.147632-1.61050.054972
2-0.062282-0.67940.249097
3-0.051983-0.56710.285869
4-0.258773-2.82290.00279
5-0.023128-0.25230.400624
60.1798891.96240.026028
7-0.057384-0.6260.266262
8-0.158145-1.72520.043547
9-0.051846-0.56560.286375
10-0.099069-1.08070.141004
11-0.141078-1.5390.063232
120.800448.73180
13-0.147311-1.6070.055355
140.0065180.07110.471716
15-0.023163-0.25270.400477
16-0.254227-2.77330.003222
170.0299560.32680.372205
180.1602321.74790.041528
19-0.099597-1.08650.139732
20-0.074618-0.8140.208639
21-0.066593-0.72640.234497
22-0.133023-1.45110.07469
23-0.122336-1.33450.092289
240.6443087.02860
25-0.158152-1.72520.04354
260.0795330.86760.193679
27-0.010508-0.11460.454467
28-0.271951-2.96660.00182
290.0770680.84070.201099
300.1200981.31010.096339
31-0.095568-1.04250.14964
32-0.015512-0.16920.432955
33-0.057804-0.63060.264765
34-0.154186-1.6820.047598
35-0.114269-1.24650.10751
360.5269615.74850
37-0.16493-1.79920.037263
380.0925111.00920.15747
390.010680.11650.453725
40-0.263905-2.87890.002367
410.1230961.34280.090943
420.0823610.89850.185379
43-0.106062-1.1570.124796
440.0376070.41020.341182
45-0.063122-0.68860.246214
46-0.155813-1.69970.045898
47-0.072924-0.79550.213951
480.3972194.33311.5e-05
49-0.131228-1.43150.077449
500.0962461.04990.147942
51-0.008665-0.09450.462424
52-0.239306-2.61050.005101
530.1488461.62370.053541
540.0728150.79430.214297
55-0.096247-1.04990.147938
560.0509430.55570.28972
57-0.080111-0.87390.191965
58-0.130544-1.42410.078522
59-0.031902-0.3480.364222
600.2719352.96650.001821

\begin{tabular}{lllllllll}
\hline
Autocorrelation Function \tabularnewline
Time lag k & ACF(k) & T-STAT & P-value \tabularnewline
1 & -0.147632 & -1.6105 & 0.054972 \tabularnewline
2 & -0.062282 & -0.6794 & 0.249097 \tabularnewline
3 & -0.051983 & -0.5671 & 0.285869 \tabularnewline
4 & -0.258773 & -2.8229 & 0.00279 \tabularnewline
5 & -0.023128 & -0.2523 & 0.400624 \tabularnewline
6 & 0.179889 & 1.9624 & 0.026028 \tabularnewline
7 & -0.057384 & -0.626 & 0.266262 \tabularnewline
8 & -0.158145 & -1.7252 & 0.043547 \tabularnewline
9 & -0.051846 & -0.5656 & 0.286375 \tabularnewline
10 & -0.099069 & -1.0807 & 0.141004 \tabularnewline
11 & -0.141078 & -1.539 & 0.063232 \tabularnewline
12 & 0.80044 & 8.7318 & 0 \tabularnewline
13 & -0.147311 & -1.607 & 0.055355 \tabularnewline
14 & 0.006518 & 0.0711 & 0.471716 \tabularnewline
15 & -0.023163 & -0.2527 & 0.400477 \tabularnewline
16 & -0.254227 & -2.7733 & 0.003222 \tabularnewline
17 & 0.029956 & 0.3268 & 0.372205 \tabularnewline
18 & 0.160232 & 1.7479 & 0.041528 \tabularnewline
19 & -0.099597 & -1.0865 & 0.139732 \tabularnewline
20 & -0.074618 & -0.814 & 0.208639 \tabularnewline
21 & -0.066593 & -0.7264 & 0.234497 \tabularnewline
22 & -0.133023 & -1.4511 & 0.07469 \tabularnewline
23 & -0.122336 & -1.3345 & 0.092289 \tabularnewline
24 & 0.644308 & 7.0286 & 0 \tabularnewline
25 & -0.158152 & -1.7252 & 0.04354 \tabularnewline
26 & 0.079533 & 0.8676 & 0.193679 \tabularnewline
27 & -0.010508 & -0.1146 & 0.454467 \tabularnewline
28 & -0.271951 & -2.9666 & 0.00182 \tabularnewline
29 & 0.077068 & 0.8407 & 0.201099 \tabularnewline
30 & 0.120098 & 1.3101 & 0.096339 \tabularnewline
31 & -0.095568 & -1.0425 & 0.14964 \tabularnewline
32 & -0.015512 & -0.1692 & 0.432955 \tabularnewline
33 & -0.057804 & -0.6306 & 0.264765 \tabularnewline
34 & -0.154186 & -1.682 & 0.047598 \tabularnewline
35 & -0.114269 & -1.2465 & 0.10751 \tabularnewline
36 & 0.526961 & 5.7485 & 0 \tabularnewline
37 & -0.16493 & -1.7992 & 0.037263 \tabularnewline
38 & 0.092511 & 1.0092 & 0.15747 \tabularnewline
39 & 0.01068 & 0.1165 & 0.453725 \tabularnewline
40 & -0.263905 & -2.8789 & 0.002367 \tabularnewline
41 & 0.123096 & 1.3428 & 0.090943 \tabularnewline
42 & 0.082361 & 0.8985 & 0.185379 \tabularnewline
43 & -0.106062 & -1.157 & 0.124796 \tabularnewline
44 & 0.037607 & 0.4102 & 0.341182 \tabularnewline
45 & -0.063122 & -0.6886 & 0.246214 \tabularnewline
46 & -0.155813 & -1.6997 & 0.045898 \tabularnewline
47 & -0.072924 & -0.7955 & 0.213951 \tabularnewline
48 & 0.397219 & 4.3331 & 1.5e-05 \tabularnewline
49 & -0.131228 & -1.4315 & 0.077449 \tabularnewline
50 & 0.096246 & 1.0499 & 0.147942 \tabularnewline
51 & -0.008665 & -0.0945 & 0.462424 \tabularnewline
52 & -0.239306 & -2.6105 & 0.005101 \tabularnewline
53 & 0.148846 & 1.6237 & 0.053541 \tabularnewline
54 & 0.072815 & 0.7943 & 0.214297 \tabularnewline
55 & -0.096247 & -1.0499 & 0.147938 \tabularnewline
56 & 0.050943 & 0.5557 & 0.28972 \tabularnewline
57 & -0.080111 & -0.8739 & 0.191965 \tabularnewline
58 & -0.130544 & -1.4241 & 0.078522 \tabularnewline
59 & -0.031902 & -0.348 & 0.364222 \tabularnewline
60 & 0.271935 & 2.9665 & 0.001821 \tabularnewline
\hline
\end{tabular}
%Source: https://freestatistics.org/blog/index.php?pk=78911&T=1

[TABLE]
[ROW][C]Autocorrelation Function[/C][/ROW]
[ROW][C]Time lag k[/C][C]ACF(k)[/C][C]T-STAT[/C][C]P-value[/C][/ROW]
[ROW][C]1[/C][C]-0.147632[/C][C]-1.6105[/C][C]0.054972[/C][/ROW]
[ROW][C]2[/C][C]-0.062282[/C][C]-0.6794[/C][C]0.249097[/C][/ROW]
[ROW][C]3[/C][C]-0.051983[/C][C]-0.5671[/C][C]0.285869[/C][/ROW]
[ROW][C]4[/C][C]-0.258773[/C][C]-2.8229[/C][C]0.00279[/C][/ROW]
[ROW][C]5[/C][C]-0.023128[/C][C]-0.2523[/C][C]0.400624[/C][/ROW]
[ROW][C]6[/C][C]0.179889[/C][C]1.9624[/C][C]0.026028[/C][/ROW]
[ROW][C]7[/C][C]-0.057384[/C][C]-0.626[/C][C]0.266262[/C][/ROW]
[ROW][C]8[/C][C]-0.158145[/C][C]-1.7252[/C][C]0.043547[/C][/ROW]
[ROW][C]9[/C][C]-0.051846[/C][C]-0.5656[/C][C]0.286375[/C][/ROW]
[ROW][C]10[/C][C]-0.099069[/C][C]-1.0807[/C][C]0.141004[/C][/ROW]
[ROW][C]11[/C][C]-0.141078[/C][C]-1.539[/C][C]0.063232[/C][/ROW]
[ROW][C]12[/C][C]0.80044[/C][C]8.7318[/C][C]0[/C][/ROW]
[ROW][C]13[/C][C]-0.147311[/C][C]-1.607[/C][C]0.055355[/C][/ROW]
[ROW][C]14[/C][C]0.006518[/C][C]0.0711[/C][C]0.471716[/C][/ROW]
[ROW][C]15[/C][C]-0.023163[/C][C]-0.2527[/C][C]0.400477[/C][/ROW]
[ROW][C]16[/C][C]-0.254227[/C][C]-2.7733[/C][C]0.003222[/C][/ROW]
[ROW][C]17[/C][C]0.029956[/C][C]0.3268[/C][C]0.372205[/C][/ROW]
[ROW][C]18[/C][C]0.160232[/C][C]1.7479[/C][C]0.041528[/C][/ROW]
[ROW][C]19[/C][C]-0.099597[/C][C]-1.0865[/C][C]0.139732[/C][/ROW]
[ROW][C]20[/C][C]-0.074618[/C][C]-0.814[/C][C]0.208639[/C][/ROW]
[ROW][C]21[/C][C]-0.066593[/C][C]-0.7264[/C][C]0.234497[/C][/ROW]
[ROW][C]22[/C][C]-0.133023[/C][C]-1.4511[/C][C]0.07469[/C][/ROW]
[ROW][C]23[/C][C]-0.122336[/C][C]-1.3345[/C][C]0.092289[/C][/ROW]
[ROW][C]24[/C][C]0.644308[/C][C]7.0286[/C][C]0[/C][/ROW]
[ROW][C]25[/C][C]-0.158152[/C][C]-1.7252[/C][C]0.04354[/C][/ROW]
[ROW][C]26[/C][C]0.079533[/C][C]0.8676[/C][C]0.193679[/C][/ROW]
[ROW][C]27[/C][C]-0.010508[/C][C]-0.1146[/C][C]0.454467[/C][/ROW]
[ROW][C]28[/C][C]-0.271951[/C][C]-2.9666[/C][C]0.00182[/C][/ROW]
[ROW][C]29[/C][C]0.077068[/C][C]0.8407[/C][C]0.201099[/C][/ROW]
[ROW][C]30[/C][C]0.120098[/C][C]1.3101[/C][C]0.096339[/C][/ROW]
[ROW][C]31[/C][C]-0.095568[/C][C]-1.0425[/C][C]0.14964[/C][/ROW]
[ROW][C]32[/C][C]-0.015512[/C][C]-0.1692[/C][C]0.432955[/C][/ROW]
[ROW][C]33[/C][C]-0.057804[/C][C]-0.6306[/C][C]0.264765[/C][/ROW]
[ROW][C]34[/C][C]-0.154186[/C][C]-1.682[/C][C]0.047598[/C][/ROW]
[ROW][C]35[/C][C]-0.114269[/C][C]-1.2465[/C][C]0.10751[/C][/ROW]
[ROW][C]36[/C][C]0.526961[/C][C]5.7485[/C][C]0[/C][/ROW]
[ROW][C]37[/C][C]-0.16493[/C][C]-1.7992[/C][C]0.037263[/C][/ROW]
[ROW][C]38[/C][C]0.092511[/C][C]1.0092[/C][C]0.15747[/C][/ROW]
[ROW][C]39[/C][C]0.01068[/C][C]0.1165[/C][C]0.453725[/C][/ROW]
[ROW][C]40[/C][C]-0.263905[/C][C]-2.8789[/C][C]0.002367[/C][/ROW]
[ROW][C]41[/C][C]0.123096[/C][C]1.3428[/C][C]0.090943[/C][/ROW]
[ROW][C]42[/C][C]0.082361[/C][C]0.8985[/C][C]0.185379[/C][/ROW]
[ROW][C]43[/C][C]-0.106062[/C][C]-1.157[/C][C]0.124796[/C][/ROW]
[ROW][C]44[/C][C]0.037607[/C][C]0.4102[/C][C]0.341182[/C][/ROW]
[ROW][C]45[/C][C]-0.063122[/C][C]-0.6886[/C][C]0.246214[/C][/ROW]
[ROW][C]46[/C][C]-0.155813[/C][C]-1.6997[/C][C]0.045898[/C][/ROW]
[ROW][C]47[/C][C]-0.072924[/C][C]-0.7955[/C][C]0.213951[/C][/ROW]
[ROW][C]48[/C][C]0.397219[/C][C]4.3331[/C][C]1.5e-05[/C][/ROW]
[ROW][C]49[/C][C]-0.131228[/C][C]-1.4315[/C][C]0.077449[/C][/ROW]
[ROW][C]50[/C][C]0.096246[/C][C]1.0499[/C][C]0.147942[/C][/ROW]
[ROW][C]51[/C][C]-0.008665[/C][C]-0.0945[/C][C]0.462424[/C][/ROW]
[ROW][C]52[/C][C]-0.239306[/C][C]-2.6105[/C][C]0.005101[/C][/ROW]
[ROW][C]53[/C][C]0.148846[/C][C]1.6237[/C][C]0.053541[/C][/ROW]
[ROW][C]54[/C][C]0.072815[/C][C]0.7943[/C][C]0.214297[/C][/ROW]
[ROW][C]55[/C][C]-0.096247[/C][C]-1.0499[/C][C]0.147938[/C][/ROW]
[ROW][C]56[/C][C]0.050943[/C][C]0.5557[/C][C]0.28972[/C][/ROW]
[ROW][C]57[/C][C]-0.080111[/C][C]-0.8739[/C][C]0.191965[/C][/ROW]
[ROW][C]58[/C][C]-0.130544[/C][C]-1.4241[/C][C]0.078522[/C][/ROW]
[ROW][C]59[/C][C]-0.031902[/C][C]-0.348[/C][C]0.364222[/C][/ROW]
[ROW][C]60[/C][C]0.271935[/C][C]2.9665[/C][C]0.001821[/C][/ROW]
[/TABLE]
Source: https://freestatistics.org/blog/index.php?pk=78911&T=1

Globally Unique Identifier (entire table): ba.freestatistics.org/blog/index.php?pk=78911&T=1

As an alternative you can also use a QR Code:  

The GUIDs for individual cells are displayed in the table below:

Autocorrelation Function
Time lag kACF(k)T-STATP-value
1-0.147632-1.61050.054972
2-0.062282-0.67940.249097
3-0.051983-0.56710.285869
4-0.258773-2.82290.00279
5-0.023128-0.25230.400624
60.1798891.96240.026028
7-0.057384-0.6260.266262
8-0.158145-1.72520.043547
9-0.051846-0.56560.286375
10-0.099069-1.08070.141004
11-0.141078-1.5390.063232
120.800448.73180
13-0.147311-1.6070.055355
140.0065180.07110.471716
15-0.023163-0.25270.400477
16-0.254227-2.77330.003222
170.0299560.32680.372205
180.1602321.74790.041528
19-0.099597-1.08650.139732
20-0.074618-0.8140.208639
21-0.066593-0.72640.234497
22-0.133023-1.45110.07469
23-0.122336-1.33450.092289
240.6443087.02860
25-0.158152-1.72520.04354
260.0795330.86760.193679
27-0.010508-0.11460.454467
28-0.271951-2.96660.00182
290.0770680.84070.201099
300.1200981.31010.096339
31-0.095568-1.04250.14964
32-0.015512-0.16920.432955
33-0.057804-0.63060.264765
34-0.154186-1.6820.047598
35-0.114269-1.24650.10751
360.5269615.74850
37-0.16493-1.79920.037263
380.0925111.00920.15747
390.010680.11650.453725
40-0.263905-2.87890.002367
410.1230961.34280.090943
420.0823610.89850.185379
43-0.106062-1.1570.124796
440.0376070.41020.341182
45-0.063122-0.68860.246214
46-0.155813-1.69970.045898
47-0.072924-0.79550.213951
480.3972194.33311.5e-05
49-0.131228-1.43150.077449
500.0962461.04990.147942
51-0.008665-0.09450.462424
52-0.239306-2.61050.005101
530.1488461.62370.053541
540.0728150.79430.214297
55-0.096247-1.04990.147938
560.0509430.55570.28972
57-0.080111-0.87390.191965
58-0.130544-1.42410.078522
59-0.031902-0.3480.364222
600.2719352.96650.001821


Partial Autocorrelation Function
Time lag kPACF(k)T-STATP-value
1-0.147632-1.61050.054972
2-0.08595-0.93760.175173
3-0.076888-0.83880.201645
4-0.295183-3.22010.000826
5-0.147821-1.61250.054747
60.101221.10420.13587
7-0.074179-0.80920.210008
8-0.29071-3.17130.000965
9-0.210939-2.30110.011564
10-0.172856-1.88560.030891
11-0.412509-4.49998e-06
120.6816277.43570
13-0.057132-0.62320.267161
140.0385670.42070.33736
150.0316530.34530.365243
160.1487821.6230.053616
170.0873350.95270.171334
180.03030.33050.37079
19-0.022809-0.24880.401965
200.0584090.63720.262622
210.002630.02870.488578
22-0.054207-0.59130.27771
23-0.029598-0.32290.373677
240.0295020.32180.374073
25-0.069846-0.76190.223804
260.0311610.33990.367256
27-0.01487-0.16220.435709
28-0.09275-1.01180.156848
29-0.007484-0.08160.467536
30-0.057629-0.62870.265388
310.0469350.5120.304799
32-0.082486-0.89980.185018
330.0552030.60220.274094
34-0.051156-0.5580.288932
35-0.028714-0.31320.377327
360.0360780.39360.347304
37-0.008555-0.09330.4629
38-0.130464-1.42320.078649
390.0240080.26190.396926
400.010280.11210.455449
410.0228360.24910.401854
42-0.060337-0.65820.255841
43-0.05174-0.56440.286766
440.0178580.19480.42294
45-0.009192-0.10030.46015
46-0.044905-0.48990.312568
470.0368260.40170.344303
48-0.060914-0.66450.253828
490.0622280.67880.249284
50-0.022086-0.24090.405011
51-0.063392-0.69150.245292
520.0070820.07730.469277
53-0.019663-0.21450.415261
540.0844510.92120.179392
55-0.003492-0.03810.48484
56-0.077028-0.84030.201219
57-0.04985-0.54380.293797
580.0912490.99540.16078
59-0.002494-0.02720.489172
60-0.097951-1.06850.143724

\begin{tabular}{lllllllll}
\hline
Partial Autocorrelation Function \tabularnewline
Time lag k & PACF(k) & T-STAT & P-value \tabularnewline
1 & -0.147632 & -1.6105 & 0.054972 \tabularnewline
2 & -0.08595 & -0.9376 & 0.175173 \tabularnewline
3 & -0.076888 & -0.8388 & 0.201645 \tabularnewline
4 & -0.295183 & -3.2201 & 0.000826 \tabularnewline
5 & -0.147821 & -1.6125 & 0.054747 \tabularnewline
6 & 0.10122 & 1.1042 & 0.13587 \tabularnewline
7 & -0.074179 & -0.8092 & 0.210008 \tabularnewline
8 & -0.29071 & -3.1713 & 0.000965 \tabularnewline
9 & -0.210939 & -2.3011 & 0.011564 \tabularnewline
10 & -0.172856 & -1.8856 & 0.030891 \tabularnewline
11 & -0.412509 & -4.4999 & 8e-06 \tabularnewline
12 & 0.681627 & 7.4357 & 0 \tabularnewline
13 & -0.057132 & -0.6232 & 0.267161 \tabularnewline
14 & 0.038567 & 0.4207 & 0.33736 \tabularnewline
15 & 0.031653 & 0.3453 & 0.365243 \tabularnewline
16 & 0.148782 & 1.623 & 0.053616 \tabularnewline
17 & 0.087335 & 0.9527 & 0.171334 \tabularnewline
18 & 0.0303 & 0.3305 & 0.37079 \tabularnewline
19 & -0.022809 & -0.2488 & 0.401965 \tabularnewline
20 & 0.058409 & 0.6372 & 0.262622 \tabularnewline
21 & 0.00263 & 0.0287 & 0.488578 \tabularnewline
22 & -0.054207 & -0.5913 & 0.27771 \tabularnewline
23 & -0.029598 & -0.3229 & 0.373677 \tabularnewline
24 & 0.029502 & 0.3218 & 0.374073 \tabularnewline
25 & -0.069846 & -0.7619 & 0.223804 \tabularnewline
26 & 0.031161 & 0.3399 & 0.367256 \tabularnewline
27 & -0.01487 & -0.1622 & 0.435709 \tabularnewline
28 & -0.09275 & -1.0118 & 0.156848 \tabularnewline
29 & -0.007484 & -0.0816 & 0.467536 \tabularnewline
30 & -0.057629 & -0.6287 & 0.265388 \tabularnewline
31 & 0.046935 & 0.512 & 0.304799 \tabularnewline
32 & -0.082486 & -0.8998 & 0.185018 \tabularnewline
33 & 0.055203 & 0.6022 & 0.274094 \tabularnewline
34 & -0.051156 & -0.558 & 0.288932 \tabularnewline
35 & -0.028714 & -0.3132 & 0.377327 \tabularnewline
36 & 0.036078 & 0.3936 & 0.347304 \tabularnewline
37 & -0.008555 & -0.0933 & 0.4629 \tabularnewline
38 & -0.130464 & -1.4232 & 0.078649 \tabularnewline
39 & 0.024008 & 0.2619 & 0.396926 \tabularnewline
40 & 0.01028 & 0.1121 & 0.455449 \tabularnewline
41 & 0.022836 & 0.2491 & 0.401854 \tabularnewline
42 & -0.060337 & -0.6582 & 0.255841 \tabularnewline
43 & -0.05174 & -0.5644 & 0.286766 \tabularnewline
44 & 0.017858 & 0.1948 & 0.42294 \tabularnewline
45 & -0.009192 & -0.1003 & 0.46015 \tabularnewline
46 & -0.044905 & -0.4899 & 0.312568 \tabularnewline
47 & 0.036826 & 0.4017 & 0.344303 \tabularnewline
48 & -0.060914 & -0.6645 & 0.253828 \tabularnewline
49 & 0.062228 & 0.6788 & 0.249284 \tabularnewline
50 & -0.022086 & -0.2409 & 0.405011 \tabularnewline
51 & -0.063392 & -0.6915 & 0.245292 \tabularnewline
52 & 0.007082 & 0.0773 & 0.469277 \tabularnewline
53 & -0.019663 & -0.2145 & 0.415261 \tabularnewline
54 & 0.084451 & 0.9212 & 0.179392 \tabularnewline
55 & -0.003492 & -0.0381 & 0.48484 \tabularnewline
56 & -0.077028 & -0.8403 & 0.201219 \tabularnewline
57 & -0.04985 & -0.5438 & 0.293797 \tabularnewline
58 & 0.091249 & 0.9954 & 0.16078 \tabularnewline
59 & -0.002494 & -0.0272 & 0.489172 \tabularnewline
60 & -0.097951 & -1.0685 & 0.143724 \tabularnewline
\hline
\end{tabular}
%Source: https://freestatistics.org/blog/index.php?pk=78911&T=2

[TABLE]
[ROW][C]Partial Autocorrelation Function[/C][/ROW]
[ROW][C]Time lag k[/C][C]PACF(k)[/C][C]T-STAT[/C][C]P-value[/C][/ROW]
[ROW][C]1[/C][C]-0.147632[/C][C]-1.6105[/C][C]0.054972[/C][/ROW]
[ROW][C]2[/C][C]-0.08595[/C][C]-0.9376[/C][C]0.175173[/C][/ROW]
[ROW][C]3[/C][C]-0.076888[/C][C]-0.8388[/C][C]0.201645[/C][/ROW]
[ROW][C]4[/C][C]-0.295183[/C][C]-3.2201[/C][C]0.000826[/C][/ROW]
[ROW][C]5[/C][C]-0.147821[/C][C]-1.6125[/C][C]0.054747[/C][/ROW]
[ROW][C]6[/C][C]0.10122[/C][C]1.1042[/C][C]0.13587[/C][/ROW]
[ROW][C]7[/C][C]-0.074179[/C][C]-0.8092[/C][C]0.210008[/C][/ROW]
[ROW][C]8[/C][C]-0.29071[/C][C]-3.1713[/C][C]0.000965[/C][/ROW]
[ROW][C]9[/C][C]-0.210939[/C][C]-2.3011[/C][C]0.011564[/C][/ROW]
[ROW][C]10[/C][C]-0.172856[/C][C]-1.8856[/C][C]0.030891[/C][/ROW]
[ROW][C]11[/C][C]-0.412509[/C][C]-4.4999[/C][C]8e-06[/C][/ROW]
[ROW][C]12[/C][C]0.681627[/C][C]7.4357[/C][C]0[/C][/ROW]
[ROW][C]13[/C][C]-0.057132[/C][C]-0.6232[/C][C]0.267161[/C][/ROW]
[ROW][C]14[/C][C]0.038567[/C][C]0.4207[/C][C]0.33736[/C][/ROW]
[ROW][C]15[/C][C]0.031653[/C][C]0.3453[/C][C]0.365243[/C][/ROW]
[ROW][C]16[/C][C]0.148782[/C][C]1.623[/C][C]0.053616[/C][/ROW]
[ROW][C]17[/C][C]0.087335[/C][C]0.9527[/C][C]0.171334[/C][/ROW]
[ROW][C]18[/C][C]0.0303[/C][C]0.3305[/C][C]0.37079[/C][/ROW]
[ROW][C]19[/C][C]-0.022809[/C][C]-0.2488[/C][C]0.401965[/C][/ROW]
[ROW][C]20[/C][C]0.058409[/C][C]0.6372[/C][C]0.262622[/C][/ROW]
[ROW][C]21[/C][C]0.00263[/C][C]0.0287[/C][C]0.488578[/C][/ROW]
[ROW][C]22[/C][C]-0.054207[/C][C]-0.5913[/C][C]0.27771[/C][/ROW]
[ROW][C]23[/C][C]-0.029598[/C][C]-0.3229[/C][C]0.373677[/C][/ROW]
[ROW][C]24[/C][C]0.029502[/C][C]0.3218[/C][C]0.374073[/C][/ROW]
[ROW][C]25[/C][C]-0.069846[/C][C]-0.7619[/C][C]0.223804[/C][/ROW]
[ROW][C]26[/C][C]0.031161[/C][C]0.3399[/C][C]0.367256[/C][/ROW]
[ROW][C]27[/C][C]-0.01487[/C][C]-0.1622[/C][C]0.435709[/C][/ROW]
[ROW][C]28[/C][C]-0.09275[/C][C]-1.0118[/C][C]0.156848[/C][/ROW]
[ROW][C]29[/C][C]-0.007484[/C][C]-0.0816[/C][C]0.467536[/C][/ROW]
[ROW][C]30[/C][C]-0.057629[/C][C]-0.6287[/C][C]0.265388[/C][/ROW]
[ROW][C]31[/C][C]0.046935[/C][C]0.512[/C][C]0.304799[/C][/ROW]
[ROW][C]32[/C][C]-0.082486[/C][C]-0.8998[/C][C]0.185018[/C][/ROW]
[ROW][C]33[/C][C]0.055203[/C][C]0.6022[/C][C]0.274094[/C][/ROW]
[ROW][C]34[/C][C]-0.051156[/C][C]-0.558[/C][C]0.288932[/C][/ROW]
[ROW][C]35[/C][C]-0.028714[/C][C]-0.3132[/C][C]0.377327[/C][/ROW]
[ROW][C]36[/C][C]0.036078[/C][C]0.3936[/C][C]0.347304[/C][/ROW]
[ROW][C]37[/C][C]-0.008555[/C][C]-0.0933[/C][C]0.4629[/C][/ROW]
[ROW][C]38[/C][C]-0.130464[/C][C]-1.4232[/C][C]0.078649[/C][/ROW]
[ROW][C]39[/C][C]0.024008[/C][C]0.2619[/C][C]0.396926[/C][/ROW]
[ROW][C]40[/C][C]0.01028[/C][C]0.1121[/C][C]0.455449[/C][/ROW]
[ROW][C]41[/C][C]0.022836[/C][C]0.2491[/C][C]0.401854[/C][/ROW]
[ROW][C]42[/C][C]-0.060337[/C][C]-0.6582[/C][C]0.255841[/C][/ROW]
[ROW][C]43[/C][C]-0.05174[/C][C]-0.5644[/C][C]0.286766[/C][/ROW]
[ROW][C]44[/C][C]0.017858[/C][C]0.1948[/C][C]0.42294[/C][/ROW]
[ROW][C]45[/C][C]-0.009192[/C][C]-0.1003[/C][C]0.46015[/C][/ROW]
[ROW][C]46[/C][C]-0.044905[/C][C]-0.4899[/C][C]0.312568[/C][/ROW]
[ROW][C]47[/C][C]0.036826[/C][C]0.4017[/C][C]0.344303[/C][/ROW]
[ROW][C]48[/C][C]-0.060914[/C][C]-0.6645[/C][C]0.253828[/C][/ROW]
[ROW][C]49[/C][C]0.062228[/C][C]0.6788[/C][C]0.249284[/C][/ROW]
[ROW][C]50[/C][C]-0.022086[/C][C]-0.2409[/C][C]0.405011[/C][/ROW]
[ROW][C]51[/C][C]-0.063392[/C][C]-0.6915[/C][C]0.245292[/C][/ROW]
[ROW][C]52[/C][C]0.007082[/C][C]0.0773[/C][C]0.469277[/C][/ROW]
[ROW][C]53[/C][C]-0.019663[/C][C]-0.2145[/C][C]0.415261[/C][/ROW]
[ROW][C]54[/C][C]0.084451[/C][C]0.9212[/C][C]0.179392[/C][/ROW]
[ROW][C]55[/C][C]-0.003492[/C][C]-0.0381[/C][C]0.48484[/C][/ROW]
[ROW][C]56[/C][C]-0.077028[/C][C]-0.8403[/C][C]0.201219[/C][/ROW]
[ROW][C]57[/C][C]-0.04985[/C][C]-0.5438[/C][C]0.293797[/C][/ROW]
[ROW][C]58[/C][C]0.091249[/C][C]0.9954[/C][C]0.16078[/C][/ROW]
[ROW][C]59[/C][C]-0.002494[/C][C]-0.0272[/C][C]0.489172[/C][/ROW]
[ROW][C]60[/C][C]-0.097951[/C][C]-1.0685[/C][C]0.143724[/C][/ROW]
[/TABLE]
Source: https://freestatistics.org/blog/index.php?pk=78911&T=2

Globally Unique Identifier (entire table): ba.freestatistics.org/blog/index.php?pk=78911&T=2

As an alternative you can also use a QR Code:  

The GUIDs for individual cells are displayed in the table below:

Partial Autocorrelation Function
Time lag kPACF(k)T-STATP-value
1-0.147632-1.61050.054972
2-0.08595-0.93760.175173
3-0.076888-0.83880.201645
4-0.295183-3.22010.000826
5-0.147821-1.61250.054747
60.101221.10420.13587
7-0.074179-0.80920.210008
8-0.29071-3.17130.000965
9-0.210939-2.30110.011564
10-0.172856-1.88560.030891
11-0.412509-4.49998e-06
120.6816277.43570
13-0.057132-0.62320.267161
140.0385670.42070.33736
150.0316530.34530.365243
160.1487821.6230.053616
170.0873350.95270.171334
180.03030.33050.37079
19-0.022809-0.24880.401965
200.0584090.63720.262622
210.002630.02870.488578
22-0.054207-0.59130.27771
23-0.029598-0.32290.373677
240.0295020.32180.374073
25-0.069846-0.76190.223804
260.0311610.33990.367256
27-0.01487-0.16220.435709
28-0.09275-1.01180.156848
29-0.007484-0.08160.467536
30-0.057629-0.62870.265388
310.0469350.5120.304799
32-0.082486-0.89980.185018
330.0552030.60220.274094
34-0.051156-0.5580.288932
35-0.028714-0.31320.377327
360.0360780.39360.347304
37-0.008555-0.09330.4629
38-0.130464-1.42320.078649
390.0240080.26190.396926
400.010280.11210.455449
410.0228360.24910.401854
42-0.060337-0.65820.255841
43-0.05174-0.56440.286766
440.0178580.19480.42294
45-0.009192-0.10030.46015
46-0.044905-0.48990.312568
470.0368260.40170.344303
48-0.060914-0.66450.253828
490.0622280.67880.249284
50-0.022086-0.24090.405011
51-0.063392-0.69150.245292
520.0070820.07730.469277
53-0.019663-0.21450.415261
540.0844510.92120.179392
55-0.003492-0.03810.48484
56-0.077028-0.84030.201219
57-0.04985-0.54380.293797
580.0912490.99540.16078
59-0.002494-0.02720.489172
60-0.097951-1.06850.143724


Parameters (Session):
par1 = 60 ; par2 = 1 ; par3 = 1 ; par4 = 0 ; par5 = 12 ; par6 = White Noise ; par7 = 0.95 ;
Parameters (R input):
par1 = 60 ; par2 = 1 ; par3 = 1 ; par4 = 0 ; par5 = 12 ; par6 = White Noise ; par7 = 0.95 ;
R code (references can be found in the software module):
if (par1 == 'Default') {
par1 = 10*log10(length(x))
} else {
par1 <- as.numeric(par1)
}
par2 <- as.numeric(par2)
par3 <- as.numeric(par3)
par4 <- as.numeric(par4)
par5 <- as.numeric(par5)
if (par6 == 'White Noise') par6 <- 'white' else par6 <- 'ma'
par7 <- as.numeric(par7)
if (par2 == 0) {
x <- log(x)
} else {
x <- (x ^ par2 - 1) / par2
}
if (par3 > 0) x <- diff(x,lag=1,difference=par3)
if (par4 > 0) x <- diff(x,lag=par5,difference=par4)
bitmap(file='pic1.png')
racf <- acf(x, par1, main='Autocorrelation', xlab='time lag', ylab='ACF', ci.type=par6, ci=par7, sub=paste('(lambda=',par2,', d=',par3,', D=',par4,', CI=', par7, ', CI type=',par6,')',sep=''))
dev.off()
bitmap(file='pic2.png')
rpacf <- pacf(x,par1,main='Partial Autocorrelation',xlab='lags',ylab='PACF')
dev.off()
(myacf <- c(racf$acf))
(mypacf <- c(rpacf$acf))
lengthx <- length(x)
sqrtn <- sqrt(lengthx)
load(file='createtable')
a<-table.start()
a<-table.row.start(a)
a<-table.element(a,'Autocorrelation Function',4,TRUE)
a<-table.row.end(a)
a<-table.row.start(a)
a<-table.element(a,'Time lag k',header=TRUE)
a<-table.element(a,hyperlink('basics.htm','ACF(k)','click here for more information about the Autocorrelation Function'),header=TRUE)
a<-table.element(a,'T-STAT',header=TRUE)
a<-table.element(a,'P-value',header=TRUE)
a<-table.row.end(a)
for (i in 2:(par1+1)) {
a<-table.row.start(a)
a<-table.element(a,i-1,header=TRUE)
a<-table.element(a,round(myacf[i],6))
mytstat <- myacf[i]*sqrtn
a<-table.element(a,round(mytstat,4))
a<-table.element(a,round(1-pt(abs(mytstat),lengthx),6))
a<-table.row.end(a)
}
a<-table.end(a)
table.save(a,file='mytable.tab')
a<-table.start()
a<-table.row.start(a)
a<-table.element(a,'Partial Autocorrelation Function',4,TRUE)
a<-table.row.end(a)
a<-table.row.start(a)
a<-table.element(a,'Time lag k',header=TRUE)
a<-table.element(a,hyperlink('basics.htm','PACF(k)','click here for more information about the Partial Autocorrelation Function'),header=TRUE)
a<-table.element(a,'T-STAT',header=TRUE)
a<-table.element(a,'P-value',header=TRUE)
a<-table.row.end(a)
for (i in 1:par1) {
a<-table.row.start(a)
a<-table.element(a,i,header=TRUE)
a<-table.element(a,round(mypacf[i],6))
mytstat <- mypacf[i]*sqrtn
a<-table.element(a,round(mytstat,4))
a<-table.element(a,round(1-pt(abs(mytstat),lengthx),6))
a<-table.row.end(a)
}
a<-table.end(a)
table.save(a,file='mytable1.tab')