Free Statistics

of Irreproducible Research!

Author's title

Author*Unverified author*
R Software Modulerwasp_notchedbox1.wasp
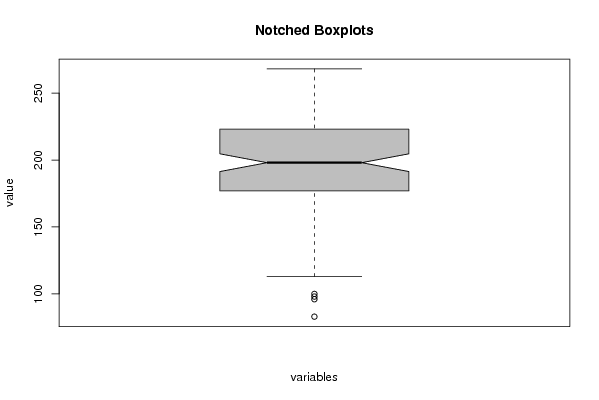
Title produced by softwareNotched Boxplots
Date of computationSun, 15 Aug 2010 17:00:48 +0000
Cite this page as followsStatistical Computations at FreeStatistics.org, Office for Research Development and Education, URL https://freestatistics.org/blog/index.php?v=date/2010/Aug/15/t12818919834oy8cwqw9ndti10.htm/, Retrieved Sun, 28 Apr 2024 05:49:48 +0000
Statistical Computations at FreeStatistics.org, Office for Research Development and Education, URL https://freestatistics.org/blog/index.php?pk=78903, Retrieved Sun, 28 Apr 2024 05:49:48 +0000
QR Codes:

Original text written by user:
IsPrivate?No (this computation is public)
User-defined keywordsDe Cock Nicola
Estimated Impact126
Family? (F = Feedback message, R = changed R code, M = changed R Module, P = changed Parameters, D = changed Data)
-       [Notched Boxplots] [TIJDREEKS A - STAP 9] [2010-08-15 17:00:48] [c2fbba04702f7f714f5f9c5d7ee07bac] [Current]
Feedback Forum

Post a new message
Dataseries X:
252
251
250
248
268
267
252
242
243
243
244
246
236
241
240
239
253
249
232
229
221
222
224
224
215
225
225
221
238
234
228
227
216
219
225
227
205
215
214
209
222
216
206
199
189
198
203
211
199
211
210
203
214
202
193
193
176
192
200
195
180
197
194
194
212
202
195
198
170
187
190
189
176
188
195
194
211
203
194
194
163
183
181
184
171
178
179
186
205
204
195
186
156
167
164
165
153
160
154
169
186
188
187
169
131
146
145
137
119
118
113
123
142
141
138
124
83
100
96
98


Summary of computational transaction
Raw Inputview raw input (R code)
Raw Outputview raw output of R engine
Computing time0 seconds
R Server'Gwilym Jenkins' @ 72.249.127.135

\begin{tabular}{lllllllll}
\hline
Summary of computational transaction \tabularnewline
Raw Input & view raw input (R code)  \tabularnewline
Raw Output & view raw output of R engine  \tabularnewline
Computing time & 0 seconds \tabularnewline
R Server & 'Gwilym Jenkins' @ 72.249.127.135 \tabularnewline
\hline
\end{tabular}
%Source: https://freestatistics.org/blog/index.php?pk=78903&T=0

[TABLE]
[ROW][C]Summary of computational transaction[/C][/ROW]
[ROW][C]Raw Input[/C][C]view raw input (R code) [/C][/ROW]
[ROW][C]Raw Output[/C][C]view raw output of R engine [/C][/ROW]
[ROW][C]Computing time[/C][C]0 seconds[/C][/ROW]
[ROW][C]R Server[/C][C]'Gwilym Jenkins' @ 72.249.127.135[/C][/ROW]
[/TABLE]
Source: https://freestatistics.org/blog/index.php?pk=78903&T=0

Globally Unique Identifier (entire table): ba.freestatistics.org/blog/index.php?pk=78903&T=0

As an alternative you can also use a QR Code:  

The GUIDs for individual cells are displayed in the table below:

Summary of computational transaction
Raw Inputview raw input (R code)
Raw Outputview raw output of R engine
Computing time0 seconds
R Server'Gwilym Jenkins' @ 72.249.127.135


\begin{tabular}{lllllllll}
\hline
Boxplot statistics \tabularnewline
Variable & lower whisker & lower hinge & median & upper hinge & upper whisker \tabularnewline
 & 113 & 177 & 198 & 223 & 268 \tabularnewline
\hline
\end{tabular}
%Source: https://freestatistics.org/blog/index.php?pk=78903&T=1

[TABLE]
[ROW][C]Boxplot statistics[/C][/ROW]
[ROW][C]Variable[/C][C]lower whisker[/C][C]lower hinge[/C][C]median[/C][C]upper hinge[/C][C]upper whisker[/C][/ROW]
[ROW][C][/C][C]113[/C][C]177[/C][C]198[/C][C]223[/C][C]268[/C][/ROW]
[/TABLE]
Source: https://freestatistics.org/blog/index.php?pk=78903&T=1

Globally Unique Identifier (entire table): ba.freestatistics.org/blog/index.php?pk=78903&T=1

As an alternative you can also use a QR Code:  

The GUIDs for individual cells are displayed in the table below:

Boxplot statistics
Variablelower whiskerlower hingemedianupper hingeupper whisker
113177198223268


Boxplot Notches
Variablelower boundmedianupper bound
191.365254086754198204.634745913246

\begin{tabular}{lllllllll}
\hline
Boxplot Notches \tabularnewline
Variable & lower bound & median & upper bound \tabularnewline
 & 191.365254086754 & 198 & 204.634745913246 \tabularnewline
\hline
\end{tabular}
%Source: https://freestatistics.org/blog/index.php?pk=78903&T=2

[TABLE]
[ROW][C]Boxplot Notches[/C][/ROW]
[ROW][C]Variable[/C][C]lower bound[/C][C]median[/C][C]upper bound[/C][/ROW]
[ROW][C][/C][C]191.365254086754[/C][C]198[/C][C]204.634745913246[/C][/ROW]
[/TABLE]
Source: https://freestatistics.org/blog/index.php?pk=78903&T=2

Globally Unique Identifier (entire table): ba.freestatistics.org/blog/index.php?pk=78903&T=2

As an alternative you can also use a QR Code:  

The GUIDs for individual cells are displayed in the table below:

Boxplot Notches
Variablelower boundmedianupper bound
191.365254086754198204.634745913246


Parameters (Session):
par1 = grey ;
Parameters (R input):
par1 = grey ;
R code (references can be found in the software module):
z <- as.data.frame(t(y))
bitmap(file='test1.png')
(r<-boxplot(z ,xlab=xlab,ylab=ylab,main=main,notch=TRUE,col=par1))
dev.off()
load(file='createtable')
a<-table.start()
a<-table.row.start(a)
a<-table.element(a,hyperlink('overview.htm','Boxplot statistics','Boxplot overview'),6,TRUE)
a<-table.row.end(a)
a<-table.row.start(a)
a<-table.element(a,'Variable',1,TRUE)
a<-table.element(a,hyperlink('lower_whisker.htm','lower whisker','definition of lower whisker'),1,TRUE)
a<-table.element(a,hyperlink('lower_hinge.htm','lower hinge','definition of lower hinge'),1,TRUE)
a<-table.element(a,hyperlink('central_tendency.htm','median','definitions about measures of central tendency'),1,TRUE)
a<-table.element(a,hyperlink('upper_hinge.htm','upper hinge','definition of upper hinge'),1,TRUE)
a<-table.element(a,hyperlink('upper_whisker.htm','upper whisker','definition of upper whisker'),1,TRUE)
a<-table.row.end(a)
for (i in 1:length(y[,1]))
{
a<-table.row.start(a)
a<-table.element(a,dimnames(t(x))[[2]][i],1,TRUE)
for (j in 1:5)
{
a<-table.element(a,r$stats[j,i])
}
a<-table.row.end(a)
}
a<-table.end(a)
table.save(a,file='mytable.tab')
a<-table.start()
a<-table.row.start(a)
a<-table.element(a,'Boxplot Notches',4,TRUE)
a<-table.row.end(a)
a<-table.row.start(a)
a<-table.element(a,'Variable',1,TRUE)
a<-table.element(a,'lower bound',1,TRUE)
a<-table.element(a,'median',1,TRUE)
a<-table.element(a,'upper bound',1,TRUE)
a<-table.row.end(a)
for (i in 1:length(y[,1]))
{
a<-table.row.start(a)
a<-table.element(a,dimnames(t(x))[[2]][i],1,TRUE)
a<-table.element(a,r$conf[1,i])
a<-table.element(a,r$stats[3,i])
a<-table.element(a,r$conf[2,i])
a<-table.row.end(a)
}
a<-table.end(a)
table.save(a,file='mytable1.tab')