Free Statistics

of Irreproducible Research!

Author's title

Author*Unverified author*
R Software Modulerwasp_smp.wasp
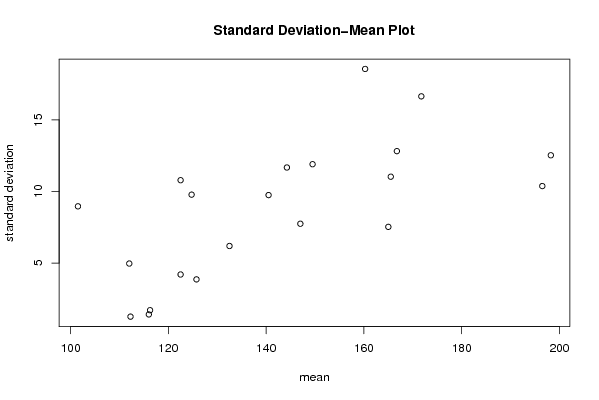
Title produced by softwareStandard Deviation-Mean Plot
Date of computationSun, 15 Aug 2010 16:06:10 +0000
Cite this page as followsStatistical Computations at FreeStatistics.org, Office for Research Development and Education, URL https://freestatistics.org/blog/index.php?v=date/2010/Aug/15/t128188834153swxt7oh7gobmt.htm/, Retrieved Sat, 27 Apr 2024 16:53:22 +0000
Statistical Computations at FreeStatistics.org, Office for Research Development and Education, URL https://freestatistics.org/blog/index.php?pk=78898, Retrieved Sat, 27 Apr 2024 16:53:22 +0000
QR Codes:

Original text written by user:
IsPrivate?No (this computation is public)
User-defined keywords
Estimated Impact128
Family? (F = Feedback message, R = changed R code, M = changed R Module, P = changed Parameters, D = changed Data)
-     [Mean Plot] [Mean vs Median pl...] [2010-08-15 15:07:22] [f5ecd041e4b32af12787a4e421b18aaf]
-   P   [Mean Plot] [Mean&Median Plot ...] [2010-08-15 15:22:42] [f5ecd041e4b32af12787a4e421b18aaf]
- RM        [Standard Deviation-Mean Plot] [SD Mean Plot omze...] [2010-08-15 16:06:10] [05b8da000f2ebbd12b039a4b088dd3f2] [Current]
Feedback Forum

Post a new message
Dataseries X:
118
117
116
114
112
111
112
114
115
115
116
118
126
131
122
124
119
112
109
108
117
122
127
124
129
141
127
133
114
98
93
101
111
128
126
134
140
158
144
146
138
119
113
120
127
141
144
150
156
174
163
167
160
141
132
144
155
164
162
181
187
209
189
201
193
177
159
158
155
164
163
185
191
217
193
192
184
166
145
146
138
149
145
166


Summary of computational transaction
Raw Inputview raw input (R code)
Raw Outputview raw output of R engine
Computing time1 seconds
R Server'George Udny Yule' @ 72.249.76.132

\begin{tabular}{lllllllll}
\hline
Summary of computational transaction \tabularnewline
Raw Input & view raw input (R code)  \tabularnewline
Raw Output & view raw output of R engine  \tabularnewline
Computing time & 1 seconds \tabularnewline
R Server & 'George Udny Yule' @ 72.249.76.132 \tabularnewline
\hline
\end{tabular}
%Source: https://freestatistics.org/blog/index.php?pk=78898&T=0

[TABLE]
[ROW][C]Summary of computational transaction[/C][/ROW]
[ROW][C]Raw Input[/C][C]view raw input (R code) [/C][/ROW]
[ROW][C]Raw Output[/C][C]view raw output of R engine [/C][/ROW]
[ROW][C]Computing time[/C][C]1 seconds[/C][/ROW]
[ROW][C]R Server[/C][C]'George Udny Yule' @ 72.249.76.132[/C][/ROW]
[/TABLE]
Source: https://freestatistics.org/blog/index.php?pk=78898&T=0

Globally Unique Identifier (entire table): ba.freestatistics.org/blog/index.php?pk=78898&T=0

As an alternative you can also use a QR Code:  

The GUIDs for individual cells are displayed in the table below:

Summary of computational transaction
Raw Inputview raw input (R code)
Raw Outputview raw output of R engine
Computing time1 seconds
R Server'George Udny Yule' @ 72.249.76.132


Standard Deviation-Mean Plot
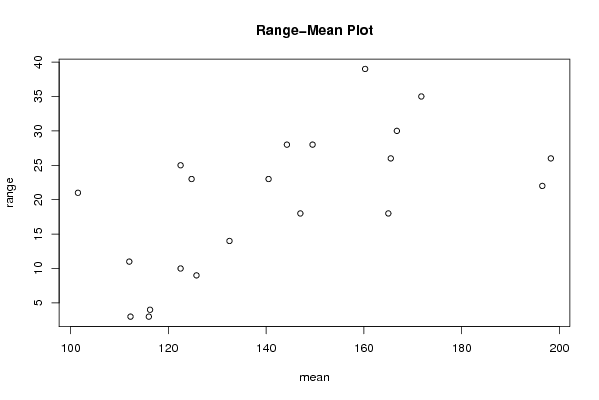
SectionMeanStandard DeviationRange
1116.251.707825127659934
2112.251.258305739211793
31161.414213562373103
4125.753.862210075418829
51124.9665548085837811
6122.54.2031734043061610
7132.56.191391873668914
8101.58.962886439832521
9124.759.7766729173749823
101477.7459666924148318
11122.510.785793124909025
12140.59.7467943448089623
131657.5277265270908118
14144.2511.672617529928828
15165.511.030261405182926
16196.510.376254944182322
17171.7516.640813281407535
18166.7512.816005617976330
19198.2512.526638282742426
20160.2518.553975315279539
21149.511.902380714238128

\begin{tabular}{lllllllll}
\hline
Standard Deviation-Mean Plot \tabularnewline
Section & Mean & Standard Deviation & Range \tabularnewline
1 & 116.25 & 1.70782512765993 & 4 \tabularnewline
2 & 112.25 & 1.25830573921179 & 3 \tabularnewline
3 & 116 & 1.41421356237310 & 3 \tabularnewline
4 & 125.75 & 3.86221007541882 & 9 \tabularnewline
5 & 112 & 4.96655480858378 & 11 \tabularnewline
6 & 122.5 & 4.20317340430616 & 10 \tabularnewline
7 & 132.5 & 6.1913918736689 & 14 \tabularnewline
8 & 101.5 & 8.9628864398325 & 21 \tabularnewline
9 & 124.75 & 9.77667291737498 & 23 \tabularnewline
10 & 147 & 7.74596669241483 & 18 \tabularnewline
11 & 122.5 & 10.7857931249090 & 25 \tabularnewline
12 & 140.5 & 9.74679434480896 & 23 \tabularnewline
13 & 165 & 7.52772652709081 & 18 \tabularnewline
14 & 144.25 & 11.6726175299288 & 28 \tabularnewline
15 & 165.5 & 11.0302614051829 & 26 \tabularnewline
16 & 196.5 & 10.3762549441823 & 22 \tabularnewline
17 & 171.75 & 16.6408132814075 & 35 \tabularnewline
18 & 166.75 & 12.8160056179763 & 30 \tabularnewline
19 & 198.25 & 12.5266382827424 & 26 \tabularnewline
20 & 160.25 & 18.5539753152795 & 39 \tabularnewline
21 & 149.5 & 11.9023807142381 & 28 \tabularnewline
\hline
\end{tabular}
%Source: https://freestatistics.org/blog/index.php?pk=78898&T=1

[TABLE]
[ROW][C]Standard Deviation-Mean Plot[/C][/ROW]
[ROW][C]Section[/C][C]Mean[/C][C]Standard Deviation[/C][C]Range[/C][/ROW]
[ROW][C]1[/C][C]116.25[/C][C]1.70782512765993[/C][C]4[/C][/ROW]
[ROW][C]2[/C][C]112.25[/C][C]1.25830573921179[/C][C]3[/C][/ROW]
[ROW][C]3[/C][C]116[/C][C]1.41421356237310[/C][C]3[/C][/ROW]
[ROW][C]4[/C][C]125.75[/C][C]3.86221007541882[/C][C]9[/C][/ROW]
[ROW][C]5[/C][C]112[/C][C]4.96655480858378[/C][C]11[/C][/ROW]
[ROW][C]6[/C][C]122.5[/C][C]4.20317340430616[/C][C]10[/C][/ROW]
[ROW][C]7[/C][C]132.5[/C][C]6.1913918736689[/C][C]14[/C][/ROW]
[ROW][C]8[/C][C]101.5[/C][C]8.9628864398325[/C][C]21[/C][/ROW]
[ROW][C]9[/C][C]124.75[/C][C]9.77667291737498[/C][C]23[/C][/ROW]
[ROW][C]10[/C][C]147[/C][C]7.74596669241483[/C][C]18[/C][/ROW]
[ROW][C]11[/C][C]122.5[/C][C]10.7857931249090[/C][C]25[/C][/ROW]
[ROW][C]12[/C][C]140.5[/C][C]9.74679434480896[/C][C]23[/C][/ROW]
[ROW][C]13[/C][C]165[/C][C]7.52772652709081[/C][C]18[/C][/ROW]
[ROW][C]14[/C][C]144.25[/C][C]11.6726175299288[/C][C]28[/C][/ROW]
[ROW][C]15[/C][C]165.5[/C][C]11.0302614051829[/C][C]26[/C][/ROW]
[ROW][C]16[/C][C]196.5[/C][C]10.3762549441823[/C][C]22[/C][/ROW]
[ROW][C]17[/C][C]171.75[/C][C]16.6408132814075[/C][C]35[/C][/ROW]
[ROW][C]18[/C][C]166.75[/C][C]12.8160056179763[/C][C]30[/C][/ROW]
[ROW][C]19[/C][C]198.25[/C][C]12.5266382827424[/C][C]26[/C][/ROW]
[ROW][C]20[/C][C]160.25[/C][C]18.5539753152795[/C][C]39[/C][/ROW]
[ROW][C]21[/C][C]149.5[/C][C]11.9023807142381[/C][C]28[/C][/ROW]
[/TABLE]
Source: https://freestatistics.org/blog/index.php?pk=78898&T=1

Globally Unique Identifier (entire table): ba.freestatistics.org/blog/index.php?pk=78898&T=1

As an alternative you can also use a QR Code:  

The GUIDs for individual cells are displayed in the table below:

Standard Deviation-Mean Plot
SectionMeanStandard DeviationRange
1116.251.707825127659934
2112.251.258305739211793
31161.414213562373103
4125.753.862210075418829
51124.9665548085837811
6122.54.2031734043061610
7132.56.191391873668914
8101.58.962886439832521
9124.759.7766729173749823
101477.7459666924148318
11122.510.785793124909025
12140.59.7467943448089623
131657.5277265270908118
14144.2511.672617529928828
15165.511.030261405182926
16196.510.376254944182322
17171.7516.640813281407535
18166.7512.816005617976330
19198.2512.526638282742426
20160.2518.553975315279539
21149.511.902380714238128


Regression: S.E.(k) = alpha + beta * Mean(k)
alpha-7.06729621273609
beta0.111017695677743
S.D.0.0299297588886578
T-STAT3.70927464169497
p-value0.00148794886760987

\begin{tabular}{lllllllll}
\hline
Regression: S.E.(k) = alpha + beta * Mean(k) \tabularnewline
alpha & -7.06729621273609 \tabularnewline
beta & 0.111017695677743 \tabularnewline
S.D. & 0.0299297588886578 \tabularnewline
T-STAT & 3.70927464169497 \tabularnewline
p-value & 0.00148794886760987 \tabularnewline
\hline
\end{tabular}
%Source: https://freestatistics.org/blog/index.php?pk=78898&T=2

[TABLE]
[ROW][C]Regression: S.E.(k) = alpha + beta * Mean(k)[/C][/ROW]
[ROW][C]alpha[/C][C]-7.06729621273609[/C][/ROW]
[ROW][C]beta[/C][C]0.111017695677743[/C][/ROW]
[ROW][C]S.D.[/C][C]0.0299297588886578[/C][/ROW]
[ROW][C]T-STAT[/C][C]3.70927464169497[/C][/ROW]
[ROW][C]p-value[/C][C]0.00148794886760987[/C][/ROW]
[/TABLE]
Source: https://freestatistics.org/blog/index.php?pk=78898&T=2

Globally Unique Identifier (entire table): ba.freestatistics.org/blog/index.php?pk=78898&T=2

As an alternative you can also use a QR Code:  

The GUIDs for individual cells are displayed in the table below:

Regression: S.E.(k) = alpha + beta * Mean(k)
alpha-7.06729621273609
beta0.111017695677743
S.D.0.0299297588886578
T-STAT3.70927464169497
p-value0.00148794886760987


Regression: ln S.E.(k) = alpha + beta * ln Mean(k)
alpha-10.8429663653601
beta2.58941668643878
S.D.0.721881586152709
T-STAT3.58703800749256
p-value0.00196555831927006
Lambda-1.58941668643878

\begin{tabular}{lllllllll}
\hline
Regression: ln S.E.(k) = alpha + beta * ln Mean(k) \tabularnewline
alpha & -10.8429663653601 \tabularnewline
beta & 2.58941668643878 \tabularnewline
S.D. & 0.721881586152709 \tabularnewline
T-STAT & 3.58703800749256 \tabularnewline
p-value & 0.00196555831927006 \tabularnewline
Lambda & -1.58941668643878 \tabularnewline
\hline
\end{tabular}
%Source: https://freestatistics.org/blog/index.php?pk=78898&T=3

[TABLE]
[ROW][C]Regression: ln S.E.(k) = alpha + beta * ln Mean(k)[/C][/ROW]
[ROW][C]alpha[/C][C]-10.8429663653601[/C][/ROW]
[ROW][C]beta[/C][C]2.58941668643878[/C][/ROW]
[ROW][C]S.D.[/C][C]0.721881586152709[/C][/ROW]
[ROW][C]T-STAT[/C][C]3.58703800749256[/C][/ROW]
[ROW][C]p-value[/C][C]0.00196555831927006[/C][/ROW]
[ROW][C]Lambda[/C][C]-1.58941668643878[/C][/ROW]
[/TABLE]
Source: https://freestatistics.org/blog/index.php?pk=78898&T=3

Globally Unique Identifier (entire table): ba.freestatistics.org/blog/index.php?pk=78898&T=3

As an alternative you can also use a QR Code:  

The GUIDs for individual cells are displayed in the table below:

Regression: ln S.E.(k) = alpha + beta * ln Mean(k)
alpha-10.8429663653601
beta2.58941668643878
S.D.0.721881586152709
T-STAT3.58703800749256
p-value0.00196555831927006
Lambda-1.58941668643878


Parameters (Session):
Parameters (R input):
par1 = 4 ;
R code (references can be found in the software module):
par1 <- as.numeric(par1)
(n <- length(x))
(np <- floor(n / par1))
arr <- array(NA,dim=c(par1,np))
j <- 0
k <- 1
for (i in 1:(np*par1))
{
j = j + 1
arr[j,k] <- x[i]
if (j == par1) {
j = 0
k=k+1
}
}
arr
arr.mean <- array(NA,dim=np)
arr.sd <- array(NA,dim=np)
arr.range <- array(NA,dim=np)
for (j in 1:np)
{
arr.mean[j] <- mean(arr[,j],na.rm=TRUE)
arr.sd[j] <- sd(arr[,j],na.rm=TRUE)
arr.range[j] <- max(arr[,j],na.rm=TRUE) - min(arr[,j],na.rm=TRUE)
}
arr.mean
arr.sd
arr.range
(lm1 <- lm(arr.sd~arr.mean))
(lnlm1 <- lm(log(arr.sd)~log(arr.mean)))
(lm2 <- lm(arr.range~arr.mean))
bitmap(file='test1.png')
plot(arr.mean,arr.sd,main='Standard Deviation-Mean Plot',xlab='mean',ylab='standard deviation')
dev.off()
bitmap(file='test2.png')
plot(arr.mean,arr.range,main='Range-Mean Plot',xlab='mean',ylab='range')
dev.off()
load(file='createtable')
a<-table.start()
a<-table.row.start(a)
a<-table.element(a,'Standard Deviation-Mean Plot',4,TRUE)
a<-table.row.end(a)
a<-table.row.start(a)
a<-table.element(a,'Section',header=TRUE)
a<-table.element(a,'Mean',header=TRUE)
a<-table.element(a,'Standard Deviation',header=TRUE)
a<-table.element(a,'Range',header=TRUE)
a<-table.row.end(a)
for (j in 1:np) {
a<-table.row.start(a)
a<-table.element(a,j,header=TRUE)
a<-table.element(a,arr.mean[j])
a<-table.element(a,arr.sd[j] )
a<-table.element(a,arr.range[j] )
a<-table.row.end(a)
}
a<-table.end(a)
table.save(a,file='mytable.tab')
a<-table.start()
a<-table.row.start(a)
a<-table.element(a,'Regression: S.E.(k) = alpha + beta * Mean(k)',2,TRUE)
a<-table.row.end(a)
a<-table.row.start(a)
a<-table.element(a,'alpha',header=TRUE)
a<-table.element(a,lm1$coefficients[[1]])
a<-table.row.end(a)
a<-table.row.start(a)
a<-table.element(a,'beta',header=TRUE)
a<-table.element(a,lm1$coefficients[[2]])
a<-table.row.end(a)
a<-table.row.start(a)
a<-table.element(a,'S.D.',header=TRUE)
a<-table.element(a,summary(lm1)$coefficients[2,2])
a<-table.row.end(a)
a<-table.row.start(a)
a<-table.element(a,'T-STAT',header=TRUE)
a<-table.element(a,summary(lm1)$coefficients[2,3])
a<-table.row.end(a)
a<-table.row.start(a)
a<-table.element(a,'p-value',header=TRUE)
a<-table.element(a,summary(lm1)$coefficients[2,4])
a<-table.row.end(a)
a<-table.end(a)
table.save(a,file='mytable1.tab')
a<-table.start()
a<-table.row.start(a)
a<-table.element(a,'Regression: ln S.E.(k) = alpha + beta * ln Mean(k)',2,TRUE)
a<-table.row.end(a)
a<-table.row.start(a)
a<-table.element(a,'alpha',header=TRUE)
a<-table.element(a,lnlm1$coefficients[[1]])
a<-table.row.end(a)
a<-table.row.start(a)
a<-table.element(a,'beta',header=TRUE)
a<-table.element(a,lnlm1$coefficients[[2]])
a<-table.row.end(a)
a<-table.row.start(a)
a<-table.element(a,'S.D.',header=TRUE)
a<-table.element(a,summary(lnlm1)$coefficients[2,2])
a<-table.row.end(a)
a<-table.row.start(a)
a<-table.element(a,'T-STAT',header=TRUE)
a<-table.element(a,summary(lnlm1)$coefficients[2,3])
a<-table.row.end(a)
a<-table.row.start(a)
a<-table.element(a,'p-value',header=TRUE)
a<-table.element(a,summary(lnlm1)$coefficients[2,4])
a<-table.row.end(a)
a<-table.row.start(a)
a<-table.element(a,'Lambda',header=TRUE)
a<-table.element(a,1-lnlm1$coefficients[[2]])
a<-table.row.end(a)
a<-table.end(a)
table.save(a,file='mytable2.tab')