Free Statistics

of Irreproducible Research!

Author's title

Author*Unverified author*
R Software Modulerwasp_autocorrelation.wasp
Title produced by software(Partial) Autocorrelation Function
Date of computationSun, 15 Aug 2010 15:33:35 +0000
Cite this page as followsStatistical Computations at FreeStatistics.org, Office for Research Development and Education, URL https://freestatistics.org/blog/index.php?v=date/2010/Aug/15/t1281886776foyu5msuvi8jdn7.htm/, Retrieved Sun, 28 Apr 2024 18:19:50 +0000
Statistical Computations at FreeStatistics.org, Office for Research Development and Education, URL https://freestatistics.org/blog/index.php?pk=78891, Retrieved Sun, 28 Apr 2024 18:19:50 +0000
QR Codes:

Original text written by user:
IsPrivate?No (this computation is public)
User-defined keywordsKalhöfer Pim
Estimated Impact133
Family? (F = Feedback message, R = changed R code, M = changed R Module, P = changed Parameters, D = changed Data)
-       [(Partial) Autocorrelation Function] [Tijdreeks A Stap 20] [2010-08-15 15:33:35] [06ce09a0492afa6d4f67026fd1b7902e] [Current]
Feedback Forum

Post a new message
Dataseries X:
349
348
347
345
365
364
349
339
340
340
341
343
341
343
341
335
355
357
337
325
336
338
337
328
326
327
319
310
320
322
303
292
303
315
311
307
308
312
309
310
309
304
287
275
290
298
294
286
294
292
287
281
280
271
264
259
271
279
279
273
286
286
280
277
269
255
252
245
257
267
261
258
271
262
258
253
236
228
235
226
231
235
227
222
233
221
218
220
204
196
208
190
191
194
179
162
179
176
168
170
153
142
155
136
136
144
135
114
135
132
123
123
103
97
113
108
111
121
111
97


Summary of computational transaction
Raw Inputview raw input (R code)
Raw Outputview raw output of R engine
Computing time1 seconds
R Server'Gwilym Jenkins' @ 72.249.127.135

\begin{tabular}{lllllllll}
\hline
Summary of computational transaction \tabularnewline
Raw Input & view raw input (R code)  \tabularnewline
Raw Output & view raw output of R engine  \tabularnewline
Computing time & 1 seconds \tabularnewline
R Server & 'Gwilym Jenkins' @ 72.249.127.135 \tabularnewline
\hline
\end{tabular}
%Source: https://freestatistics.org/blog/index.php?pk=78891&T=0

[TABLE]
[ROW][C]Summary of computational transaction[/C][/ROW]
[ROW][C]Raw Input[/C][C]view raw input (R code) [/C][/ROW]
[ROW][C]Raw Output[/C][C]view raw output of R engine [/C][/ROW]
[ROW][C]Computing time[/C][C]1 seconds[/C][/ROW]
[ROW][C]R Server[/C][C]'Gwilym Jenkins' @ 72.249.127.135[/C][/ROW]
[/TABLE]
Source: https://freestatistics.org/blog/index.php?pk=78891&T=0

Globally Unique Identifier (entire table): ba.freestatistics.org/blog/index.php?pk=78891&T=0

As an alternative you can also use a QR Code:  

The GUIDs for individual cells are displayed in the table below:

Summary of computational transaction
Raw Inputview raw input (R code)
Raw Outputview raw output of R engine
Computing time1 seconds
R Server'Gwilym Jenkins' @ 72.249.127.135


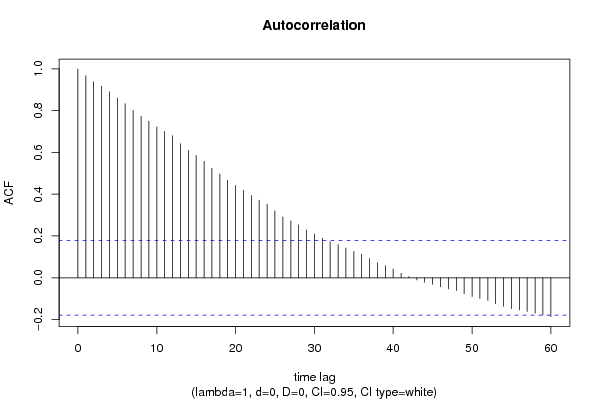
Autocorrelation Function
Time lag kACF(k)T-STATP-value
10.96713210.59440
20.93819410.27740
30.91731510.04870
40.8907519.75770
50.8603389.42450
60.8338569.13440
70.801078.77530
80.7732448.47050
90.7499438.21520
100.7224337.91390
110.7006597.67530
120.6800837.44990
130.6423427.03650
140.6096116.6780
150.585166.41010
160.5570846.10260
170.524295.74330
180.4973025.44770
190.4667235.11271e-06
200.4416134.83762e-06
210.4195494.59595e-06
220.3938624.31451.7e-05
230.3716264.0714.2e-05
240.3518143.85399.4e-05
250.3197383.50260.000324
260.2915193.19340.000898
270.2726612.98690.001709
280.2528072.76940.003255
290.2287752.50610.006773
300.209752.29770.011656
310.1890022.07040.020279
320.1729351.89440.030289
330.1596141.74850.041469
340.1421981.55770.060969
350.1258571.37870.085277
360.1126611.23410.109782
370.0915451.00280.158981
380.0715190.78350.217453
390.0571780.62640.266135
400.0413240.45270.325798
410.0220480.24150.404782
420.0057730.06320.474841
43-0.010191-0.11160.455649
44-0.02137-0.23410.407653
45-0.031239-0.34220.366396
46-0.042763-0.46840.32016
47-0.053725-0.58850.278642
48-0.061627-0.67510.250457
49-0.076313-0.8360.202419
50-0.089658-0.98220.163999
51-0.098776-1.0820.140704
52-0.108794-1.19180.11785
53-0.123943-1.35770.088548
54-0.137053-1.50130.067947
55-0.147917-1.62030.053892
56-0.154125-1.68840.04697
57-0.161057-1.76430.040113
58-0.169585-1.85770.03283
59-0.178402-1.95430.026496
60-0.186322-2.04110.021719

\begin{tabular}{lllllllll}
\hline
Autocorrelation Function \tabularnewline
Time lag k & ACF(k) & T-STAT & P-value \tabularnewline
1 & 0.967132 & 10.5944 & 0 \tabularnewline
2 & 0.938194 & 10.2774 & 0 \tabularnewline
3 & 0.917315 & 10.0487 & 0 \tabularnewline
4 & 0.890751 & 9.7577 & 0 \tabularnewline
5 & 0.860338 & 9.4245 & 0 \tabularnewline
6 & 0.833856 & 9.1344 & 0 \tabularnewline
7 & 0.80107 & 8.7753 & 0 \tabularnewline
8 & 0.773244 & 8.4705 & 0 \tabularnewline
9 & 0.749943 & 8.2152 & 0 \tabularnewline
10 & 0.722433 & 7.9139 & 0 \tabularnewline
11 & 0.700659 & 7.6753 & 0 \tabularnewline
12 & 0.680083 & 7.4499 & 0 \tabularnewline
13 & 0.642342 & 7.0365 & 0 \tabularnewline
14 & 0.609611 & 6.678 & 0 \tabularnewline
15 & 0.58516 & 6.4101 & 0 \tabularnewline
16 & 0.557084 & 6.1026 & 0 \tabularnewline
17 & 0.52429 & 5.7433 & 0 \tabularnewline
18 & 0.497302 & 5.4477 & 0 \tabularnewline
19 & 0.466723 & 5.1127 & 1e-06 \tabularnewline
20 & 0.441613 & 4.8376 & 2e-06 \tabularnewline
21 & 0.419549 & 4.5959 & 5e-06 \tabularnewline
22 & 0.393862 & 4.3145 & 1.7e-05 \tabularnewline
23 & 0.371626 & 4.071 & 4.2e-05 \tabularnewline
24 & 0.351814 & 3.8539 & 9.4e-05 \tabularnewline
25 & 0.319738 & 3.5026 & 0.000324 \tabularnewline
26 & 0.291519 & 3.1934 & 0.000898 \tabularnewline
27 & 0.272661 & 2.9869 & 0.001709 \tabularnewline
28 & 0.252807 & 2.7694 & 0.003255 \tabularnewline
29 & 0.228775 & 2.5061 & 0.006773 \tabularnewline
30 & 0.20975 & 2.2977 & 0.011656 \tabularnewline
31 & 0.189002 & 2.0704 & 0.020279 \tabularnewline
32 & 0.172935 & 1.8944 & 0.030289 \tabularnewline
33 & 0.159614 & 1.7485 & 0.041469 \tabularnewline
34 & 0.142198 & 1.5577 & 0.060969 \tabularnewline
35 & 0.125857 & 1.3787 & 0.085277 \tabularnewline
36 & 0.112661 & 1.2341 & 0.109782 \tabularnewline
37 & 0.091545 & 1.0028 & 0.158981 \tabularnewline
38 & 0.071519 & 0.7835 & 0.217453 \tabularnewline
39 & 0.057178 & 0.6264 & 0.266135 \tabularnewline
40 & 0.041324 & 0.4527 & 0.325798 \tabularnewline
41 & 0.022048 & 0.2415 & 0.404782 \tabularnewline
42 & 0.005773 & 0.0632 & 0.474841 \tabularnewline
43 & -0.010191 & -0.1116 & 0.455649 \tabularnewline
44 & -0.02137 & -0.2341 & 0.407653 \tabularnewline
45 & -0.031239 & -0.3422 & 0.366396 \tabularnewline
46 & -0.042763 & -0.4684 & 0.32016 \tabularnewline
47 & -0.053725 & -0.5885 & 0.278642 \tabularnewline
48 & -0.061627 & -0.6751 & 0.250457 \tabularnewline
49 & -0.076313 & -0.836 & 0.202419 \tabularnewline
50 & -0.089658 & -0.9822 & 0.163999 \tabularnewline
51 & -0.098776 & -1.082 & 0.140704 \tabularnewline
52 & -0.108794 & -1.1918 & 0.11785 \tabularnewline
53 & -0.123943 & -1.3577 & 0.088548 \tabularnewline
54 & -0.137053 & -1.5013 & 0.067947 \tabularnewline
55 & -0.147917 & -1.6203 & 0.053892 \tabularnewline
56 & -0.154125 & -1.6884 & 0.04697 \tabularnewline
57 & -0.161057 & -1.7643 & 0.040113 \tabularnewline
58 & -0.169585 & -1.8577 & 0.03283 \tabularnewline
59 & -0.178402 & -1.9543 & 0.026496 \tabularnewline
60 & -0.186322 & -2.0411 & 0.021719 \tabularnewline
\hline
\end{tabular}
%Source: https://freestatistics.org/blog/index.php?pk=78891&T=1

[TABLE]
[ROW][C]Autocorrelation Function[/C][/ROW]
[ROW][C]Time lag k[/C][C]ACF(k)[/C][C]T-STAT[/C][C]P-value[/C][/ROW]
[ROW][C]1[/C][C]0.967132[/C][C]10.5944[/C][C]0[/C][/ROW]
[ROW][C]2[/C][C]0.938194[/C][C]10.2774[/C][C]0[/C][/ROW]
[ROW][C]3[/C][C]0.917315[/C][C]10.0487[/C][C]0[/C][/ROW]
[ROW][C]4[/C][C]0.890751[/C][C]9.7577[/C][C]0[/C][/ROW]
[ROW][C]5[/C][C]0.860338[/C][C]9.4245[/C][C]0[/C][/ROW]
[ROW][C]6[/C][C]0.833856[/C][C]9.1344[/C][C]0[/C][/ROW]
[ROW][C]7[/C][C]0.80107[/C][C]8.7753[/C][C]0[/C][/ROW]
[ROW][C]8[/C][C]0.773244[/C][C]8.4705[/C][C]0[/C][/ROW]
[ROW][C]9[/C][C]0.749943[/C][C]8.2152[/C][C]0[/C][/ROW]
[ROW][C]10[/C][C]0.722433[/C][C]7.9139[/C][C]0[/C][/ROW]
[ROW][C]11[/C][C]0.700659[/C][C]7.6753[/C][C]0[/C][/ROW]
[ROW][C]12[/C][C]0.680083[/C][C]7.4499[/C][C]0[/C][/ROW]
[ROW][C]13[/C][C]0.642342[/C][C]7.0365[/C][C]0[/C][/ROW]
[ROW][C]14[/C][C]0.609611[/C][C]6.678[/C][C]0[/C][/ROW]
[ROW][C]15[/C][C]0.58516[/C][C]6.4101[/C][C]0[/C][/ROW]
[ROW][C]16[/C][C]0.557084[/C][C]6.1026[/C][C]0[/C][/ROW]
[ROW][C]17[/C][C]0.52429[/C][C]5.7433[/C][C]0[/C][/ROW]
[ROW][C]18[/C][C]0.497302[/C][C]5.4477[/C][C]0[/C][/ROW]
[ROW][C]19[/C][C]0.466723[/C][C]5.1127[/C][C]1e-06[/C][/ROW]
[ROW][C]20[/C][C]0.441613[/C][C]4.8376[/C][C]2e-06[/C][/ROW]
[ROW][C]21[/C][C]0.419549[/C][C]4.5959[/C][C]5e-06[/C][/ROW]
[ROW][C]22[/C][C]0.393862[/C][C]4.3145[/C][C]1.7e-05[/C][/ROW]
[ROW][C]23[/C][C]0.371626[/C][C]4.071[/C][C]4.2e-05[/C][/ROW]
[ROW][C]24[/C][C]0.351814[/C][C]3.8539[/C][C]9.4e-05[/C][/ROW]
[ROW][C]25[/C][C]0.319738[/C][C]3.5026[/C][C]0.000324[/C][/ROW]
[ROW][C]26[/C][C]0.291519[/C][C]3.1934[/C][C]0.000898[/C][/ROW]
[ROW][C]27[/C][C]0.272661[/C][C]2.9869[/C][C]0.001709[/C][/ROW]
[ROW][C]28[/C][C]0.252807[/C][C]2.7694[/C][C]0.003255[/C][/ROW]
[ROW][C]29[/C][C]0.228775[/C][C]2.5061[/C][C]0.006773[/C][/ROW]
[ROW][C]30[/C][C]0.20975[/C][C]2.2977[/C][C]0.011656[/C][/ROW]
[ROW][C]31[/C][C]0.189002[/C][C]2.0704[/C][C]0.020279[/C][/ROW]
[ROW][C]32[/C][C]0.172935[/C][C]1.8944[/C][C]0.030289[/C][/ROW]
[ROW][C]33[/C][C]0.159614[/C][C]1.7485[/C][C]0.041469[/C][/ROW]
[ROW][C]34[/C][C]0.142198[/C][C]1.5577[/C][C]0.060969[/C][/ROW]
[ROW][C]35[/C][C]0.125857[/C][C]1.3787[/C][C]0.085277[/C][/ROW]
[ROW][C]36[/C][C]0.112661[/C][C]1.2341[/C][C]0.109782[/C][/ROW]
[ROW][C]37[/C][C]0.091545[/C][C]1.0028[/C][C]0.158981[/C][/ROW]
[ROW][C]38[/C][C]0.071519[/C][C]0.7835[/C][C]0.217453[/C][/ROW]
[ROW][C]39[/C][C]0.057178[/C][C]0.6264[/C][C]0.266135[/C][/ROW]
[ROW][C]40[/C][C]0.041324[/C][C]0.4527[/C][C]0.325798[/C][/ROW]
[ROW][C]41[/C][C]0.022048[/C][C]0.2415[/C][C]0.404782[/C][/ROW]
[ROW][C]42[/C][C]0.005773[/C][C]0.0632[/C][C]0.474841[/C][/ROW]
[ROW][C]43[/C][C]-0.010191[/C][C]-0.1116[/C][C]0.455649[/C][/ROW]
[ROW][C]44[/C][C]-0.02137[/C][C]-0.2341[/C][C]0.407653[/C][/ROW]
[ROW][C]45[/C][C]-0.031239[/C][C]-0.3422[/C][C]0.366396[/C][/ROW]
[ROW][C]46[/C][C]-0.042763[/C][C]-0.4684[/C][C]0.32016[/C][/ROW]
[ROW][C]47[/C][C]-0.053725[/C][C]-0.5885[/C][C]0.278642[/C][/ROW]
[ROW][C]48[/C][C]-0.061627[/C][C]-0.6751[/C][C]0.250457[/C][/ROW]
[ROW][C]49[/C][C]-0.076313[/C][C]-0.836[/C][C]0.202419[/C][/ROW]
[ROW][C]50[/C][C]-0.089658[/C][C]-0.9822[/C][C]0.163999[/C][/ROW]
[ROW][C]51[/C][C]-0.098776[/C][C]-1.082[/C][C]0.140704[/C][/ROW]
[ROW][C]52[/C][C]-0.108794[/C][C]-1.1918[/C][C]0.11785[/C][/ROW]
[ROW][C]53[/C][C]-0.123943[/C][C]-1.3577[/C][C]0.088548[/C][/ROW]
[ROW][C]54[/C][C]-0.137053[/C][C]-1.5013[/C][C]0.067947[/C][/ROW]
[ROW][C]55[/C][C]-0.147917[/C][C]-1.6203[/C][C]0.053892[/C][/ROW]
[ROW][C]56[/C][C]-0.154125[/C][C]-1.6884[/C][C]0.04697[/C][/ROW]
[ROW][C]57[/C][C]-0.161057[/C][C]-1.7643[/C][C]0.040113[/C][/ROW]
[ROW][C]58[/C][C]-0.169585[/C][C]-1.8577[/C][C]0.03283[/C][/ROW]
[ROW][C]59[/C][C]-0.178402[/C][C]-1.9543[/C][C]0.026496[/C][/ROW]
[ROW][C]60[/C][C]-0.186322[/C][C]-2.0411[/C][C]0.021719[/C][/ROW]
[/TABLE]
Source: https://freestatistics.org/blog/index.php?pk=78891&T=1

Globally Unique Identifier (entire table): ba.freestatistics.org/blog/index.php?pk=78891&T=1

As an alternative you can also use a QR Code:  

The GUIDs for individual cells are displayed in the table below:

Autocorrelation Function
Time lag kACF(k)T-STATP-value
10.96713210.59440
20.93819410.27740
30.91731510.04870
40.8907519.75770
50.8603389.42450
60.8338569.13440
70.801078.77530
80.7732448.47050
90.7499438.21520
100.7224337.91390
110.7006597.67530
120.6800837.44990
130.6423427.03650
140.6096116.6780
150.585166.41010
160.5570846.10260
170.524295.74330
180.4973025.44770
190.4667235.11271e-06
200.4416134.83762e-06
210.4195494.59595e-06
220.3938624.31451.7e-05
230.3716264.0714.2e-05
240.3518143.85399.4e-05
250.3197383.50260.000324
260.2915193.19340.000898
270.2726612.98690.001709
280.2528072.76940.003255
290.2287752.50610.006773
300.209752.29770.011656
310.1890022.07040.020279
320.1729351.89440.030289
330.1596141.74850.041469
340.1421981.55770.060969
350.1258571.37870.085277
360.1126611.23410.109782
370.0915451.00280.158981
380.0715190.78350.217453
390.0571780.62640.266135
400.0413240.45270.325798
410.0220480.24150.404782
420.0057730.06320.474841
43-0.010191-0.11160.455649
44-0.02137-0.23410.407653
45-0.031239-0.34220.366396
46-0.042763-0.46840.32016
47-0.053725-0.58850.278642
48-0.061627-0.67510.250457
49-0.076313-0.8360.202419
50-0.089658-0.98220.163999
51-0.098776-1.0820.140704
52-0.108794-1.19180.11785
53-0.123943-1.35770.088548
54-0.137053-1.50130.067947
55-0.147917-1.62030.053892
56-0.154125-1.68840.04697
57-0.161057-1.76430.040113
58-0.169585-1.85770.03283
59-0.178402-1.95430.026496
60-0.186322-2.04110.021719


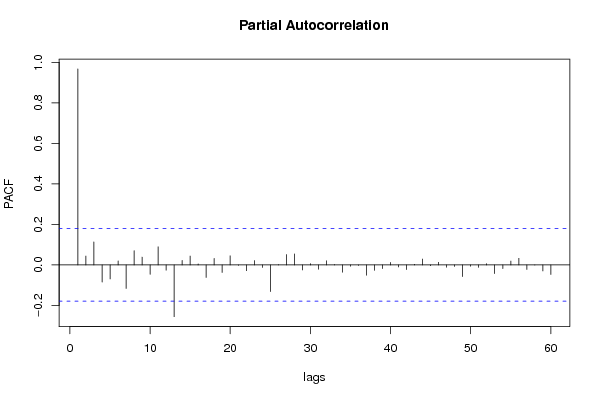
Partial Autocorrelation Function
Time lag kPACF(k)T-STATP-value
10.96713210.59440
20.0440740.48280.315057
30.1134771.24310.108131
4-0.084708-0.92790.177652
5-0.068884-0.75460.225989
60.0195890.21460.415225
7-0.116222-1.27310.102713
80.0703370.77050.221259
90.0385750.42260.336684
10-0.046096-0.5050.307258
110.089450.97990.16456
12-0.025641-0.28090.389642
13-0.255224-2.79580.003015
140.0224310.24570.403158
150.043530.47680.31717
160.0051110.0560.477721
17-0.06198-0.6790.249235
180.0320330.35090.363137
19-0.037064-0.4060.342728
200.0452650.49590.310451
21-0.00168-0.01840.492674
22-0.028584-0.31310.377367
230.0215280.23580.406983
24-0.012243-0.13410.446769
25-0.131425-1.43970.076279
260.0014120.01550.493842
270.0514190.56330.287153
280.0544370.59630.276039
29-0.024995-0.27380.392351
300.0064150.07030.472046
31-0.021306-0.23340.407927
320.0201680.22090.412763
330.0020460.02240.49108
34-0.035497-0.38880.349038
35-0.006451-0.07070.471891
36-0.002818-0.03090.487712
37-0.050367-0.55170.291077
38-0.026581-0.29120.385707
39-0.018034-0.19750.421866
400.0120570.13210.44757
41-0.009637-0.10560.458049
42-0.023024-0.25220.400654
430.0030110.0330.486872
440.0288380.31590.376312
45-0.003873-0.04240.483116
460.0130350.14280.443349
47-0.011004-0.12050.452126
48-0.007567-0.08290.467038
49-0.057688-0.63190.264315
50-0.006351-0.06960.472326
51-0.011911-0.13050.448203
520.0059090.06470.474248
53-0.042525-0.46580.321087
54-0.01817-0.1990.421281
550.0190650.20880.417461
560.0328090.35940.359964
57-0.022158-0.24270.404313
58-0.000636-0.0070.497227
59-0.029884-0.32740.371981
60-0.046783-0.51250.304629

\begin{tabular}{lllllllll}
\hline
Partial Autocorrelation Function \tabularnewline
Time lag k & PACF(k) & T-STAT & P-value \tabularnewline
1 & 0.967132 & 10.5944 & 0 \tabularnewline
2 & 0.044074 & 0.4828 & 0.315057 \tabularnewline
3 & 0.113477 & 1.2431 & 0.108131 \tabularnewline
4 & -0.084708 & -0.9279 & 0.177652 \tabularnewline
5 & -0.068884 & -0.7546 & 0.225989 \tabularnewline
6 & 0.019589 & 0.2146 & 0.415225 \tabularnewline
7 & -0.116222 & -1.2731 & 0.102713 \tabularnewline
8 & 0.070337 & 0.7705 & 0.221259 \tabularnewline
9 & 0.038575 & 0.4226 & 0.336684 \tabularnewline
10 & -0.046096 & -0.505 & 0.307258 \tabularnewline
11 & 0.08945 & 0.9799 & 0.16456 \tabularnewline
12 & -0.025641 & -0.2809 & 0.389642 \tabularnewline
13 & -0.255224 & -2.7958 & 0.003015 \tabularnewline
14 & 0.022431 & 0.2457 & 0.403158 \tabularnewline
15 & 0.04353 & 0.4768 & 0.31717 \tabularnewline
16 & 0.005111 & 0.056 & 0.477721 \tabularnewline
17 & -0.06198 & -0.679 & 0.249235 \tabularnewline
18 & 0.032033 & 0.3509 & 0.363137 \tabularnewline
19 & -0.037064 & -0.406 & 0.342728 \tabularnewline
20 & 0.045265 & 0.4959 & 0.310451 \tabularnewline
21 & -0.00168 & -0.0184 & 0.492674 \tabularnewline
22 & -0.028584 & -0.3131 & 0.377367 \tabularnewline
23 & 0.021528 & 0.2358 & 0.406983 \tabularnewline
24 & -0.012243 & -0.1341 & 0.446769 \tabularnewline
25 & -0.131425 & -1.4397 & 0.076279 \tabularnewline
26 & 0.001412 & 0.0155 & 0.493842 \tabularnewline
27 & 0.051419 & 0.5633 & 0.287153 \tabularnewline
28 & 0.054437 & 0.5963 & 0.276039 \tabularnewline
29 & -0.024995 & -0.2738 & 0.392351 \tabularnewline
30 & 0.006415 & 0.0703 & 0.472046 \tabularnewline
31 & -0.021306 & -0.2334 & 0.407927 \tabularnewline
32 & 0.020168 & 0.2209 & 0.412763 \tabularnewline
33 & 0.002046 & 0.0224 & 0.49108 \tabularnewline
34 & -0.035497 & -0.3888 & 0.349038 \tabularnewline
35 & -0.006451 & -0.0707 & 0.471891 \tabularnewline
36 & -0.002818 & -0.0309 & 0.487712 \tabularnewline
37 & -0.050367 & -0.5517 & 0.291077 \tabularnewline
38 & -0.026581 & -0.2912 & 0.385707 \tabularnewline
39 & -0.018034 & -0.1975 & 0.421866 \tabularnewline
40 & 0.012057 & 0.1321 & 0.44757 \tabularnewline
41 & -0.009637 & -0.1056 & 0.458049 \tabularnewline
42 & -0.023024 & -0.2522 & 0.400654 \tabularnewline
43 & 0.003011 & 0.033 & 0.486872 \tabularnewline
44 & 0.028838 & 0.3159 & 0.376312 \tabularnewline
45 & -0.003873 & -0.0424 & 0.483116 \tabularnewline
46 & 0.013035 & 0.1428 & 0.443349 \tabularnewline
47 & -0.011004 & -0.1205 & 0.452126 \tabularnewline
48 & -0.007567 & -0.0829 & 0.467038 \tabularnewline
49 & -0.057688 & -0.6319 & 0.264315 \tabularnewline
50 & -0.006351 & -0.0696 & 0.472326 \tabularnewline
51 & -0.011911 & -0.1305 & 0.448203 \tabularnewline
52 & 0.005909 & 0.0647 & 0.474248 \tabularnewline
53 & -0.042525 & -0.4658 & 0.321087 \tabularnewline
54 & -0.01817 & -0.199 & 0.421281 \tabularnewline
55 & 0.019065 & 0.2088 & 0.417461 \tabularnewline
56 & 0.032809 & 0.3594 & 0.359964 \tabularnewline
57 & -0.022158 & -0.2427 & 0.404313 \tabularnewline
58 & -0.000636 & -0.007 & 0.497227 \tabularnewline
59 & -0.029884 & -0.3274 & 0.371981 \tabularnewline
60 & -0.046783 & -0.5125 & 0.304629 \tabularnewline
\hline
\end{tabular}
%Source: https://freestatistics.org/blog/index.php?pk=78891&T=2

[TABLE]
[ROW][C]Partial Autocorrelation Function[/C][/ROW]
[ROW][C]Time lag k[/C][C]PACF(k)[/C][C]T-STAT[/C][C]P-value[/C][/ROW]
[ROW][C]1[/C][C]0.967132[/C][C]10.5944[/C][C]0[/C][/ROW]
[ROW][C]2[/C][C]0.044074[/C][C]0.4828[/C][C]0.315057[/C][/ROW]
[ROW][C]3[/C][C]0.113477[/C][C]1.2431[/C][C]0.108131[/C][/ROW]
[ROW][C]4[/C][C]-0.084708[/C][C]-0.9279[/C][C]0.177652[/C][/ROW]
[ROW][C]5[/C][C]-0.068884[/C][C]-0.7546[/C][C]0.225989[/C][/ROW]
[ROW][C]6[/C][C]0.019589[/C][C]0.2146[/C][C]0.415225[/C][/ROW]
[ROW][C]7[/C][C]-0.116222[/C][C]-1.2731[/C][C]0.102713[/C][/ROW]
[ROW][C]8[/C][C]0.070337[/C][C]0.7705[/C][C]0.221259[/C][/ROW]
[ROW][C]9[/C][C]0.038575[/C][C]0.4226[/C][C]0.336684[/C][/ROW]
[ROW][C]10[/C][C]-0.046096[/C][C]-0.505[/C][C]0.307258[/C][/ROW]
[ROW][C]11[/C][C]0.08945[/C][C]0.9799[/C][C]0.16456[/C][/ROW]
[ROW][C]12[/C][C]-0.025641[/C][C]-0.2809[/C][C]0.389642[/C][/ROW]
[ROW][C]13[/C][C]-0.255224[/C][C]-2.7958[/C][C]0.003015[/C][/ROW]
[ROW][C]14[/C][C]0.022431[/C][C]0.2457[/C][C]0.403158[/C][/ROW]
[ROW][C]15[/C][C]0.04353[/C][C]0.4768[/C][C]0.31717[/C][/ROW]
[ROW][C]16[/C][C]0.005111[/C][C]0.056[/C][C]0.477721[/C][/ROW]
[ROW][C]17[/C][C]-0.06198[/C][C]-0.679[/C][C]0.249235[/C][/ROW]
[ROW][C]18[/C][C]0.032033[/C][C]0.3509[/C][C]0.363137[/C][/ROW]
[ROW][C]19[/C][C]-0.037064[/C][C]-0.406[/C][C]0.342728[/C][/ROW]
[ROW][C]20[/C][C]0.045265[/C][C]0.4959[/C][C]0.310451[/C][/ROW]
[ROW][C]21[/C][C]-0.00168[/C][C]-0.0184[/C][C]0.492674[/C][/ROW]
[ROW][C]22[/C][C]-0.028584[/C][C]-0.3131[/C][C]0.377367[/C][/ROW]
[ROW][C]23[/C][C]0.021528[/C][C]0.2358[/C][C]0.406983[/C][/ROW]
[ROW][C]24[/C][C]-0.012243[/C][C]-0.1341[/C][C]0.446769[/C][/ROW]
[ROW][C]25[/C][C]-0.131425[/C][C]-1.4397[/C][C]0.076279[/C][/ROW]
[ROW][C]26[/C][C]0.001412[/C][C]0.0155[/C][C]0.493842[/C][/ROW]
[ROW][C]27[/C][C]0.051419[/C][C]0.5633[/C][C]0.287153[/C][/ROW]
[ROW][C]28[/C][C]0.054437[/C][C]0.5963[/C][C]0.276039[/C][/ROW]
[ROW][C]29[/C][C]-0.024995[/C][C]-0.2738[/C][C]0.392351[/C][/ROW]
[ROW][C]30[/C][C]0.006415[/C][C]0.0703[/C][C]0.472046[/C][/ROW]
[ROW][C]31[/C][C]-0.021306[/C][C]-0.2334[/C][C]0.407927[/C][/ROW]
[ROW][C]32[/C][C]0.020168[/C][C]0.2209[/C][C]0.412763[/C][/ROW]
[ROW][C]33[/C][C]0.002046[/C][C]0.0224[/C][C]0.49108[/C][/ROW]
[ROW][C]34[/C][C]-0.035497[/C][C]-0.3888[/C][C]0.349038[/C][/ROW]
[ROW][C]35[/C][C]-0.006451[/C][C]-0.0707[/C][C]0.471891[/C][/ROW]
[ROW][C]36[/C][C]-0.002818[/C][C]-0.0309[/C][C]0.487712[/C][/ROW]
[ROW][C]37[/C][C]-0.050367[/C][C]-0.5517[/C][C]0.291077[/C][/ROW]
[ROW][C]38[/C][C]-0.026581[/C][C]-0.2912[/C][C]0.385707[/C][/ROW]
[ROW][C]39[/C][C]-0.018034[/C][C]-0.1975[/C][C]0.421866[/C][/ROW]
[ROW][C]40[/C][C]0.012057[/C][C]0.1321[/C][C]0.44757[/C][/ROW]
[ROW][C]41[/C][C]-0.009637[/C][C]-0.1056[/C][C]0.458049[/C][/ROW]
[ROW][C]42[/C][C]-0.023024[/C][C]-0.2522[/C][C]0.400654[/C][/ROW]
[ROW][C]43[/C][C]0.003011[/C][C]0.033[/C][C]0.486872[/C][/ROW]
[ROW][C]44[/C][C]0.028838[/C][C]0.3159[/C][C]0.376312[/C][/ROW]
[ROW][C]45[/C][C]-0.003873[/C][C]-0.0424[/C][C]0.483116[/C][/ROW]
[ROW][C]46[/C][C]0.013035[/C][C]0.1428[/C][C]0.443349[/C][/ROW]
[ROW][C]47[/C][C]-0.011004[/C][C]-0.1205[/C][C]0.452126[/C][/ROW]
[ROW][C]48[/C][C]-0.007567[/C][C]-0.0829[/C][C]0.467038[/C][/ROW]
[ROW][C]49[/C][C]-0.057688[/C][C]-0.6319[/C][C]0.264315[/C][/ROW]
[ROW][C]50[/C][C]-0.006351[/C][C]-0.0696[/C][C]0.472326[/C][/ROW]
[ROW][C]51[/C][C]-0.011911[/C][C]-0.1305[/C][C]0.448203[/C][/ROW]
[ROW][C]52[/C][C]0.005909[/C][C]0.0647[/C][C]0.474248[/C][/ROW]
[ROW][C]53[/C][C]-0.042525[/C][C]-0.4658[/C][C]0.321087[/C][/ROW]
[ROW][C]54[/C][C]-0.01817[/C][C]-0.199[/C][C]0.421281[/C][/ROW]
[ROW][C]55[/C][C]0.019065[/C][C]0.2088[/C][C]0.417461[/C][/ROW]
[ROW][C]56[/C][C]0.032809[/C][C]0.3594[/C][C]0.359964[/C][/ROW]
[ROW][C]57[/C][C]-0.022158[/C][C]-0.2427[/C][C]0.404313[/C][/ROW]
[ROW][C]58[/C][C]-0.000636[/C][C]-0.007[/C][C]0.497227[/C][/ROW]
[ROW][C]59[/C][C]-0.029884[/C][C]-0.3274[/C][C]0.371981[/C][/ROW]
[ROW][C]60[/C][C]-0.046783[/C][C]-0.5125[/C][C]0.304629[/C][/ROW]
[/TABLE]
Source: https://freestatistics.org/blog/index.php?pk=78891&T=2

Globally Unique Identifier (entire table): ba.freestatistics.org/blog/index.php?pk=78891&T=2

As an alternative you can also use a QR Code:  

The GUIDs for individual cells are displayed in the table below:

Partial Autocorrelation Function
Time lag kPACF(k)T-STATP-value
10.96713210.59440
20.0440740.48280.315057
30.1134771.24310.108131
4-0.084708-0.92790.177652
5-0.068884-0.75460.225989
60.0195890.21460.415225
7-0.116222-1.27310.102713
80.0703370.77050.221259
90.0385750.42260.336684
10-0.046096-0.5050.307258
110.089450.97990.16456
12-0.025641-0.28090.389642
13-0.255224-2.79580.003015
140.0224310.24570.403158
150.043530.47680.31717
160.0051110.0560.477721
17-0.06198-0.6790.249235
180.0320330.35090.363137
19-0.037064-0.4060.342728
200.0452650.49590.310451
21-0.00168-0.01840.492674
22-0.028584-0.31310.377367
230.0215280.23580.406983
24-0.012243-0.13410.446769
25-0.131425-1.43970.076279
260.0014120.01550.493842
270.0514190.56330.287153
280.0544370.59630.276039
29-0.024995-0.27380.392351
300.0064150.07030.472046
31-0.021306-0.23340.407927
320.0201680.22090.412763
330.0020460.02240.49108
34-0.035497-0.38880.349038
35-0.006451-0.07070.471891
36-0.002818-0.03090.487712
37-0.050367-0.55170.291077
38-0.026581-0.29120.385707
39-0.018034-0.19750.421866
400.0120570.13210.44757
41-0.009637-0.10560.458049
42-0.023024-0.25220.400654
430.0030110.0330.486872
440.0288380.31590.376312
45-0.003873-0.04240.483116
460.0130350.14280.443349
47-0.011004-0.12050.452126
48-0.007567-0.08290.467038
49-0.057688-0.63190.264315
50-0.006351-0.06960.472326
51-0.011911-0.13050.448203
520.0059090.06470.474248
53-0.042525-0.46580.321087
54-0.01817-0.1990.421281
550.0190650.20880.417461
560.0328090.35940.359964
57-0.022158-0.24270.404313
58-0.000636-0.0070.497227
59-0.029884-0.32740.371981
60-0.046783-0.51250.304629


Parameters (Session):
par1 = 60 ; par2 = 1 ; par3 = 0 ; par4 = 0 ; par5 = 12 ; par6 = White Noise ; par7 = 0.95 ;
Parameters (R input):
par1 = 60 ; par2 = 1 ; par3 = 0 ; par4 = 0 ; par5 = 12 ; par6 = White Noise ; par7 = 0.95 ;
R code (references can be found in the software module):
if (par1 == 'Default') {
par1 = 10*log10(length(x))
} else {
par1 <- as.numeric(par1)
}
par2 <- as.numeric(par2)
par3 <- as.numeric(par3)
par4 <- as.numeric(par4)
par5 <- as.numeric(par5)
if (par6 == 'White Noise') par6 <- 'white' else par6 <- 'ma'
par7 <- as.numeric(par7)
if (par2 == 0) {
x <- log(x)
} else {
x <- (x ^ par2 - 1) / par2
}
if (par3 > 0) x <- diff(x,lag=1,difference=par3)
if (par4 > 0) x <- diff(x,lag=par5,difference=par4)
bitmap(file='pic1.png')
racf <- acf(x, par1, main='Autocorrelation', xlab='time lag', ylab='ACF', ci.type=par6, ci=par7, sub=paste('(lambda=',par2,', d=',par3,', D=',par4,', CI=', par7, ', CI type=',par6,')',sep=''))
dev.off()
bitmap(file='pic2.png')
rpacf <- pacf(x,par1,main='Partial Autocorrelation',xlab='lags',ylab='PACF')
dev.off()
(myacf <- c(racf$acf))
(mypacf <- c(rpacf$acf))
lengthx <- length(x)
sqrtn <- sqrt(lengthx)
load(file='createtable')
a<-table.start()
a<-table.row.start(a)
a<-table.element(a,'Autocorrelation Function',4,TRUE)
a<-table.row.end(a)
a<-table.row.start(a)
a<-table.element(a,'Time lag k',header=TRUE)
a<-table.element(a,hyperlink('basics.htm','ACF(k)','click here for more information about the Autocorrelation Function'),header=TRUE)
a<-table.element(a,'T-STAT',header=TRUE)
a<-table.element(a,'P-value',header=TRUE)
a<-table.row.end(a)
for (i in 2:(par1+1)) {
a<-table.row.start(a)
a<-table.element(a,i-1,header=TRUE)
a<-table.element(a,round(myacf[i],6))
mytstat <- myacf[i]*sqrtn
a<-table.element(a,round(mytstat,4))
a<-table.element(a,round(1-pt(abs(mytstat),lengthx),6))
a<-table.row.end(a)
}
a<-table.end(a)
table.save(a,file='mytable.tab')
a<-table.start()
a<-table.row.start(a)
a<-table.element(a,'Partial Autocorrelation Function',4,TRUE)
a<-table.row.end(a)
a<-table.row.start(a)
a<-table.element(a,'Time lag k',header=TRUE)
a<-table.element(a,hyperlink('basics.htm','PACF(k)','click here for more information about the Partial Autocorrelation Function'),header=TRUE)
a<-table.element(a,'T-STAT',header=TRUE)
a<-table.element(a,'P-value',header=TRUE)
a<-table.row.end(a)
for (i in 1:par1) {
a<-table.row.start(a)
a<-table.element(a,i,header=TRUE)
a<-table.element(a,round(mypacf[i],6))
mytstat <- mypacf[i]*sqrtn
a<-table.element(a,round(mytstat,4))
a<-table.element(a,round(1-pt(abs(mytstat),lengthx),6))
a<-table.row.end(a)
}
a<-table.end(a)
table.save(a,file='mytable1.tab')