Free Statistics

of Irreproducible Research!

Author's title

Author*Unverified author*
R Software Modulerwasp_smp.wasp
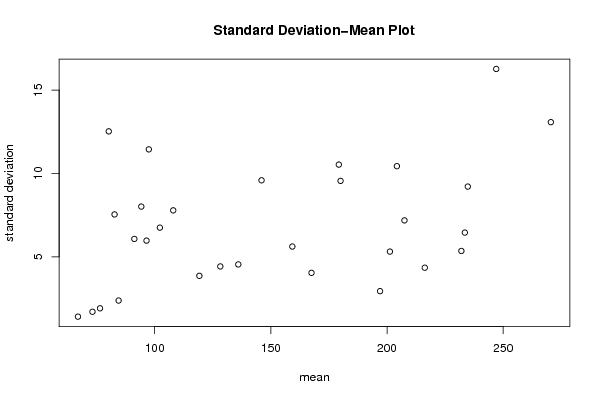
Title produced by softwareStandard Deviation-Mean Plot
Date of computationSun, 15 Aug 2010 13:14:31 +0000
Cite this page as followsStatistical Computations at FreeStatistics.org, Office for Research Development and Education, URL https://freestatistics.org/blog/index.php?v=date/2010/Aug/15/t1281878060j0z4dcpj5to9ta3.htm/, Retrieved Sun, 28 Apr 2024 16:25:00 +0000
Statistical Computations at FreeStatistics.org, Office for Research Development and Education, URL https://freestatistics.org/blog/index.php?pk=78858, Retrieved Sun, 28 Apr 2024 16:25:00 +0000
QR Codes:

Original text written by user:
IsPrivate?No (this computation is public)
User-defined keywordsSebastien Delforge
Estimated Impact165
Family? (F = Feedback message, R = changed R code, M = changed R Module, P = changed Parameters, D = changed Data)
-       [Standard Deviation-Mean Plot] [Standard Deviatio...] [2010-08-15 13:14:31] [923770d86edf74ed976a539eae527e37] [Current]
Feedback Forum

Post a new message
Dataseries X:
75
74
73
71
91
90
75
65
66
66
67
69
75
79
75
77
100
100
94
83
83
83
84
88
89
98
94
84
111
98
98
83
79
78
80
94
98
104
94
90
115
104
114
99
96
98
104
111
117
125
117
118
151
145
155
133
124
125
131
133
136
141
130
137
177
183
191
166
156
153
164
164
168
173
164
165
205
207
215
190
169
175
188
188
196
201
194
197
237
236
244
222
195
199
207
204
212
222
214
217
258
256
251
223
198
206
214
212
227
238
228
235
275
278
278
251
225
232
238
239


Summary of computational transaction
Raw Inputview raw input (R code)
Raw Outputview raw output of R engine
Computing time2 seconds
R Server'RServer@AstonUniversity' @ vre.aston.ac.uk

\begin{tabular}{lllllllll}
\hline
Summary of computational transaction \tabularnewline
Raw Input & view raw input (R code)  \tabularnewline
Raw Output & view raw output of R engine  \tabularnewline
Computing time & 2 seconds \tabularnewline
R Server & 'RServer@AstonUniversity' @ vre.aston.ac.uk \tabularnewline
\hline
\end{tabular}
%Source: https://freestatistics.org/blog/index.php?pk=78858&T=0

[TABLE]
[ROW][C]Summary of computational transaction[/C][/ROW]
[ROW][C]Raw Input[/C][C]view raw input (R code) [/C][/ROW]
[ROW][C]Raw Output[/C][C]view raw output of R engine [/C][/ROW]
[ROW][C]Computing time[/C][C]2 seconds[/C][/ROW]
[ROW][C]R Server[/C][C]'RServer@AstonUniversity' @ vre.aston.ac.uk[/C][/ROW]
[/TABLE]
Source: https://freestatistics.org/blog/index.php?pk=78858&T=0

Globally Unique Identifier (entire table): ba.freestatistics.org/blog/index.php?pk=78858&T=0

As an alternative you can also use a QR Code:  

The GUIDs for individual cells are displayed in the table below:

Summary of computational transaction
Raw Inputview raw input (R code)
Raw Outputview raw output of R engine
Computing time2 seconds
R Server'RServer@AstonUniversity' @ vre.aston.ac.uk


Standard Deviation-Mean Plot
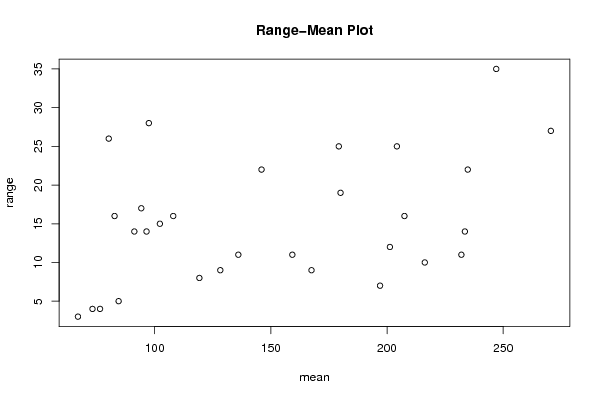
SectionMeanStandard DeviationRange
173.251.707825127659934
280.2512.526638282742426
3671.41421356237313
476.51.914854215512684
594.258.015609770940717
684.52.380476142847625
791.256.0759087111860614
897.511.445523142259628
982.757.5443135318375216
1096.55.9721576223896414
111087.7888809636986116
12102.256.751543033509715
13119.253.862210075418828
141469.5916630466254422
15128.254.425306015783929
161364.5460605656619511
17179.2510.531698185319725
18159.255.6199051000291211
19167.54.041451884327389
20204.2510.436314802968825
211809.5568474578876319
221972.943920288775957
23234.759.2150239645193922
24201.255.3150729063673212
25216.254.349329450233310
2624716.268579122549935
27207.57.1879528842826116
282325.3541261347363411
29270.513.07669683062227
30233.56.4549722436790314

\begin{tabular}{lllllllll}
\hline
Standard Deviation-Mean Plot \tabularnewline
Section & Mean & Standard Deviation & Range \tabularnewline
1 & 73.25 & 1.70782512765993 & 4 \tabularnewline
2 & 80.25 & 12.5266382827424 & 26 \tabularnewline
3 & 67 & 1.4142135623731 & 3 \tabularnewline
4 & 76.5 & 1.91485421551268 & 4 \tabularnewline
5 & 94.25 & 8.0156097709407 & 17 \tabularnewline
6 & 84.5 & 2.38047614284762 & 5 \tabularnewline
7 & 91.25 & 6.07590871118606 & 14 \tabularnewline
8 & 97.5 & 11.4455231422596 & 28 \tabularnewline
9 & 82.75 & 7.54431353183752 & 16 \tabularnewline
10 & 96.5 & 5.97215762238964 & 14 \tabularnewline
11 & 108 & 7.78888096369861 & 16 \tabularnewline
12 & 102.25 & 6.7515430335097 & 15 \tabularnewline
13 & 119.25 & 3.86221007541882 & 8 \tabularnewline
14 & 146 & 9.59166304662544 & 22 \tabularnewline
15 & 128.25 & 4.42530601578392 & 9 \tabularnewline
16 & 136 & 4.54606056566195 & 11 \tabularnewline
17 & 179.25 & 10.5316981853197 & 25 \tabularnewline
18 & 159.25 & 5.61990510002912 & 11 \tabularnewline
19 & 167.5 & 4.04145188432738 & 9 \tabularnewline
20 & 204.25 & 10.4363148029688 & 25 \tabularnewline
21 & 180 & 9.55684745788763 & 19 \tabularnewline
22 & 197 & 2.94392028877595 & 7 \tabularnewline
23 & 234.75 & 9.21502396451939 & 22 \tabularnewline
24 & 201.25 & 5.31507290636732 & 12 \tabularnewline
25 & 216.25 & 4.3493294502333 & 10 \tabularnewline
26 & 247 & 16.2685791225499 & 35 \tabularnewline
27 & 207.5 & 7.18795288428261 & 16 \tabularnewline
28 & 232 & 5.35412613473634 & 11 \tabularnewline
29 & 270.5 & 13.076696830622 & 27 \tabularnewline
30 & 233.5 & 6.45497224367903 & 14 \tabularnewline
\hline
\end{tabular}
%Source: https://freestatistics.org/blog/index.php?pk=78858&T=1

[TABLE]
[ROW][C]Standard Deviation-Mean Plot[/C][/ROW]
[ROW][C]Section[/C][C]Mean[/C][C]Standard Deviation[/C][C]Range[/C][/ROW]
[ROW][C]1[/C][C]73.25[/C][C]1.70782512765993[/C][C]4[/C][/ROW]
[ROW][C]2[/C][C]80.25[/C][C]12.5266382827424[/C][C]26[/C][/ROW]
[ROW][C]3[/C][C]67[/C][C]1.4142135623731[/C][C]3[/C][/ROW]
[ROW][C]4[/C][C]76.5[/C][C]1.91485421551268[/C][C]4[/C][/ROW]
[ROW][C]5[/C][C]94.25[/C][C]8.0156097709407[/C][C]17[/C][/ROW]
[ROW][C]6[/C][C]84.5[/C][C]2.38047614284762[/C][C]5[/C][/ROW]
[ROW][C]7[/C][C]91.25[/C][C]6.07590871118606[/C][C]14[/C][/ROW]
[ROW][C]8[/C][C]97.5[/C][C]11.4455231422596[/C][C]28[/C][/ROW]
[ROW][C]9[/C][C]82.75[/C][C]7.54431353183752[/C][C]16[/C][/ROW]
[ROW][C]10[/C][C]96.5[/C][C]5.97215762238964[/C][C]14[/C][/ROW]
[ROW][C]11[/C][C]108[/C][C]7.78888096369861[/C][C]16[/C][/ROW]
[ROW][C]12[/C][C]102.25[/C][C]6.7515430335097[/C][C]15[/C][/ROW]
[ROW][C]13[/C][C]119.25[/C][C]3.86221007541882[/C][C]8[/C][/ROW]
[ROW][C]14[/C][C]146[/C][C]9.59166304662544[/C][C]22[/C][/ROW]
[ROW][C]15[/C][C]128.25[/C][C]4.42530601578392[/C][C]9[/C][/ROW]
[ROW][C]16[/C][C]136[/C][C]4.54606056566195[/C][C]11[/C][/ROW]
[ROW][C]17[/C][C]179.25[/C][C]10.5316981853197[/C][C]25[/C][/ROW]
[ROW][C]18[/C][C]159.25[/C][C]5.61990510002912[/C][C]11[/C][/ROW]
[ROW][C]19[/C][C]167.5[/C][C]4.04145188432738[/C][C]9[/C][/ROW]
[ROW][C]20[/C][C]204.25[/C][C]10.4363148029688[/C][C]25[/C][/ROW]
[ROW][C]21[/C][C]180[/C][C]9.55684745788763[/C][C]19[/C][/ROW]
[ROW][C]22[/C][C]197[/C][C]2.94392028877595[/C][C]7[/C][/ROW]
[ROW][C]23[/C][C]234.75[/C][C]9.21502396451939[/C][C]22[/C][/ROW]
[ROW][C]24[/C][C]201.25[/C][C]5.31507290636732[/C][C]12[/C][/ROW]
[ROW][C]25[/C][C]216.25[/C][C]4.3493294502333[/C][C]10[/C][/ROW]
[ROW][C]26[/C][C]247[/C][C]16.2685791225499[/C][C]35[/C][/ROW]
[ROW][C]27[/C][C]207.5[/C][C]7.18795288428261[/C][C]16[/C][/ROW]
[ROW][C]28[/C][C]232[/C][C]5.35412613473634[/C][C]11[/C][/ROW]
[ROW][C]29[/C][C]270.5[/C][C]13.076696830622[/C][C]27[/C][/ROW]
[ROW][C]30[/C][C]233.5[/C][C]6.45497224367903[/C][C]14[/C][/ROW]
[/TABLE]
Source: https://freestatistics.org/blog/index.php?pk=78858&T=1

Globally Unique Identifier (entire table): ba.freestatistics.org/blog/index.php?pk=78858&T=1

As an alternative you can also use a QR Code:  

The GUIDs for individual cells are displayed in the table below:

Standard Deviation-Mean Plot
SectionMeanStandard DeviationRange
173.251.707825127659934
280.2512.526638282742426
3671.41421356237313
476.51.914854215512684
594.258.015609770940717
684.52.380476142847625
791.256.0759087111860614
897.511.445523142259628
982.757.5443135318375216
1096.55.9721576223896414
111087.7888809636986116
12102.256.751543033509715
13119.253.862210075418828
141469.5916630466254422
15128.254.425306015783929
161364.5460605656619511
17179.2510.531698185319725
18159.255.6199051000291211
19167.54.041451884327389
20204.2510.436314802968825
211809.5568474578876319
221972.943920288775957
23234.759.2150239645193922
24201.255.3150729063673212
25216.254.349329450233310
2624716.268579122549935
27207.57.1879528842826116
282325.3541261347363411
29270.513.07669683062227
30233.56.4549722436790314


Regression: S.E.(k) = alpha + beta * Mean(k)
alpha3.39038898226053
beta0.0231756742215421
S.D.0.0102167717755284
T-STAT2.26839502053412
p-value0.0312101796926725

\begin{tabular}{lllllllll}
\hline
Regression: S.E.(k) = alpha + beta * Mean(k) \tabularnewline
alpha & 3.39038898226053 \tabularnewline
beta & 0.0231756742215421 \tabularnewline
S.D. & 0.0102167717755284 \tabularnewline
T-STAT & 2.26839502053412 \tabularnewline
p-value & 0.0312101796926725 \tabularnewline
\hline
\end{tabular}
%Source: https://freestatistics.org/blog/index.php?pk=78858&T=2

[TABLE]
[ROW][C]Regression: S.E.(k) = alpha + beta * Mean(k)[/C][/ROW]
[ROW][C]alpha[/C][C]3.39038898226053[/C][/ROW]
[ROW][C]beta[/C][C]0.0231756742215421[/C][/ROW]
[ROW][C]S.D.[/C][C]0.0102167717755284[/C][/ROW]
[ROW][C]T-STAT[/C][C]2.26839502053412[/C][/ROW]
[ROW][C]p-value[/C][C]0.0312101796926725[/C][/ROW]
[/TABLE]
Source: https://freestatistics.org/blog/index.php?pk=78858&T=2

Globally Unique Identifier (entire table): ba.freestatistics.org/blog/index.php?pk=78858&T=2

As an alternative you can also use a QR Code:  

The GUIDs for individual cells are displayed in the table below:

Regression: S.E.(k) = alpha + beta * Mean(k)
alpha3.39038898226053
beta0.0231756742215421
S.D.0.0102167717755284
T-STAT2.26839502053412
p-value0.0312101796926725


Regression: ln S.E.(k) = alpha + beta * ln Mean(k)
alpha-1.38912032874359
beta0.640828090589077
S.D.0.240868772684273
T-STAT2.66048638620775
p-value0.0127681807292279
Lambda0.359171909410923

\begin{tabular}{lllllllll}
\hline
Regression: ln S.E.(k) = alpha + beta * ln Mean(k) \tabularnewline
alpha & -1.38912032874359 \tabularnewline
beta & 0.640828090589077 \tabularnewline
S.D. & 0.240868772684273 \tabularnewline
T-STAT & 2.66048638620775 \tabularnewline
p-value & 0.0127681807292279 \tabularnewline
Lambda & 0.359171909410923 \tabularnewline
\hline
\end{tabular}
%Source: https://freestatistics.org/blog/index.php?pk=78858&T=3

[TABLE]
[ROW][C]Regression: ln S.E.(k) = alpha + beta * ln Mean(k)[/C][/ROW]
[ROW][C]alpha[/C][C]-1.38912032874359[/C][/ROW]
[ROW][C]beta[/C][C]0.640828090589077[/C][/ROW]
[ROW][C]S.D.[/C][C]0.240868772684273[/C][/ROW]
[ROW][C]T-STAT[/C][C]2.66048638620775[/C][/ROW]
[ROW][C]p-value[/C][C]0.0127681807292279[/C][/ROW]
[ROW][C]Lambda[/C][C]0.359171909410923[/C][/ROW]
[/TABLE]
Source: https://freestatistics.org/blog/index.php?pk=78858&T=3

Globally Unique Identifier (entire table): ba.freestatistics.org/blog/index.php?pk=78858&T=3

As an alternative you can also use a QR Code:  

The GUIDs for individual cells are displayed in the table below:

Regression: ln S.E.(k) = alpha + beta * ln Mean(k)
alpha-1.38912032874359
beta0.640828090589077
S.D.0.240868772684273
T-STAT2.66048638620775
p-value0.0127681807292279
Lambda0.359171909410923


Parameters (Session):
Parameters (R input):
par1 = 4 ;
R code (references can be found in the software module):
par1 <- as.numeric(par1)
(n <- length(x))
(np <- floor(n / par1))
arr <- array(NA,dim=c(par1,np))
j <- 0
k <- 1
for (i in 1:(np*par1))
{
j = j + 1
arr[j,k] <- x[i]
if (j == par1) {
j = 0
k=k+1
}
}
arr
arr.mean <- array(NA,dim=np)
arr.sd <- array(NA,dim=np)
arr.range <- array(NA,dim=np)
for (j in 1:np)
{
arr.mean[j] <- mean(arr[,j],na.rm=TRUE)
arr.sd[j] <- sd(arr[,j],na.rm=TRUE)
arr.range[j] <- max(arr[,j],na.rm=TRUE) - min(arr[,j],na.rm=TRUE)
}
arr.mean
arr.sd
arr.range
(lm1 <- lm(arr.sd~arr.mean))
(lnlm1 <- lm(log(arr.sd)~log(arr.mean)))
(lm2 <- lm(arr.range~arr.mean))
bitmap(file='test1.png')
plot(arr.mean,arr.sd,main='Standard Deviation-Mean Plot',xlab='mean',ylab='standard deviation')
dev.off()
bitmap(file='test2.png')
plot(arr.mean,arr.range,main='Range-Mean Plot',xlab='mean',ylab='range')
dev.off()
load(file='createtable')
a<-table.start()
a<-table.row.start(a)
a<-table.element(a,'Standard Deviation-Mean Plot',4,TRUE)
a<-table.row.end(a)
a<-table.row.start(a)
a<-table.element(a,'Section',header=TRUE)
a<-table.element(a,'Mean',header=TRUE)
a<-table.element(a,'Standard Deviation',header=TRUE)
a<-table.element(a,'Range',header=TRUE)
a<-table.row.end(a)
for (j in 1:np) {
a<-table.row.start(a)
a<-table.element(a,j,header=TRUE)
a<-table.element(a,arr.mean[j])
a<-table.element(a,arr.sd[j] )
a<-table.element(a,arr.range[j] )
a<-table.row.end(a)
}
a<-table.end(a)
table.save(a,file='mytable.tab')
a<-table.start()
a<-table.row.start(a)
a<-table.element(a,'Regression: S.E.(k) = alpha + beta * Mean(k)',2,TRUE)
a<-table.row.end(a)
a<-table.row.start(a)
a<-table.element(a,'alpha',header=TRUE)
a<-table.element(a,lm1$coefficients[[1]])
a<-table.row.end(a)
a<-table.row.start(a)
a<-table.element(a,'beta',header=TRUE)
a<-table.element(a,lm1$coefficients[[2]])
a<-table.row.end(a)
a<-table.row.start(a)
a<-table.element(a,'S.D.',header=TRUE)
a<-table.element(a,summary(lm1)$coefficients[2,2])
a<-table.row.end(a)
a<-table.row.start(a)
a<-table.element(a,'T-STAT',header=TRUE)
a<-table.element(a,summary(lm1)$coefficients[2,3])
a<-table.row.end(a)
a<-table.row.start(a)
a<-table.element(a,'p-value',header=TRUE)
a<-table.element(a,summary(lm1)$coefficients[2,4])
a<-table.row.end(a)
a<-table.end(a)
table.save(a,file='mytable1.tab')
a<-table.start()
a<-table.row.start(a)
a<-table.element(a,'Regression: ln S.E.(k) = alpha + beta * ln Mean(k)',2,TRUE)
a<-table.row.end(a)
a<-table.row.start(a)
a<-table.element(a,'alpha',header=TRUE)
a<-table.element(a,lnlm1$coefficients[[1]])
a<-table.row.end(a)
a<-table.row.start(a)
a<-table.element(a,'beta',header=TRUE)
a<-table.element(a,lnlm1$coefficients[[2]])
a<-table.row.end(a)
a<-table.row.start(a)
a<-table.element(a,'S.D.',header=TRUE)
a<-table.element(a,summary(lnlm1)$coefficients[2,2])
a<-table.row.end(a)
a<-table.row.start(a)
a<-table.element(a,'T-STAT',header=TRUE)
a<-table.element(a,summary(lnlm1)$coefficients[2,3])
a<-table.row.end(a)
a<-table.row.start(a)
a<-table.element(a,'p-value',header=TRUE)
a<-table.element(a,summary(lnlm1)$coefficients[2,4])
a<-table.row.end(a)
a<-table.row.start(a)
a<-table.element(a,'Lambda',header=TRUE)
a<-table.element(a,1-lnlm1$coefficients[[2]])
a<-table.row.end(a)
a<-table.end(a)
table.save(a,file='mytable2.tab')