Free Statistics

of Irreproducible Research!

Author's title

Author*Unverified author*
R Software Modulerwasp_autocorrelation.wasp
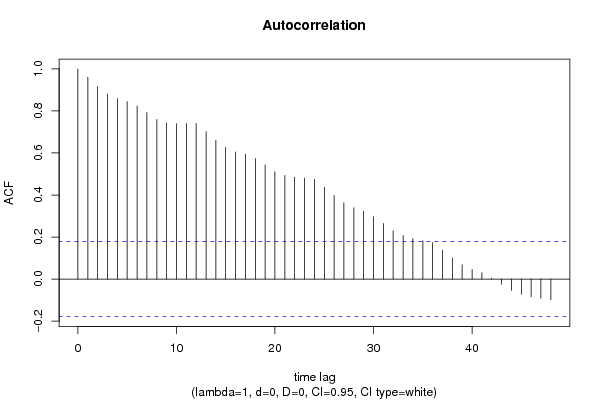
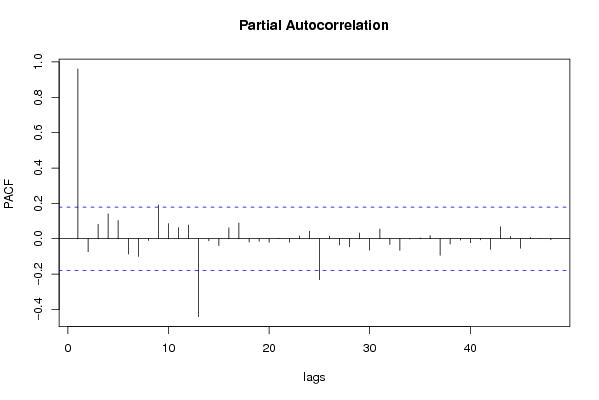
Title produced by software(Partial) Autocorrelation Function
Date of computationSun, 15 Aug 2010 12:54:02 +0000
Cite this page as followsStatistical Computations at FreeStatistics.org, Office for Research Development and Education, URL https://freestatistics.org/blog/index.php?v=date/2010/Aug/15/t12818768233a1eq7xgxh5gr7n.htm/, Retrieved Sat, 27 Apr 2024 23:31:20 +0000
Statistical Computations at FreeStatistics.org, Office for Research Development and Education, URL https://freestatistics.org/blog/index.php?pk=78846, Retrieved Sat, 27 Apr 2024 23:31:20 +0000
QR Codes:

Original text written by user:
IsPrivate?No (this computation is public)
User-defined keywordsSebastien Delforge
Estimated Impact149
Family? (F = Feedback message, R = changed R code, M = changed R Module, P = changed Parameters, D = changed Data)
-       [(Partial) Autocorrelation Function] [Autocorrelation o...] [2010-08-15 12:54:02] [923770d86edf74ed976a539eae527e37] [Current]
Feedback Forum

Post a new message
Dataseries X:
75
74
73
71
91
90
75
65
66
66
67
69
75
79
75
77
100
100
94
83
83
83
84
88
89
98
94
84
111
98
98
83
79
78
80
94
98
104
94
90
115
104
114
99
96
98
104
111
117
125
117
118
151
145
155
133
124
125
131
133
136
141
130
137
177
183
191
166
156
153
164
164
168
173
164
165
205
207
215
190
169
175
188
188
196
201
194
197
237
236
244
222
195
199
207
204
212
222
214
217
258
256
251
223
198
206
214
212
227
238
228
235
275
278
278
251
225
232
238
239


Summary of computational transaction
Raw Inputview raw input (R code)
Raw Outputview raw output of R engine
Computing time2 seconds
R Server'RServer@AstonUniversity' @ vre.aston.ac.uk

\begin{tabular}{lllllllll}
\hline
Summary of computational transaction \tabularnewline
Raw Input & view raw input (R code)  \tabularnewline
Raw Output & view raw output of R engine  \tabularnewline
Computing time & 2 seconds \tabularnewline
R Server & 'RServer@AstonUniversity' @ vre.aston.ac.uk \tabularnewline
\hline
\end{tabular}
%Source: https://freestatistics.org/blog/index.php?pk=78846&T=0

[TABLE]
[ROW][C]Summary of computational transaction[/C][/ROW]
[ROW][C]Raw Input[/C][C]view raw input (R code) [/C][/ROW]
[ROW][C]Raw Output[/C][C]view raw output of R engine [/C][/ROW]
[ROW][C]Computing time[/C][C]2 seconds[/C][/ROW]
[ROW][C]R Server[/C][C]'RServer@AstonUniversity' @ vre.aston.ac.uk[/C][/ROW]
[/TABLE]
Source: https://freestatistics.org/blog/index.php?pk=78846&T=0

Globally Unique Identifier (entire table): ba.freestatistics.org/blog/index.php?pk=78846&T=0

As an alternative you can also use a QR Code:  

The GUIDs for individual cells are displayed in the table below:

Summary of computational transaction
Raw Inputview raw input (R code)
Raw Outputview raw output of R engine
Computing time2 seconds
R Server'RServer@AstonUniversity' @ vre.aston.ac.uk


Autocorrelation Function
Time lag kACF(k)T-STATP-value
10.9604210.52090
20.91672110.04220
30.8808689.64940
40.8581359.40040
50.8446799.2530
60.8237299.02350
70.7922468.67860
80.7590918.31540
90.7435088.14470
100.739558.10140
110.7400838.10720
120.7398438.10460
130.7015147.68470
140.660817.23880
150.6260856.85840
160.6050876.62840
170.5934746.50120
180.5735226.28260
190.5432945.95150
200.5104595.59180
210.4931695.40240
220.4851425.31450
230.480465.26320
240.4752265.20580
250.4364164.78073e-06
260.3971644.35071.4e-05
270.363293.97965.9e-05
280.339123.71490.000155
290.3229813.53810.000287
300.2968133.25140.000745
310.2645162.89760.002235
320.2293932.51290.006651
330.2067332.26460.012665
340.1925982.10980.018476
350.1822541.99650.024072
360.1728381.89330.03036
370.1369021.49970.068161
380.099951.09490.137877
390.0677670.74230.229664
400.045310.49630.310281
410.0302640.33150.370411
420.0042040.0460.481674
43-0.024653-0.27010.39379
44-0.054178-0.59350.276985
45-0.072692-0.79630.213714
46-0.083775-0.91770.180305
47-0.091546-1.00280.158979
48-0.098288-1.07670.141889

\begin{tabular}{lllllllll}
\hline
Autocorrelation Function \tabularnewline
Time lag k & ACF(k) & T-STAT & P-value \tabularnewline
1 & 0.96042 & 10.5209 & 0 \tabularnewline
2 & 0.916721 & 10.0422 & 0 \tabularnewline
3 & 0.880868 & 9.6494 & 0 \tabularnewline
4 & 0.858135 & 9.4004 & 0 \tabularnewline
5 & 0.844679 & 9.253 & 0 \tabularnewline
6 & 0.823729 & 9.0235 & 0 \tabularnewline
7 & 0.792246 & 8.6786 & 0 \tabularnewline
8 & 0.759091 & 8.3154 & 0 \tabularnewline
9 & 0.743508 & 8.1447 & 0 \tabularnewline
10 & 0.73955 & 8.1014 & 0 \tabularnewline
11 & 0.740083 & 8.1072 & 0 \tabularnewline
12 & 0.739843 & 8.1046 & 0 \tabularnewline
13 & 0.701514 & 7.6847 & 0 \tabularnewline
14 & 0.66081 & 7.2388 & 0 \tabularnewline
15 & 0.626085 & 6.8584 & 0 \tabularnewline
16 & 0.605087 & 6.6284 & 0 \tabularnewline
17 & 0.593474 & 6.5012 & 0 \tabularnewline
18 & 0.573522 & 6.2826 & 0 \tabularnewline
19 & 0.543294 & 5.9515 & 0 \tabularnewline
20 & 0.510459 & 5.5918 & 0 \tabularnewline
21 & 0.493169 & 5.4024 & 0 \tabularnewline
22 & 0.485142 & 5.3145 & 0 \tabularnewline
23 & 0.48046 & 5.2632 & 0 \tabularnewline
24 & 0.475226 & 5.2058 & 0 \tabularnewline
25 & 0.436416 & 4.7807 & 3e-06 \tabularnewline
26 & 0.397164 & 4.3507 & 1.4e-05 \tabularnewline
27 & 0.36329 & 3.9796 & 5.9e-05 \tabularnewline
28 & 0.33912 & 3.7149 & 0.000155 \tabularnewline
29 & 0.322981 & 3.5381 & 0.000287 \tabularnewline
30 & 0.296813 & 3.2514 & 0.000745 \tabularnewline
31 & 0.264516 & 2.8976 & 0.002235 \tabularnewline
32 & 0.229393 & 2.5129 & 0.006651 \tabularnewline
33 & 0.206733 & 2.2646 & 0.012665 \tabularnewline
34 & 0.192598 & 2.1098 & 0.018476 \tabularnewline
35 & 0.182254 & 1.9965 & 0.024072 \tabularnewline
36 & 0.172838 & 1.8933 & 0.03036 \tabularnewline
37 & 0.136902 & 1.4997 & 0.068161 \tabularnewline
38 & 0.09995 & 1.0949 & 0.137877 \tabularnewline
39 & 0.067767 & 0.7423 & 0.229664 \tabularnewline
40 & 0.04531 & 0.4963 & 0.310281 \tabularnewline
41 & 0.030264 & 0.3315 & 0.370411 \tabularnewline
42 & 0.004204 & 0.046 & 0.481674 \tabularnewline
43 & -0.024653 & -0.2701 & 0.39379 \tabularnewline
44 & -0.054178 & -0.5935 & 0.276985 \tabularnewline
45 & -0.072692 & -0.7963 & 0.213714 \tabularnewline
46 & -0.083775 & -0.9177 & 0.180305 \tabularnewline
47 & -0.091546 & -1.0028 & 0.158979 \tabularnewline
48 & -0.098288 & -1.0767 & 0.141889 \tabularnewline
\hline
\end{tabular}
%Source: https://freestatistics.org/blog/index.php?pk=78846&T=1

[TABLE]
[ROW][C]Autocorrelation Function[/C][/ROW]
[ROW][C]Time lag k[/C][C]ACF(k)[/C][C]T-STAT[/C][C]P-value[/C][/ROW]
[ROW][C]1[/C][C]0.96042[/C][C]10.5209[/C][C]0[/C][/ROW]
[ROW][C]2[/C][C]0.916721[/C][C]10.0422[/C][C]0[/C][/ROW]
[ROW][C]3[/C][C]0.880868[/C][C]9.6494[/C][C]0[/C][/ROW]
[ROW][C]4[/C][C]0.858135[/C][C]9.4004[/C][C]0[/C][/ROW]
[ROW][C]5[/C][C]0.844679[/C][C]9.253[/C][C]0[/C][/ROW]
[ROW][C]6[/C][C]0.823729[/C][C]9.0235[/C][C]0[/C][/ROW]
[ROW][C]7[/C][C]0.792246[/C][C]8.6786[/C][C]0[/C][/ROW]
[ROW][C]8[/C][C]0.759091[/C][C]8.3154[/C][C]0[/C][/ROW]
[ROW][C]9[/C][C]0.743508[/C][C]8.1447[/C][C]0[/C][/ROW]
[ROW][C]10[/C][C]0.73955[/C][C]8.1014[/C][C]0[/C][/ROW]
[ROW][C]11[/C][C]0.740083[/C][C]8.1072[/C][C]0[/C][/ROW]
[ROW][C]12[/C][C]0.739843[/C][C]8.1046[/C][C]0[/C][/ROW]
[ROW][C]13[/C][C]0.701514[/C][C]7.6847[/C][C]0[/C][/ROW]
[ROW][C]14[/C][C]0.66081[/C][C]7.2388[/C][C]0[/C][/ROW]
[ROW][C]15[/C][C]0.626085[/C][C]6.8584[/C][C]0[/C][/ROW]
[ROW][C]16[/C][C]0.605087[/C][C]6.6284[/C][C]0[/C][/ROW]
[ROW][C]17[/C][C]0.593474[/C][C]6.5012[/C][C]0[/C][/ROW]
[ROW][C]18[/C][C]0.573522[/C][C]6.2826[/C][C]0[/C][/ROW]
[ROW][C]19[/C][C]0.543294[/C][C]5.9515[/C][C]0[/C][/ROW]
[ROW][C]20[/C][C]0.510459[/C][C]5.5918[/C][C]0[/C][/ROW]
[ROW][C]21[/C][C]0.493169[/C][C]5.4024[/C][C]0[/C][/ROW]
[ROW][C]22[/C][C]0.485142[/C][C]5.3145[/C][C]0[/C][/ROW]
[ROW][C]23[/C][C]0.48046[/C][C]5.2632[/C][C]0[/C][/ROW]
[ROW][C]24[/C][C]0.475226[/C][C]5.2058[/C][C]0[/C][/ROW]
[ROW][C]25[/C][C]0.436416[/C][C]4.7807[/C][C]3e-06[/C][/ROW]
[ROW][C]26[/C][C]0.397164[/C][C]4.3507[/C][C]1.4e-05[/C][/ROW]
[ROW][C]27[/C][C]0.36329[/C][C]3.9796[/C][C]5.9e-05[/C][/ROW]
[ROW][C]28[/C][C]0.33912[/C][C]3.7149[/C][C]0.000155[/C][/ROW]
[ROW][C]29[/C][C]0.322981[/C][C]3.5381[/C][C]0.000287[/C][/ROW]
[ROW][C]30[/C][C]0.296813[/C][C]3.2514[/C][C]0.000745[/C][/ROW]
[ROW][C]31[/C][C]0.264516[/C][C]2.8976[/C][C]0.002235[/C][/ROW]
[ROW][C]32[/C][C]0.229393[/C][C]2.5129[/C][C]0.006651[/C][/ROW]
[ROW][C]33[/C][C]0.206733[/C][C]2.2646[/C][C]0.012665[/C][/ROW]
[ROW][C]34[/C][C]0.192598[/C][C]2.1098[/C][C]0.018476[/C][/ROW]
[ROW][C]35[/C][C]0.182254[/C][C]1.9965[/C][C]0.024072[/C][/ROW]
[ROW][C]36[/C][C]0.172838[/C][C]1.8933[/C][C]0.03036[/C][/ROW]
[ROW][C]37[/C][C]0.136902[/C][C]1.4997[/C][C]0.068161[/C][/ROW]
[ROW][C]38[/C][C]0.09995[/C][C]1.0949[/C][C]0.137877[/C][/ROW]
[ROW][C]39[/C][C]0.067767[/C][C]0.7423[/C][C]0.229664[/C][/ROW]
[ROW][C]40[/C][C]0.04531[/C][C]0.4963[/C][C]0.310281[/C][/ROW]
[ROW][C]41[/C][C]0.030264[/C][C]0.3315[/C][C]0.370411[/C][/ROW]
[ROW][C]42[/C][C]0.004204[/C][C]0.046[/C][C]0.481674[/C][/ROW]
[ROW][C]43[/C][C]-0.024653[/C][C]-0.2701[/C][C]0.39379[/C][/ROW]
[ROW][C]44[/C][C]-0.054178[/C][C]-0.5935[/C][C]0.276985[/C][/ROW]
[ROW][C]45[/C][C]-0.072692[/C][C]-0.7963[/C][C]0.213714[/C][/ROW]
[ROW][C]46[/C][C]-0.083775[/C][C]-0.9177[/C][C]0.180305[/C][/ROW]
[ROW][C]47[/C][C]-0.091546[/C][C]-1.0028[/C][C]0.158979[/C][/ROW]
[ROW][C]48[/C][C]-0.098288[/C][C]-1.0767[/C][C]0.141889[/C][/ROW]
[/TABLE]
Source: https://freestatistics.org/blog/index.php?pk=78846&T=1

Globally Unique Identifier (entire table): ba.freestatistics.org/blog/index.php?pk=78846&T=1

As an alternative you can also use a QR Code:  

The GUIDs for individual cells are displayed in the table below:

Autocorrelation Function
Time lag kACF(k)T-STATP-value
10.9604210.52090
20.91672110.04220
30.8808689.64940
40.8581359.40040
50.8446799.2530
60.8237299.02350
70.7922468.67860
80.7590918.31540
90.7435088.14470
100.739558.10140
110.7400838.10720
120.7398438.10460
130.7015147.68470
140.660817.23880
150.6260856.85840
160.6050876.62840
170.5934746.50120
180.5735226.28260
190.5432945.95150
200.5104595.59180
210.4931695.40240
220.4851425.31450
230.480465.26320
240.4752265.20580
250.4364164.78073e-06
260.3971644.35071.4e-05
270.363293.97965.9e-05
280.339123.71490.000155
290.3229813.53810.000287
300.2968133.25140.000745
310.2645162.89760.002235
320.2293932.51290.006651
330.2067332.26460.012665
340.1925982.10980.018476
350.1822541.99650.024072
360.1728381.89330.03036
370.1369021.49970.068161
380.099951.09490.137877
390.0677670.74230.229664
400.045310.49630.310281
410.0302640.33150.370411
420.0042040.0460.481674
43-0.024653-0.27010.39379
44-0.054178-0.59350.276985
45-0.072692-0.79630.213714
46-0.083775-0.91770.180305
47-0.091546-1.00280.158979
48-0.098288-1.07670.141889


Partial Autocorrelation Function
Time lag kPACF(k)T-STATP-value
10.9604210.52090
2-0.073275-0.80270.211872
30.0815220.8930.186816
40.1407521.54190.062871
50.1033071.13170.130014
6-0.087014-0.95320.171204
7-0.098847-1.08280.14053
8-0.010171-0.11140.455734
90.1913782.09640.019072
100.0844440.9250.178401
110.0628880.68890.246108
120.0772160.84590.199656
13-0.440903-4.82992e-06
14-0.012159-0.13320.447132
15-0.038963-0.42680.33514
160.0616250.67510.250465
170.0896140.98170.164118
18-0.017951-0.19660.422219
19-0.014841-0.16260.435565
20-0.020575-0.22540.411031
210.0009820.01080.49572
22-0.019448-0.2130.415829
230.0156250.17120.432192
240.0420120.46020.323096
25-0.231764-2.53880.006201
260.0136330.14930.440766
27-0.034964-0.3830.351194
28-0.045619-0.49970.309089
290.0323340.35420.361907
30-0.064429-0.70580.240846
310.0544440.59640.276015
32-0.033408-0.3660.357518
33-0.065155-0.71370.238388
34-0.001538-0.01690.493291
350.0037930.04150.483464
360.0176390.19320.423554
37-0.093505-1.02430.153879
38-0.030324-0.33220.370167
39-0.007923-0.08680.465491
40-0.02234-0.24470.403543
41-0.006177-0.06770.473082
42-0.059357-0.65020.258395
430.0679120.74390.229184
440.0122570.13430.446707
45-0.05349-0.58590.279505
460.0070060.07670.469478
47-6e-06-1e-040.499975
48-0.005971-0.06540.473979

\begin{tabular}{lllllllll}
\hline
Partial Autocorrelation Function \tabularnewline
Time lag k & PACF(k) & T-STAT & P-value \tabularnewline
1 & 0.96042 & 10.5209 & 0 \tabularnewline
2 & -0.073275 & -0.8027 & 0.211872 \tabularnewline
3 & 0.081522 & 0.893 & 0.186816 \tabularnewline
4 & 0.140752 & 1.5419 & 0.062871 \tabularnewline
5 & 0.103307 & 1.1317 & 0.130014 \tabularnewline
6 & -0.087014 & -0.9532 & 0.171204 \tabularnewline
7 & -0.098847 & -1.0828 & 0.14053 \tabularnewline
8 & -0.010171 & -0.1114 & 0.455734 \tabularnewline
9 & 0.191378 & 2.0964 & 0.019072 \tabularnewline
10 & 0.084444 & 0.925 & 0.178401 \tabularnewline
11 & 0.062888 & 0.6889 & 0.246108 \tabularnewline
12 & 0.077216 & 0.8459 & 0.199656 \tabularnewline
13 & -0.440903 & -4.8299 & 2e-06 \tabularnewline
14 & -0.012159 & -0.1332 & 0.447132 \tabularnewline
15 & -0.038963 & -0.4268 & 0.33514 \tabularnewline
16 & 0.061625 & 0.6751 & 0.250465 \tabularnewline
17 & 0.089614 & 0.9817 & 0.164118 \tabularnewline
18 & -0.017951 & -0.1966 & 0.422219 \tabularnewline
19 & -0.014841 & -0.1626 & 0.435565 \tabularnewline
20 & -0.020575 & -0.2254 & 0.411031 \tabularnewline
21 & 0.000982 & 0.0108 & 0.49572 \tabularnewline
22 & -0.019448 & -0.213 & 0.415829 \tabularnewline
23 & 0.015625 & 0.1712 & 0.432192 \tabularnewline
24 & 0.042012 & 0.4602 & 0.323096 \tabularnewline
25 & -0.231764 & -2.5388 & 0.006201 \tabularnewline
26 & 0.013633 & 0.1493 & 0.440766 \tabularnewline
27 & -0.034964 & -0.383 & 0.351194 \tabularnewline
28 & -0.045619 & -0.4997 & 0.309089 \tabularnewline
29 & 0.032334 & 0.3542 & 0.361907 \tabularnewline
30 & -0.064429 & -0.7058 & 0.240846 \tabularnewline
31 & 0.054444 & 0.5964 & 0.276015 \tabularnewline
32 & -0.033408 & -0.366 & 0.357518 \tabularnewline
33 & -0.065155 & -0.7137 & 0.238388 \tabularnewline
34 & -0.001538 & -0.0169 & 0.493291 \tabularnewline
35 & 0.003793 & 0.0415 & 0.483464 \tabularnewline
36 & 0.017639 & 0.1932 & 0.423554 \tabularnewline
37 & -0.093505 & -1.0243 & 0.153879 \tabularnewline
38 & -0.030324 & -0.3322 & 0.370167 \tabularnewline
39 & -0.007923 & -0.0868 & 0.465491 \tabularnewline
40 & -0.02234 & -0.2447 & 0.403543 \tabularnewline
41 & -0.006177 & -0.0677 & 0.473082 \tabularnewline
42 & -0.059357 & -0.6502 & 0.258395 \tabularnewline
43 & 0.067912 & 0.7439 & 0.229184 \tabularnewline
44 & 0.012257 & 0.1343 & 0.446707 \tabularnewline
45 & -0.05349 & -0.5859 & 0.279505 \tabularnewline
46 & 0.007006 & 0.0767 & 0.469478 \tabularnewline
47 & -6e-06 & -1e-04 & 0.499975 \tabularnewline
48 & -0.005971 & -0.0654 & 0.473979 \tabularnewline
\hline
\end{tabular}
%Source: https://freestatistics.org/blog/index.php?pk=78846&T=2

[TABLE]
[ROW][C]Partial Autocorrelation Function[/C][/ROW]
[ROW][C]Time lag k[/C][C]PACF(k)[/C][C]T-STAT[/C][C]P-value[/C][/ROW]
[ROW][C]1[/C][C]0.96042[/C][C]10.5209[/C][C]0[/C][/ROW]
[ROW][C]2[/C][C]-0.073275[/C][C]-0.8027[/C][C]0.211872[/C][/ROW]
[ROW][C]3[/C][C]0.081522[/C][C]0.893[/C][C]0.186816[/C][/ROW]
[ROW][C]4[/C][C]0.140752[/C][C]1.5419[/C][C]0.062871[/C][/ROW]
[ROW][C]5[/C][C]0.103307[/C][C]1.1317[/C][C]0.130014[/C][/ROW]
[ROW][C]6[/C][C]-0.087014[/C][C]-0.9532[/C][C]0.171204[/C][/ROW]
[ROW][C]7[/C][C]-0.098847[/C][C]-1.0828[/C][C]0.14053[/C][/ROW]
[ROW][C]8[/C][C]-0.010171[/C][C]-0.1114[/C][C]0.455734[/C][/ROW]
[ROW][C]9[/C][C]0.191378[/C][C]2.0964[/C][C]0.019072[/C][/ROW]
[ROW][C]10[/C][C]0.084444[/C][C]0.925[/C][C]0.178401[/C][/ROW]
[ROW][C]11[/C][C]0.062888[/C][C]0.6889[/C][C]0.246108[/C][/ROW]
[ROW][C]12[/C][C]0.077216[/C][C]0.8459[/C][C]0.199656[/C][/ROW]
[ROW][C]13[/C][C]-0.440903[/C][C]-4.8299[/C][C]2e-06[/C][/ROW]
[ROW][C]14[/C][C]-0.012159[/C][C]-0.1332[/C][C]0.447132[/C][/ROW]
[ROW][C]15[/C][C]-0.038963[/C][C]-0.4268[/C][C]0.33514[/C][/ROW]
[ROW][C]16[/C][C]0.061625[/C][C]0.6751[/C][C]0.250465[/C][/ROW]
[ROW][C]17[/C][C]0.089614[/C][C]0.9817[/C][C]0.164118[/C][/ROW]
[ROW][C]18[/C][C]-0.017951[/C][C]-0.1966[/C][C]0.422219[/C][/ROW]
[ROW][C]19[/C][C]-0.014841[/C][C]-0.1626[/C][C]0.435565[/C][/ROW]
[ROW][C]20[/C][C]-0.020575[/C][C]-0.2254[/C][C]0.411031[/C][/ROW]
[ROW][C]21[/C][C]0.000982[/C][C]0.0108[/C][C]0.49572[/C][/ROW]
[ROW][C]22[/C][C]-0.019448[/C][C]-0.213[/C][C]0.415829[/C][/ROW]
[ROW][C]23[/C][C]0.015625[/C][C]0.1712[/C][C]0.432192[/C][/ROW]
[ROW][C]24[/C][C]0.042012[/C][C]0.4602[/C][C]0.323096[/C][/ROW]
[ROW][C]25[/C][C]-0.231764[/C][C]-2.5388[/C][C]0.006201[/C][/ROW]
[ROW][C]26[/C][C]0.013633[/C][C]0.1493[/C][C]0.440766[/C][/ROW]
[ROW][C]27[/C][C]-0.034964[/C][C]-0.383[/C][C]0.351194[/C][/ROW]
[ROW][C]28[/C][C]-0.045619[/C][C]-0.4997[/C][C]0.309089[/C][/ROW]
[ROW][C]29[/C][C]0.032334[/C][C]0.3542[/C][C]0.361907[/C][/ROW]
[ROW][C]30[/C][C]-0.064429[/C][C]-0.7058[/C][C]0.240846[/C][/ROW]
[ROW][C]31[/C][C]0.054444[/C][C]0.5964[/C][C]0.276015[/C][/ROW]
[ROW][C]32[/C][C]-0.033408[/C][C]-0.366[/C][C]0.357518[/C][/ROW]
[ROW][C]33[/C][C]-0.065155[/C][C]-0.7137[/C][C]0.238388[/C][/ROW]
[ROW][C]34[/C][C]-0.001538[/C][C]-0.0169[/C][C]0.493291[/C][/ROW]
[ROW][C]35[/C][C]0.003793[/C][C]0.0415[/C][C]0.483464[/C][/ROW]
[ROW][C]36[/C][C]0.017639[/C][C]0.1932[/C][C]0.423554[/C][/ROW]
[ROW][C]37[/C][C]-0.093505[/C][C]-1.0243[/C][C]0.153879[/C][/ROW]
[ROW][C]38[/C][C]-0.030324[/C][C]-0.3322[/C][C]0.370167[/C][/ROW]
[ROW][C]39[/C][C]-0.007923[/C][C]-0.0868[/C][C]0.465491[/C][/ROW]
[ROW][C]40[/C][C]-0.02234[/C][C]-0.2447[/C][C]0.403543[/C][/ROW]
[ROW][C]41[/C][C]-0.006177[/C][C]-0.0677[/C][C]0.473082[/C][/ROW]
[ROW][C]42[/C][C]-0.059357[/C][C]-0.6502[/C][C]0.258395[/C][/ROW]
[ROW][C]43[/C][C]0.067912[/C][C]0.7439[/C][C]0.229184[/C][/ROW]
[ROW][C]44[/C][C]0.012257[/C][C]0.1343[/C][C]0.446707[/C][/ROW]
[ROW][C]45[/C][C]-0.05349[/C][C]-0.5859[/C][C]0.279505[/C][/ROW]
[ROW][C]46[/C][C]0.007006[/C][C]0.0767[/C][C]0.469478[/C][/ROW]
[ROW][C]47[/C][C]-6e-06[/C][C]-1e-04[/C][C]0.499975[/C][/ROW]
[ROW][C]48[/C][C]-0.005971[/C][C]-0.0654[/C][C]0.473979[/C][/ROW]
[/TABLE]
Source: https://freestatistics.org/blog/index.php?pk=78846&T=2

Globally Unique Identifier (entire table): ba.freestatistics.org/blog/index.php?pk=78846&T=2

As an alternative you can also use a QR Code:  

The GUIDs for individual cells are displayed in the table below:

Partial Autocorrelation Function
Time lag kPACF(k)T-STATP-value
10.9604210.52090
2-0.073275-0.80270.211872
30.0815220.8930.186816
40.1407521.54190.062871
50.1033071.13170.130014
6-0.087014-0.95320.171204
7-0.098847-1.08280.14053
8-0.010171-0.11140.455734
90.1913782.09640.019072
100.0844440.9250.178401
110.0628880.68890.246108
120.0772160.84590.199656
13-0.440903-4.82992e-06
14-0.012159-0.13320.447132
15-0.038963-0.42680.33514
160.0616250.67510.250465
170.0896140.98170.164118
18-0.017951-0.19660.422219
19-0.014841-0.16260.435565
20-0.020575-0.22540.411031
210.0009820.01080.49572
22-0.019448-0.2130.415829
230.0156250.17120.432192
240.0420120.46020.323096
25-0.231764-2.53880.006201
260.0136330.14930.440766
27-0.034964-0.3830.351194
28-0.045619-0.49970.309089
290.0323340.35420.361907
30-0.064429-0.70580.240846
310.0544440.59640.276015
32-0.033408-0.3660.357518
33-0.065155-0.71370.238388
34-0.001538-0.01690.493291
350.0037930.04150.483464
360.0176390.19320.423554
37-0.093505-1.02430.153879
38-0.030324-0.33220.370167
39-0.007923-0.08680.465491
40-0.02234-0.24470.403543
41-0.006177-0.06770.473082
42-0.059357-0.65020.258395
430.0679120.74390.229184
440.0122570.13430.446707
45-0.05349-0.58590.279505
460.0070060.07670.469478
47-6e-06-1e-040.499975
48-0.005971-0.06540.473979


Parameters (Session):
Parameters (R input):
par1 = 48 ; par2 = 1 ; par3 = 0 ; par4 = 0 ; par5 = 12 ; par6 = White Noise ; par7 = 0.95 ;
R code (references can be found in the software module):
if (par1 == 'Default') {
par1 = 10*log10(length(x))
} else {
par1 <- as.numeric(par1)
}
par2 <- as.numeric(par2)
par3 <- as.numeric(par3)
par4 <- as.numeric(par4)
par5 <- as.numeric(par5)
if (par6 == 'White Noise') par6 <- 'white' else par6 <- 'ma'
par7 <- as.numeric(par7)
if (par2 == 0) {
x <- log(x)
} else {
x <- (x ^ par2 - 1) / par2
}
if (par3 > 0) x <- diff(x,lag=1,difference=par3)
if (par4 > 0) x <- diff(x,lag=par5,difference=par4)
bitmap(file='pic1.png')
racf <- acf(x, par1, main='Autocorrelation', xlab='time lag', ylab='ACF', ci.type=par6, ci=par7, sub=paste('(lambda=',par2,', d=',par3,', D=',par4,', CI=', par7, ', CI type=',par6,')',sep=''))
dev.off()
bitmap(file='pic2.png')
rpacf <- pacf(x,par1,main='Partial Autocorrelation',xlab='lags',ylab='PACF')
dev.off()
(myacf <- c(racf$acf))
(mypacf <- c(rpacf$acf))
lengthx <- length(x)
sqrtn <- sqrt(lengthx)
load(file='createtable')
a<-table.start()
a<-table.row.start(a)
a<-table.element(a,'Autocorrelation Function',4,TRUE)
a<-table.row.end(a)
a<-table.row.start(a)
a<-table.element(a,'Time lag k',header=TRUE)
a<-table.element(a,hyperlink('basics.htm','ACF(k)','click here for more information about the Autocorrelation Function'),header=TRUE)
a<-table.element(a,'T-STAT',header=TRUE)
a<-table.element(a,'P-value',header=TRUE)
a<-table.row.end(a)
for (i in 2:(par1+1)) {
a<-table.row.start(a)
a<-table.element(a,i-1,header=TRUE)
a<-table.element(a,round(myacf[i],6))
mytstat <- myacf[i]*sqrtn
a<-table.element(a,round(mytstat,4))
a<-table.element(a,round(1-pt(abs(mytstat),lengthx),6))
a<-table.row.end(a)
}
a<-table.end(a)
table.save(a,file='mytable.tab')
a<-table.start()
a<-table.row.start(a)
a<-table.element(a,'Partial Autocorrelation Function',4,TRUE)
a<-table.row.end(a)
a<-table.row.start(a)
a<-table.element(a,'Time lag k',header=TRUE)
a<-table.element(a,hyperlink('basics.htm','PACF(k)','click here for more information about the Partial Autocorrelation Function'),header=TRUE)
a<-table.element(a,'T-STAT',header=TRUE)
a<-table.element(a,'P-value',header=TRUE)
a<-table.row.end(a)
for (i in 1:par1) {
a<-table.row.start(a)
a<-table.element(a,i,header=TRUE)
a<-table.element(a,round(mypacf[i],6))
mytstat <- mypacf[i]*sqrtn
a<-table.element(a,round(mytstat,4))
a<-table.element(a,round(1-pt(abs(mytstat),lengthx),6))
a<-table.row.end(a)
}
a<-table.end(a)
table.save(a,file='mytable1.tab')