Free Statistics

of Irreproducible Research!

Author's title

Author*Unverified author*
R Software Modulerwasp_autocorrelation.wasp
Title produced by software(Partial) Autocorrelation Function
Date of computationSat, 14 Aug 2010 14:13:28 +0000
Cite this page as followsStatistical Computations at FreeStatistics.org, Office for Research Development and Education, URL https://freestatistics.org/blog/index.php?v=date/2010/Aug/14/t1281795200zn9on5smmr78800.htm/, Retrieved Mon, 06 May 2024 05:03:04 +0000
Statistical Computations at FreeStatistics.org, Office for Research Development and Education, URL https://freestatistics.org/blog/index.php?pk=78811, Retrieved Mon, 06 May 2024 05:03:04 +0000
QR Codes:

Original text written by user:
IsPrivate?No (this computation is public)
User-defined keywordsVanhille Olivier
Estimated Impact122
Family? (F = Feedback message, R = changed R code, M = changed R Module, P = changed Parameters, D = changed Data)
-       [(Partial) Autocorrelation Function] [tijdreeks 1 - sta...] [2010-08-14 14:13:28] [ddb1c76c3acba5bf82e5ed3b5a08f68d] [Current]
Feedback Forum

Post a new message
Dataseries X:
568
567
566
564
584
583
568
558
559
559
560
562
563
552
552
555
575
567
548
541
544
546
551
550
546
532
523
528
555
543
525
517
519
521
520
516
509
494
484
482
508
500
480
467
471
482
481
477
471
455
441
434
459
448
432
414
415
423
425
427
415
399
386
377
397
379
361
350
348
363
367
365
354
327
312
307
335
317
298
286
288
303
310
301
293
264
255
251
279
253
233
226
232
245
250
242
230
196
188
181
212
186
166
155
157
173
182
182
168
131
114
106
134
103
83
74
83
96
95
100


Summary of computational transaction
Raw Inputview raw input (R code)
Raw Outputview raw output of R engine
Computing time4 seconds
R Server'Gwilym Jenkins' @ 72.249.127.135

\begin{tabular}{lllllllll}
\hline
Summary of computational transaction \tabularnewline
Raw Input & view raw input (R code)  \tabularnewline
Raw Output & view raw output of R engine  \tabularnewline
Computing time & 4 seconds \tabularnewline
R Server & 'Gwilym Jenkins' @ 72.249.127.135 \tabularnewline
\hline
\end{tabular}
%Source: https://freestatistics.org/blog/index.php?pk=78811&T=0

[TABLE]
[ROW][C]Summary of computational transaction[/C][/ROW]
[ROW][C]Raw Input[/C][C]view raw input (R code) [/C][/ROW]
[ROW][C]Raw Output[/C][C]view raw output of R engine [/C][/ROW]
[ROW][C]Computing time[/C][C]4 seconds[/C][/ROW]
[ROW][C]R Server[/C][C]'Gwilym Jenkins' @ 72.249.127.135[/C][/ROW]
[/TABLE]
Source: https://freestatistics.org/blog/index.php?pk=78811&T=0

Globally Unique Identifier (entire table): ba.freestatistics.org/blog/index.php?pk=78811&T=0

As an alternative you can also use a QR Code:  

The GUIDs for individual cells are displayed in the table below:

Summary of computational transaction
Raw Inputview raw input (R code)
Raw Outputview raw output of R engine
Computing time4 seconds
R Server'Gwilym Jenkins' @ 72.249.127.135


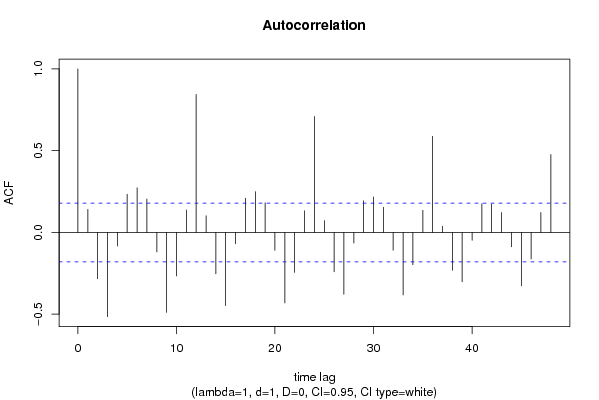
Autocorrelation Function
Time lag kACF(k)T-STATP-value
10.1407431.53530.06368
2-0.283613-3.09390.001231
3-0.515243-5.62060
4-0.083756-0.91370.18137
50.2336092.54840.006048
60.2725732.97340.001783
70.2041072.22650.01393
8-0.119425-1.30280.097584
9-0.489707-5.34210
10-0.265953-2.90120.002215
110.1365651.48970.069468
120.8443399.21070
130.1017211.10960.134695
14-0.253236-2.76250.003324
15-0.447522-4.88192e-06
16-0.069512-0.75830.224889
170.2097792.28840.011939
180.2489582.71580.003798
190.1809251.97370.025369
20-0.109181-1.1910.118006
21-0.431408-4.70613e-06
22-0.244933-2.67190.0043
230.132131.44140.076054
240.7093017.73760
250.0726510.79250.214814
26-0.240799-2.62680.004876
27-0.378405-4.12793.4e-05
28-0.065136-0.71050.239378
290.1934732.11050.018453
300.2167912.36490.009826
310.1533461.67280.048496
32-0.108499-1.18360.119468
33-0.382624-4.17392.9e-05
34-0.197262-2.15190.016714
350.1351241.4740.071557
360.5878416.41260
370.0375510.40960.341406
38-0.231577-2.52620.006422
39-0.301878-3.29310.000653
40-0.04808-0.52450.300455
410.175571.91520.028931
420.1730661.88790.030736
430.1216311.32680.093552
44-0.087753-0.95730.170186
45-0.326625-3.56310.000264
46-0.162327-1.77080.039579
470.1218821.32960.093101
480.4764085.1970

\begin{tabular}{lllllllll}
\hline
Autocorrelation Function \tabularnewline
Time lag k & ACF(k) & T-STAT & P-value \tabularnewline
1 & 0.140743 & 1.5353 & 0.06368 \tabularnewline
2 & -0.283613 & -3.0939 & 0.001231 \tabularnewline
3 & -0.515243 & -5.6206 & 0 \tabularnewline
4 & -0.083756 & -0.9137 & 0.18137 \tabularnewline
5 & 0.233609 & 2.5484 & 0.006048 \tabularnewline
6 & 0.272573 & 2.9734 & 0.001783 \tabularnewline
7 & 0.204107 & 2.2265 & 0.01393 \tabularnewline
8 & -0.119425 & -1.3028 & 0.097584 \tabularnewline
9 & -0.489707 & -5.3421 & 0 \tabularnewline
10 & -0.265953 & -2.9012 & 0.002215 \tabularnewline
11 & 0.136565 & 1.4897 & 0.069468 \tabularnewline
12 & 0.844339 & 9.2107 & 0 \tabularnewline
13 & 0.101721 & 1.1096 & 0.134695 \tabularnewline
14 & -0.253236 & -2.7625 & 0.003324 \tabularnewline
15 & -0.447522 & -4.8819 & 2e-06 \tabularnewline
16 & -0.069512 & -0.7583 & 0.224889 \tabularnewline
17 & 0.209779 & 2.2884 & 0.011939 \tabularnewline
18 & 0.248958 & 2.7158 & 0.003798 \tabularnewline
19 & 0.180925 & 1.9737 & 0.025369 \tabularnewline
20 & -0.109181 & -1.191 & 0.118006 \tabularnewline
21 & -0.431408 & -4.7061 & 3e-06 \tabularnewline
22 & -0.244933 & -2.6719 & 0.0043 \tabularnewline
23 & 0.13213 & 1.4414 & 0.076054 \tabularnewline
24 & 0.709301 & 7.7376 & 0 \tabularnewline
25 & 0.072651 & 0.7925 & 0.214814 \tabularnewline
26 & -0.240799 & -2.6268 & 0.004876 \tabularnewline
27 & -0.378405 & -4.1279 & 3.4e-05 \tabularnewline
28 & -0.065136 & -0.7105 & 0.239378 \tabularnewline
29 & 0.193473 & 2.1105 & 0.018453 \tabularnewline
30 & 0.216791 & 2.3649 & 0.009826 \tabularnewline
31 & 0.153346 & 1.6728 & 0.048496 \tabularnewline
32 & -0.108499 & -1.1836 & 0.119468 \tabularnewline
33 & -0.382624 & -4.1739 & 2.9e-05 \tabularnewline
34 & -0.197262 & -2.1519 & 0.016714 \tabularnewline
35 & 0.135124 & 1.474 & 0.071557 \tabularnewline
36 & 0.587841 & 6.4126 & 0 \tabularnewline
37 & 0.037551 & 0.4096 & 0.341406 \tabularnewline
38 & -0.231577 & -2.5262 & 0.006422 \tabularnewline
39 & -0.301878 & -3.2931 & 0.000653 \tabularnewline
40 & -0.04808 & -0.5245 & 0.300455 \tabularnewline
41 & 0.17557 & 1.9152 & 0.028931 \tabularnewline
42 & 0.173066 & 1.8879 & 0.030736 \tabularnewline
43 & 0.121631 & 1.3268 & 0.093552 \tabularnewline
44 & -0.087753 & -0.9573 & 0.170186 \tabularnewline
45 & -0.326625 & -3.5631 & 0.000264 \tabularnewline
46 & -0.162327 & -1.7708 & 0.039579 \tabularnewline
47 & 0.121882 & 1.3296 & 0.093101 \tabularnewline
48 & 0.476408 & 5.197 & 0 \tabularnewline
\hline
\end{tabular}
%Source: https://freestatistics.org/blog/index.php?pk=78811&T=1

[TABLE]
[ROW][C]Autocorrelation Function[/C][/ROW]
[ROW][C]Time lag k[/C][C]ACF(k)[/C][C]T-STAT[/C][C]P-value[/C][/ROW]
[ROW][C]1[/C][C]0.140743[/C][C]1.5353[/C][C]0.06368[/C][/ROW]
[ROW][C]2[/C][C]-0.283613[/C][C]-3.0939[/C][C]0.001231[/C][/ROW]
[ROW][C]3[/C][C]-0.515243[/C][C]-5.6206[/C][C]0[/C][/ROW]
[ROW][C]4[/C][C]-0.083756[/C][C]-0.9137[/C][C]0.18137[/C][/ROW]
[ROW][C]5[/C][C]0.233609[/C][C]2.5484[/C][C]0.006048[/C][/ROW]
[ROW][C]6[/C][C]0.272573[/C][C]2.9734[/C][C]0.001783[/C][/ROW]
[ROW][C]7[/C][C]0.204107[/C][C]2.2265[/C][C]0.01393[/C][/ROW]
[ROW][C]8[/C][C]-0.119425[/C][C]-1.3028[/C][C]0.097584[/C][/ROW]
[ROW][C]9[/C][C]-0.489707[/C][C]-5.3421[/C][C]0[/C][/ROW]
[ROW][C]10[/C][C]-0.265953[/C][C]-2.9012[/C][C]0.002215[/C][/ROW]
[ROW][C]11[/C][C]0.136565[/C][C]1.4897[/C][C]0.069468[/C][/ROW]
[ROW][C]12[/C][C]0.844339[/C][C]9.2107[/C][C]0[/C][/ROW]
[ROW][C]13[/C][C]0.101721[/C][C]1.1096[/C][C]0.134695[/C][/ROW]
[ROW][C]14[/C][C]-0.253236[/C][C]-2.7625[/C][C]0.003324[/C][/ROW]
[ROW][C]15[/C][C]-0.447522[/C][C]-4.8819[/C][C]2e-06[/C][/ROW]
[ROW][C]16[/C][C]-0.069512[/C][C]-0.7583[/C][C]0.224889[/C][/ROW]
[ROW][C]17[/C][C]0.209779[/C][C]2.2884[/C][C]0.011939[/C][/ROW]
[ROW][C]18[/C][C]0.248958[/C][C]2.7158[/C][C]0.003798[/C][/ROW]
[ROW][C]19[/C][C]0.180925[/C][C]1.9737[/C][C]0.025369[/C][/ROW]
[ROW][C]20[/C][C]-0.109181[/C][C]-1.191[/C][C]0.118006[/C][/ROW]
[ROW][C]21[/C][C]-0.431408[/C][C]-4.7061[/C][C]3e-06[/C][/ROW]
[ROW][C]22[/C][C]-0.244933[/C][C]-2.6719[/C][C]0.0043[/C][/ROW]
[ROW][C]23[/C][C]0.13213[/C][C]1.4414[/C][C]0.076054[/C][/ROW]
[ROW][C]24[/C][C]0.709301[/C][C]7.7376[/C][C]0[/C][/ROW]
[ROW][C]25[/C][C]0.072651[/C][C]0.7925[/C][C]0.214814[/C][/ROW]
[ROW][C]26[/C][C]-0.240799[/C][C]-2.6268[/C][C]0.004876[/C][/ROW]
[ROW][C]27[/C][C]-0.378405[/C][C]-4.1279[/C][C]3.4e-05[/C][/ROW]
[ROW][C]28[/C][C]-0.065136[/C][C]-0.7105[/C][C]0.239378[/C][/ROW]
[ROW][C]29[/C][C]0.193473[/C][C]2.1105[/C][C]0.018453[/C][/ROW]
[ROW][C]30[/C][C]0.216791[/C][C]2.3649[/C][C]0.009826[/C][/ROW]
[ROW][C]31[/C][C]0.153346[/C][C]1.6728[/C][C]0.048496[/C][/ROW]
[ROW][C]32[/C][C]-0.108499[/C][C]-1.1836[/C][C]0.119468[/C][/ROW]
[ROW][C]33[/C][C]-0.382624[/C][C]-4.1739[/C][C]2.9e-05[/C][/ROW]
[ROW][C]34[/C][C]-0.197262[/C][C]-2.1519[/C][C]0.016714[/C][/ROW]
[ROW][C]35[/C][C]0.135124[/C][C]1.474[/C][C]0.071557[/C][/ROW]
[ROW][C]36[/C][C]0.587841[/C][C]6.4126[/C][C]0[/C][/ROW]
[ROW][C]37[/C][C]0.037551[/C][C]0.4096[/C][C]0.341406[/C][/ROW]
[ROW][C]38[/C][C]-0.231577[/C][C]-2.5262[/C][C]0.006422[/C][/ROW]
[ROW][C]39[/C][C]-0.301878[/C][C]-3.2931[/C][C]0.000653[/C][/ROW]
[ROW][C]40[/C][C]-0.04808[/C][C]-0.5245[/C][C]0.300455[/C][/ROW]
[ROW][C]41[/C][C]0.17557[/C][C]1.9152[/C][C]0.028931[/C][/ROW]
[ROW][C]42[/C][C]0.173066[/C][C]1.8879[/C][C]0.030736[/C][/ROW]
[ROW][C]43[/C][C]0.121631[/C][C]1.3268[/C][C]0.093552[/C][/ROW]
[ROW][C]44[/C][C]-0.087753[/C][C]-0.9573[/C][C]0.170186[/C][/ROW]
[ROW][C]45[/C][C]-0.326625[/C][C]-3.5631[/C][C]0.000264[/C][/ROW]
[ROW][C]46[/C][C]-0.162327[/C][C]-1.7708[/C][C]0.039579[/C][/ROW]
[ROW][C]47[/C][C]0.121882[/C][C]1.3296[/C][C]0.093101[/C][/ROW]
[ROW][C]48[/C][C]0.476408[/C][C]5.197[/C][C]0[/C][/ROW]
[/TABLE]
Source: https://freestatistics.org/blog/index.php?pk=78811&T=1

Globally Unique Identifier (entire table): ba.freestatistics.org/blog/index.php?pk=78811&T=1

As an alternative you can also use a QR Code:  

The GUIDs for individual cells are displayed in the table below:

Autocorrelation Function
Time lag kACF(k)T-STATP-value
10.1407431.53530.06368
2-0.283613-3.09390.001231
3-0.515243-5.62060
4-0.083756-0.91370.18137
50.2336092.54840.006048
60.2725732.97340.001783
70.2041072.22650.01393
8-0.119425-1.30280.097584
9-0.489707-5.34210
10-0.265953-2.90120.002215
110.1365651.48970.069468
120.8443399.21070
130.1017211.10960.134695
14-0.253236-2.76250.003324
15-0.447522-4.88192e-06
16-0.069512-0.75830.224889
170.2097792.28840.011939
180.2489582.71580.003798
190.1809251.97370.025369
20-0.109181-1.1910.118006
21-0.431408-4.70613e-06
22-0.244933-2.67190.0043
230.132131.44140.076054
240.7093017.73760
250.0726510.79250.214814
26-0.240799-2.62680.004876
27-0.378405-4.12793.4e-05
28-0.065136-0.71050.239378
290.1934732.11050.018453
300.2167912.36490.009826
310.1533461.67280.048496
32-0.108499-1.18360.119468
33-0.382624-4.17392.9e-05
34-0.197262-2.15190.016714
350.1351241.4740.071557
360.5878416.41260
370.0375510.40960.341406
38-0.231577-2.52620.006422
39-0.301878-3.29310.000653
40-0.04808-0.52450.300455
410.175571.91520.028931
420.1730661.88790.030736
430.1216311.32680.093552
44-0.087753-0.95730.170186
45-0.326625-3.56310.000264
46-0.162327-1.77080.039579
470.1218821.32960.093101
480.4764085.1970


Partial Autocorrelation Function
Time lag kPACF(k)T-STATP-value
10.1407431.53530.06368
2-0.309553-3.37680.000496
3-0.473224-5.16230
4-0.088285-0.96310.168731
5-0.017923-0.19550.42266
6-0.020492-0.22350.41175
70.2547182.77860.003173
80.0639180.69730.243501
9-0.39959-4.3591.4e-05
10-0.155767-1.69920.045945
11-0.104105-1.13570.129192
120.702877.66740
13-0.146066-1.59340.056862
140.1458741.59130.057098
150.2143832.33860.010511
16-0.097343-1.06190.145219
17-0.047805-0.52150.301496
180.0033120.03610.485618
19-0.076536-0.83490.202719
200.0586320.63960.261832
210.0622260.67880.24929
22-0.024131-0.26320.396413
230.079650.86890.193331
240.0057070.06230.47523
25-0.036489-0.3980.345655
26-0.0547-0.59670.275917
270.038070.41530.339336
28-0.07878-0.85940.195928
290.0276710.30190.381647
30-0.005032-0.05490.478157
31-0.041071-0.4480.327473
32-0.014183-0.15470.438653
33-0.02149-0.23440.407529
340.0558770.60950.271663
35-0.009238-0.10080.45995
36-0.030171-0.32910.371319
370.0014510.01580.4937
38-0.038619-0.42130.337156
390.0246010.26840.394439
400.0125210.13660.445793
41-0.039961-0.43590.33184
42-0.000751-0.00820.49674
43-0.006301-0.06870.472657
440.0437650.47740.316969
450.0006210.00680.497305
46-0.025921-0.28280.388923
47-0.002747-0.030.488072
48-0.047403-0.51710.303022

\begin{tabular}{lllllllll}
\hline
Partial Autocorrelation Function \tabularnewline
Time lag k & PACF(k) & T-STAT & P-value \tabularnewline
1 & 0.140743 & 1.5353 & 0.06368 \tabularnewline
2 & -0.309553 & -3.3768 & 0.000496 \tabularnewline
3 & -0.473224 & -5.1623 & 0 \tabularnewline
4 & -0.088285 & -0.9631 & 0.168731 \tabularnewline
5 & -0.017923 & -0.1955 & 0.42266 \tabularnewline
6 & -0.020492 & -0.2235 & 0.41175 \tabularnewline
7 & 0.254718 & 2.7786 & 0.003173 \tabularnewline
8 & 0.063918 & 0.6973 & 0.243501 \tabularnewline
9 & -0.39959 & -4.359 & 1.4e-05 \tabularnewline
10 & -0.155767 & -1.6992 & 0.045945 \tabularnewline
11 & -0.104105 & -1.1357 & 0.129192 \tabularnewline
12 & 0.70287 & 7.6674 & 0 \tabularnewline
13 & -0.146066 & -1.5934 & 0.056862 \tabularnewline
14 & 0.145874 & 1.5913 & 0.057098 \tabularnewline
15 & 0.214383 & 2.3386 & 0.010511 \tabularnewline
16 & -0.097343 & -1.0619 & 0.145219 \tabularnewline
17 & -0.047805 & -0.5215 & 0.301496 \tabularnewline
18 & 0.003312 & 0.0361 & 0.485618 \tabularnewline
19 & -0.076536 & -0.8349 & 0.202719 \tabularnewline
20 & 0.058632 & 0.6396 & 0.261832 \tabularnewline
21 & 0.062226 & 0.6788 & 0.24929 \tabularnewline
22 & -0.024131 & -0.2632 & 0.396413 \tabularnewline
23 & 0.07965 & 0.8689 & 0.193331 \tabularnewline
24 & 0.005707 & 0.0623 & 0.47523 \tabularnewline
25 & -0.036489 & -0.398 & 0.345655 \tabularnewline
26 & -0.0547 & -0.5967 & 0.275917 \tabularnewline
27 & 0.03807 & 0.4153 & 0.339336 \tabularnewline
28 & -0.07878 & -0.8594 & 0.195928 \tabularnewline
29 & 0.027671 & 0.3019 & 0.381647 \tabularnewline
30 & -0.005032 & -0.0549 & 0.478157 \tabularnewline
31 & -0.041071 & -0.448 & 0.327473 \tabularnewline
32 & -0.014183 & -0.1547 & 0.438653 \tabularnewline
33 & -0.02149 & -0.2344 & 0.407529 \tabularnewline
34 & 0.055877 & 0.6095 & 0.271663 \tabularnewline
35 & -0.009238 & -0.1008 & 0.45995 \tabularnewline
36 & -0.030171 & -0.3291 & 0.371319 \tabularnewline
37 & 0.001451 & 0.0158 & 0.4937 \tabularnewline
38 & -0.038619 & -0.4213 & 0.337156 \tabularnewline
39 & 0.024601 & 0.2684 & 0.394439 \tabularnewline
40 & 0.012521 & 0.1366 & 0.445793 \tabularnewline
41 & -0.039961 & -0.4359 & 0.33184 \tabularnewline
42 & -0.000751 & -0.0082 & 0.49674 \tabularnewline
43 & -0.006301 & -0.0687 & 0.472657 \tabularnewline
44 & 0.043765 & 0.4774 & 0.316969 \tabularnewline
45 & 0.000621 & 0.0068 & 0.497305 \tabularnewline
46 & -0.025921 & -0.2828 & 0.388923 \tabularnewline
47 & -0.002747 & -0.03 & 0.488072 \tabularnewline
48 & -0.047403 & -0.5171 & 0.303022 \tabularnewline
\hline
\end{tabular}
%Source: https://freestatistics.org/blog/index.php?pk=78811&T=2

[TABLE]
[ROW][C]Partial Autocorrelation Function[/C][/ROW]
[ROW][C]Time lag k[/C][C]PACF(k)[/C][C]T-STAT[/C][C]P-value[/C][/ROW]
[ROW][C]1[/C][C]0.140743[/C][C]1.5353[/C][C]0.06368[/C][/ROW]
[ROW][C]2[/C][C]-0.309553[/C][C]-3.3768[/C][C]0.000496[/C][/ROW]
[ROW][C]3[/C][C]-0.473224[/C][C]-5.1623[/C][C]0[/C][/ROW]
[ROW][C]4[/C][C]-0.088285[/C][C]-0.9631[/C][C]0.168731[/C][/ROW]
[ROW][C]5[/C][C]-0.017923[/C][C]-0.1955[/C][C]0.42266[/C][/ROW]
[ROW][C]6[/C][C]-0.020492[/C][C]-0.2235[/C][C]0.41175[/C][/ROW]
[ROW][C]7[/C][C]0.254718[/C][C]2.7786[/C][C]0.003173[/C][/ROW]
[ROW][C]8[/C][C]0.063918[/C][C]0.6973[/C][C]0.243501[/C][/ROW]
[ROW][C]9[/C][C]-0.39959[/C][C]-4.359[/C][C]1.4e-05[/C][/ROW]
[ROW][C]10[/C][C]-0.155767[/C][C]-1.6992[/C][C]0.045945[/C][/ROW]
[ROW][C]11[/C][C]-0.104105[/C][C]-1.1357[/C][C]0.129192[/C][/ROW]
[ROW][C]12[/C][C]0.70287[/C][C]7.6674[/C][C]0[/C][/ROW]
[ROW][C]13[/C][C]-0.146066[/C][C]-1.5934[/C][C]0.056862[/C][/ROW]
[ROW][C]14[/C][C]0.145874[/C][C]1.5913[/C][C]0.057098[/C][/ROW]
[ROW][C]15[/C][C]0.214383[/C][C]2.3386[/C][C]0.010511[/C][/ROW]
[ROW][C]16[/C][C]-0.097343[/C][C]-1.0619[/C][C]0.145219[/C][/ROW]
[ROW][C]17[/C][C]-0.047805[/C][C]-0.5215[/C][C]0.301496[/C][/ROW]
[ROW][C]18[/C][C]0.003312[/C][C]0.0361[/C][C]0.485618[/C][/ROW]
[ROW][C]19[/C][C]-0.076536[/C][C]-0.8349[/C][C]0.202719[/C][/ROW]
[ROW][C]20[/C][C]0.058632[/C][C]0.6396[/C][C]0.261832[/C][/ROW]
[ROW][C]21[/C][C]0.062226[/C][C]0.6788[/C][C]0.24929[/C][/ROW]
[ROW][C]22[/C][C]-0.024131[/C][C]-0.2632[/C][C]0.396413[/C][/ROW]
[ROW][C]23[/C][C]0.07965[/C][C]0.8689[/C][C]0.193331[/C][/ROW]
[ROW][C]24[/C][C]0.005707[/C][C]0.0623[/C][C]0.47523[/C][/ROW]
[ROW][C]25[/C][C]-0.036489[/C][C]-0.398[/C][C]0.345655[/C][/ROW]
[ROW][C]26[/C][C]-0.0547[/C][C]-0.5967[/C][C]0.275917[/C][/ROW]
[ROW][C]27[/C][C]0.03807[/C][C]0.4153[/C][C]0.339336[/C][/ROW]
[ROW][C]28[/C][C]-0.07878[/C][C]-0.8594[/C][C]0.195928[/C][/ROW]
[ROW][C]29[/C][C]0.027671[/C][C]0.3019[/C][C]0.381647[/C][/ROW]
[ROW][C]30[/C][C]-0.005032[/C][C]-0.0549[/C][C]0.478157[/C][/ROW]
[ROW][C]31[/C][C]-0.041071[/C][C]-0.448[/C][C]0.327473[/C][/ROW]
[ROW][C]32[/C][C]-0.014183[/C][C]-0.1547[/C][C]0.438653[/C][/ROW]
[ROW][C]33[/C][C]-0.02149[/C][C]-0.2344[/C][C]0.407529[/C][/ROW]
[ROW][C]34[/C][C]0.055877[/C][C]0.6095[/C][C]0.271663[/C][/ROW]
[ROW][C]35[/C][C]-0.009238[/C][C]-0.1008[/C][C]0.45995[/C][/ROW]
[ROW][C]36[/C][C]-0.030171[/C][C]-0.3291[/C][C]0.371319[/C][/ROW]
[ROW][C]37[/C][C]0.001451[/C][C]0.0158[/C][C]0.4937[/C][/ROW]
[ROW][C]38[/C][C]-0.038619[/C][C]-0.4213[/C][C]0.337156[/C][/ROW]
[ROW][C]39[/C][C]0.024601[/C][C]0.2684[/C][C]0.394439[/C][/ROW]
[ROW][C]40[/C][C]0.012521[/C][C]0.1366[/C][C]0.445793[/C][/ROW]
[ROW][C]41[/C][C]-0.039961[/C][C]-0.4359[/C][C]0.33184[/C][/ROW]
[ROW][C]42[/C][C]-0.000751[/C][C]-0.0082[/C][C]0.49674[/C][/ROW]
[ROW][C]43[/C][C]-0.006301[/C][C]-0.0687[/C][C]0.472657[/C][/ROW]
[ROW][C]44[/C][C]0.043765[/C][C]0.4774[/C][C]0.316969[/C][/ROW]
[ROW][C]45[/C][C]0.000621[/C][C]0.0068[/C][C]0.497305[/C][/ROW]
[ROW][C]46[/C][C]-0.025921[/C][C]-0.2828[/C][C]0.388923[/C][/ROW]
[ROW][C]47[/C][C]-0.002747[/C][C]-0.03[/C][C]0.488072[/C][/ROW]
[ROW][C]48[/C][C]-0.047403[/C][C]-0.5171[/C][C]0.303022[/C][/ROW]
[/TABLE]
Source: https://freestatistics.org/blog/index.php?pk=78811&T=2

Globally Unique Identifier (entire table): ba.freestatistics.org/blog/index.php?pk=78811&T=2

As an alternative you can also use a QR Code:  

The GUIDs for individual cells are displayed in the table below:

Partial Autocorrelation Function
Time lag kPACF(k)T-STATP-value
10.1407431.53530.06368
2-0.309553-3.37680.000496
3-0.473224-5.16230
4-0.088285-0.96310.168731
5-0.017923-0.19550.42266
6-0.020492-0.22350.41175
70.2547182.77860.003173
80.0639180.69730.243501
9-0.39959-4.3591.4e-05
10-0.155767-1.69920.045945
11-0.104105-1.13570.129192
120.702877.66740
13-0.146066-1.59340.056862
140.1458741.59130.057098
150.2143832.33860.010511
16-0.097343-1.06190.145219
17-0.047805-0.52150.301496
180.0033120.03610.485618
19-0.076536-0.83490.202719
200.0586320.63960.261832
210.0622260.67880.24929
22-0.024131-0.26320.396413
230.079650.86890.193331
240.0057070.06230.47523
25-0.036489-0.3980.345655
26-0.0547-0.59670.275917
270.038070.41530.339336
28-0.07878-0.85940.195928
290.0276710.30190.381647
30-0.005032-0.05490.478157
31-0.041071-0.4480.327473
32-0.014183-0.15470.438653
33-0.02149-0.23440.407529
340.0558770.60950.271663
35-0.009238-0.10080.45995
36-0.030171-0.32910.371319
370.0014510.01580.4937
38-0.038619-0.42130.337156
390.0246010.26840.394439
400.0125210.13660.445793
41-0.039961-0.43590.33184
42-0.000751-0.00820.49674
43-0.006301-0.06870.472657
440.0437650.47740.316969
450.0006210.00680.497305
46-0.025921-0.28280.388923
47-0.002747-0.030.488072
48-0.047403-0.51710.303022


Parameters (Session):
par1 = 48 ; par2 = 1 ; par3 = 1 ; par4 = 0 ; par5 = 12 ; par6 = White Noise ; par7 = 0.95 ;
Parameters (R input):
par1 = 48 ; par2 = 1 ; par3 = 1 ; par4 = 0 ; par5 = 12 ; par6 = White Noise ; par7 = 0.95 ;
R code (references can be found in the software module):
if (par1 == 'Default') {
par1 = 10*log10(length(x))
} else {
par1 <- as.numeric(par1)
}
par2 <- as.numeric(par2)
par3 <- as.numeric(par3)
par4 <- as.numeric(par4)
par5 <- as.numeric(par5)
if (par6 == 'White Noise') par6 <- 'white' else par6 <- 'ma'
par7 <- as.numeric(par7)
if (par2 == 0) {
x <- log(x)
} else {
x <- (x ^ par2 - 1) / par2
}
if (par3 > 0) x <- diff(x,lag=1,difference=par3)
if (par4 > 0) x <- diff(x,lag=par5,difference=par4)
bitmap(file='pic1.png')
racf <- acf(x, par1, main='Autocorrelation', xlab='time lag', ylab='ACF', ci.type=par6, ci=par7, sub=paste('(lambda=',par2,', d=',par3,', D=',par4,', CI=', par7, ', CI type=',par6,')',sep=''))
dev.off()
bitmap(file='pic2.png')
rpacf <- pacf(x,par1,main='Partial Autocorrelation',xlab='lags',ylab='PACF')
dev.off()
(myacf <- c(racf$acf))
(mypacf <- c(rpacf$acf))
lengthx <- length(x)
sqrtn <- sqrt(lengthx)
load(file='createtable')
a<-table.start()
a<-table.row.start(a)
a<-table.element(a,'Autocorrelation Function',4,TRUE)
a<-table.row.end(a)
a<-table.row.start(a)
a<-table.element(a,'Time lag k',header=TRUE)
a<-table.element(a,hyperlink('basics.htm','ACF(k)','click here for more information about the Autocorrelation Function'),header=TRUE)
a<-table.element(a,'T-STAT',header=TRUE)
a<-table.element(a,'P-value',header=TRUE)
a<-table.row.end(a)
for (i in 2:(par1+1)) {
a<-table.row.start(a)
a<-table.element(a,i-1,header=TRUE)
a<-table.element(a,round(myacf[i],6))
mytstat <- myacf[i]*sqrtn
a<-table.element(a,round(mytstat,4))
a<-table.element(a,round(1-pt(abs(mytstat),lengthx),6))
a<-table.row.end(a)
}
a<-table.end(a)
table.save(a,file='mytable.tab')
a<-table.start()
a<-table.row.start(a)
a<-table.element(a,'Partial Autocorrelation Function',4,TRUE)
a<-table.row.end(a)
a<-table.row.start(a)
a<-table.element(a,'Time lag k',header=TRUE)
a<-table.element(a,hyperlink('basics.htm','PACF(k)','click here for more information about the Partial Autocorrelation Function'),header=TRUE)
a<-table.element(a,'T-STAT',header=TRUE)
a<-table.element(a,'P-value',header=TRUE)
a<-table.row.end(a)
for (i in 1:par1) {
a<-table.row.start(a)
a<-table.element(a,i,header=TRUE)
a<-table.element(a,round(mypacf[i],6))
mytstat <- mypacf[i]*sqrtn
a<-table.element(a,round(mytstat,4))
a<-table.element(a,round(1-pt(abs(mytstat),lengthx),6))
a<-table.row.end(a)
}
a<-table.end(a)
table.save(a,file='mytable1.tab')