Free Statistics

of Irreproducible Research!

Author's title

Author*Unverified author*
R Software Modulerwasp_smp.wasp
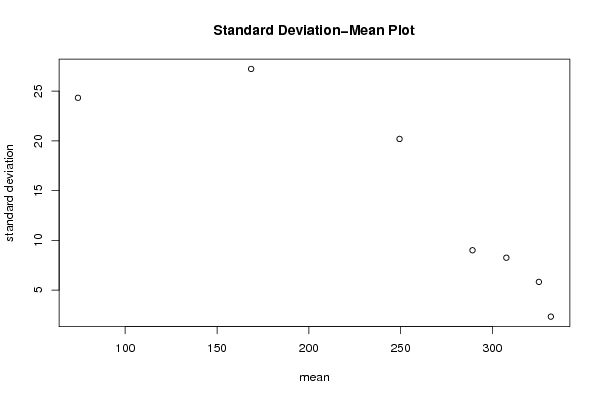
Title produced by softwareStandard Deviation-Mean Plot
Date of computationSat, 14 Aug 2010 11:47:24 +0000
Cite this page as followsStatistical Computations at FreeStatistics.org, Office for Research Development and Education, URL https://freestatistics.org/blog/index.php?v=date/2010/Aug/14/t12817864443zx202eert0mpo9.htm/, Retrieved Mon, 06 May 2024 04:20:23 +0000
Statistical Computations at FreeStatistics.org, Office for Research Development and Education, URL https://freestatistics.org/blog/index.php?pk=78793, Retrieved Mon, 06 May 2024 04:20:23 +0000
QR Codes:

Original text written by user:
IsPrivate?No (this computation is public)
User-defined keywordsJacobs Jeff
Estimated Impact126
Family? (F = Feedback message, R = changed R code, M = changed R Module, P = changed Parameters, D = changed Data)
-       [Standard Deviation-Mean Plot] [Tijdreeks B - Sta...] [2010-08-14 11:47:24] [03859715711bd3369851d387eaa83ba4] [Current]
Feedback Forum

Post a new message
Dataseries X:
335
334
333
331
329
328
329
331
332
332
333
335
335
333
325
322
322
315
321
324
329
332
322
324
324
323
309
306
305
300
301
302
308
311
301
301
308
302
290
286
286
275
284
289
292
293
285
280
281
280
265
260
254
238
247
246
247
237
222
216
212
209
185
186
178
158
166
162
164
147
132
124
117
120
89
81
71
52
63
62
74
67
53
42


Summary of computational transaction
Raw Inputview raw input (R code)
Raw Outputview raw output of R engine
Computing time2 seconds
R Server'George Udny Yule' @ 72.249.76.132

\begin{tabular}{lllllllll}
\hline
Summary of computational transaction \tabularnewline
Raw Input & view raw input (R code)  \tabularnewline
Raw Output & view raw output of R engine  \tabularnewline
Computing time & 2 seconds \tabularnewline
R Server & 'George Udny Yule' @ 72.249.76.132 \tabularnewline
\hline
\end{tabular}
%Source: https://freestatistics.org/blog/index.php?pk=78793&T=0

[TABLE]
[ROW][C]Summary of computational transaction[/C][/ROW]
[ROW][C]Raw Input[/C][C]view raw input (R code) [/C][/ROW]
[ROW][C]Raw Output[/C][C]view raw output of R engine [/C][/ROW]
[ROW][C]Computing time[/C][C]2 seconds[/C][/ROW]
[ROW][C]R Server[/C][C]'George Udny Yule' @ 72.249.76.132[/C][/ROW]
[/TABLE]
Source: https://freestatistics.org/blog/index.php?pk=78793&T=0

Globally Unique Identifier (entire table): ba.freestatistics.org/blog/index.php?pk=78793&T=0

As an alternative you can also use a QR Code:  

The GUIDs for individual cells are displayed in the table below:

Summary of computational transaction
Raw Inputview raw input (R code)
Raw Outputview raw output of R engine
Computing time2 seconds
R Server'George Udny Yule' @ 72.249.76.132


Standard Deviation-Mean Plot
SectionMeanStandard DeviationRange
1331.8333333333332.329000305762637
2325.3333333333335.8205487609664320
3307.5833333333338.2512625296577124
4289.1666666666679.003366373785233
5249.41666666666720.192070150672965
6168.58333333333327.227854498767688
774.2524.327780603476978

\begin{tabular}{lllllllll}
\hline
Standard Deviation-Mean Plot \tabularnewline
Section & Mean & Standard Deviation & Range \tabularnewline
1 & 331.833333333333 & 2.32900030576263 & 7 \tabularnewline
2 & 325.333333333333 & 5.82054876096643 & 20 \tabularnewline
3 & 307.583333333333 & 8.25126252965771 & 24 \tabularnewline
4 & 289.166666666667 & 9.0033663737852 & 33 \tabularnewline
5 & 249.416666666667 & 20.1920701506729 & 65 \tabularnewline
6 & 168.583333333333 & 27.2278544987676 & 88 \tabularnewline
7 & 74.25 & 24.3277806034769 & 78 \tabularnewline
\hline
\end{tabular}
%Source: https://freestatistics.org/blog/index.php?pk=78793&T=1

[TABLE]
[ROW][C]Standard Deviation-Mean Plot[/C][/ROW]
[ROW][C]Section[/C][C]Mean[/C][C]Standard Deviation[/C][C]Range[/C][/ROW]
[ROW][C]1[/C][C]331.833333333333[/C][C]2.32900030576263[/C][C]7[/C][/ROW]
[ROW][C]2[/C][C]325.333333333333[/C][C]5.82054876096643[/C][C]20[/C][/ROW]
[ROW][C]3[/C][C]307.583333333333[/C][C]8.25126252965771[/C][C]24[/C][/ROW]
[ROW][C]4[/C][C]289.166666666667[/C][C]9.0033663737852[/C][C]33[/C][/ROW]
[ROW][C]5[/C][C]249.416666666667[/C][C]20.1920701506729[/C][C]65[/C][/ROW]
[ROW][C]6[/C][C]168.583333333333[/C][C]27.2278544987676[/C][C]88[/C][/ROW]
[ROW][C]7[/C][C]74.25[/C][C]24.3277806034769[/C][C]78[/C][/ROW]
[/TABLE]
Source: https://freestatistics.org/blog/index.php?pk=78793&T=1

Globally Unique Identifier (entire table): ba.freestatistics.org/blog/index.php?pk=78793&T=1

As an alternative you can also use a QR Code:  

The GUIDs for individual cells are displayed in the table below:

Standard Deviation-Mean Plot
SectionMeanStandard DeviationRange
1331.8333333333332.329000305762637
2325.3333333333335.8205487609664320
3307.5833333333338.2512625296577124
4289.1666666666679.003366373785233
5249.41666666666720.192070150672965
6168.58333333333327.227854498767688
774.2524.327780603476978


Regression: S.E.(k) = alpha + beta * Mean(k)
alpha36.6387609160405
beta-0.0912395398620945
S.D.0.0214007262122685
T-STAT-4.26338522146922
p-value0.00798901223225552

\begin{tabular}{lllllllll}
\hline
Regression: S.E.(k) = alpha + beta * Mean(k) \tabularnewline
alpha & 36.6387609160405 \tabularnewline
beta & -0.0912395398620945 \tabularnewline
S.D. & 0.0214007262122685 \tabularnewline
T-STAT & -4.26338522146922 \tabularnewline
p-value & 0.00798901223225552 \tabularnewline
\hline
\end{tabular}
%Source: https://freestatistics.org/blog/index.php?pk=78793&T=2

[TABLE]
[ROW][C]Regression: S.E.(k) = alpha + beta * Mean(k)[/C][/ROW]
[ROW][C]alpha[/C][C]36.6387609160405[/C][/ROW]
[ROW][C]beta[/C][C]-0.0912395398620945[/C][/ROW]
[ROW][C]S.D.[/C][C]0.0214007262122685[/C][/ROW]
[ROW][C]T-STAT[/C][C]-4.26338522146922[/C][/ROW]
[ROW][C]p-value[/C][C]0.00798901223225552[/C][/ROW]
[/TABLE]
Source: https://freestatistics.org/blog/index.php?pk=78793&T=2

Globally Unique Identifier (entire table): ba.freestatistics.org/blog/index.php?pk=78793&T=2

As an alternative you can also use a QR Code:  

The GUIDs for individual cells are displayed in the table below:

Regression: S.E.(k) = alpha + beta * Mean(k)
alpha36.6387609160405
beta-0.0912395398620945
S.D.0.0214007262122685
T-STAT-4.26338522146922
p-value0.00798901223225552


Regression: ln S.E.(k) = alpha + beta * ln Mean(k)
alpha8.63759961006218
beta-1.16099496383562
S.D.0.515468528621146
T-STAT-2.2523100817449
p-value0.0740620885730165
Lambda2.16099496383562

\begin{tabular}{lllllllll}
\hline
Regression: ln S.E.(k) = alpha + beta * ln Mean(k) \tabularnewline
alpha & 8.63759961006218 \tabularnewline
beta & -1.16099496383562 \tabularnewline
S.D. & 0.515468528621146 \tabularnewline
T-STAT & -2.2523100817449 \tabularnewline
p-value & 0.0740620885730165 \tabularnewline
Lambda & 2.16099496383562 \tabularnewline
\hline
\end{tabular}
%Source: https://freestatistics.org/blog/index.php?pk=78793&T=3

[TABLE]
[ROW][C]Regression: ln S.E.(k) = alpha + beta * ln Mean(k)[/C][/ROW]
[ROW][C]alpha[/C][C]8.63759961006218[/C][/ROW]
[ROW][C]beta[/C][C]-1.16099496383562[/C][/ROW]
[ROW][C]S.D.[/C][C]0.515468528621146[/C][/ROW]
[ROW][C]T-STAT[/C][C]-2.2523100817449[/C][/ROW]
[ROW][C]p-value[/C][C]0.0740620885730165[/C][/ROW]
[ROW][C]Lambda[/C][C]2.16099496383562[/C][/ROW]
[/TABLE]
Source: https://freestatistics.org/blog/index.php?pk=78793&T=3

Globally Unique Identifier (entire table): ba.freestatistics.org/blog/index.php?pk=78793&T=3

As an alternative you can also use a QR Code:  

The GUIDs for individual cells are displayed in the table below:

Regression: ln S.E.(k) = alpha + beta * ln Mean(k)
alpha8.63759961006218
beta-1.16099496383562
S.D.0.515468528621146
T-STAT-2.2523100817449
p-value0.0740620885730165
Lambda2.16099496383562


Parameters (Session):
par1 = 12 ;
Parameters (R input):
par1 = 12 ;
R code (references can be found in the software module):
par1 <- as.numeric(par1)
(n <- length(x))
(np <- floor(n / par1))
arr <- array(NA,dim=c(par1,np))
j <- 0
k <- 1
for (i in 1:(np*par1))
{
j = j + 1
arr[j,k] <- x[i]
if (j == par1) {
j = 0
k=k+1
}
}
arr
arr.mean <- array(NA,dim=np)
arr.sd <- array(NA,dim=np)
arr.range <- array(NA,dim=np)
for (j in 1:np)
{
arr.mean[j] <- mean(arr[,j],na.rm=TRUE)
arr.sd[j] <- sd(arr[,j],na.rm=TRUE)
arr.range[j] <- max(arr[,j],na.rm=TRUE) - min(arr[,j],na.rm=TRUE)
}
arr.mean
arr.sd
arr.range
(lm1 <- lm(arr.sd~arr.mean))
(lnlm1 <- lm(log(arr.sd)~log(arr.mean)))
(lm2 <- lm(arr.range~arr.mean))
bitmap(file='test1.png')
plot(arr.mean,arr.sd,main='Standard Deviation-Mean Plot',xlab='mean',ylab='standard deviation')
dev.off()
bitmap(file='test2.png')
plot(arr.mean,arr.range,main='Range-Mean Plot',xlab='mean',ylab='range')
dev.off()
load(file='createtable')
a<-table.start()
a<-table.row.start(a)
a<-table.element(a,'Standard Deviation-Mean Plot',4,TRUE)
a<-table.row.end(a)
a<-table.row.start(a)
a<-table.element(a,'Section',header=TRUE)
a<-table.element(a,'Mean',header=TRUE)
a<-table.element(a,'Standard Deviation',header=TRUE)
a<-table.element(a,'Range',header=TRUE)
a<-table.row.end(a)
for (j in 1:np) {
a<-table.row.start(a)
a<-table.element(a,j,header=TRUE)
a<-table.element(a,arr.mean[j])
a<-table.element(a,arr.sd[j] )
a<-table.element(a,arr.range[j] )
a<-table.row.end(a)
}
a<-table.end(a)
table.save(a,file='mytable.tab')
a<-table.start()
a<-table.row.start(a)
a<-table.element(a,'Regression: S.E.(k) = alpha + beta * Mean(k)',2,TRUE)
a<-table.row.end(a)
a<-table.row.start(a)
a<-table.element(a,'alpha',header=TRUE)
a<-table.element(a,lm1$coefficients[[1]])
a<-table.row.end(a)
a<-table.row.start(a)
a<-table.element(a,'beta',header=TRUE)
a<-table.element(a,lm1$coefficients[[2]])
a<-table.row.end(a)
a<-table.row.start(a)
a<-table.element(a,'S.D.',header=TRUE)
a<-table.element(a,summary(lm1)$coefficients[2,2])
a<-table.row.end(a)
a<-table.row.start(a)
a<-table.element(a,'T-STAT',header=TRUE)
a<-table.element(a,summary(lm1)$coefficients[2,3])
a<-table.row.end(a)
a<-table.row.start(a)
a<-table.element(a,'p-value',header=TRUE)
a<-table.element(a,summary(lm1)$coefficients[2,4])
a<-table.row.end(a)
a<-table.end(a)
table.save(a,file='mytable1.tab')
a<-table.start()
a<-table.row.start(a)
a<-table.element(a,'Regression: ln S.E.(k) = alpha + beta * ln Mean(k)',2,TRUE)
a<-table.row.end(a)
a<-table.row.start(a)
a<-table.element(a,'alpha',header=TRUE)
a<-table.element(a,lnlm1$coefficients[[1]])
a<-table.row.end(a)
a<-table.row.start(a)
a<-table.element(a,'beta',header=TRUE)
a<-table.element(a,lnlm1$coefficients[[2]])
a<-table.row.end(a)
a<-table.row.start(a)
a<-table.element(a,'S.D.',header=TRUE)
a<-table.element(a,summary(lnlm1)$coefficients[2,2])
a<-table.row.end(a)
a<-table.row.start(a)
a<-table.element(a,'T-STAT',header=TRUE)
a<-table.element(a,summary(lnlm1)$coefficients[2,3])
a<-table.row.end(a)
a<-table.row.start(a)
a<-table.element(a,'p-value',header=TRUE)
a<-table.element(a,summary(lnlm1)$coefficients[2,4])
a<-table.row.end(a)
a<-table.row.start(a)
a<-table.element(a,'Lambda',header=TRUE)
a<-table.element(a,1-lnlm1$coefficients[[2]])
a<-table.row.end(a)
a<-table.end(a)
table.save(a,file='mytable2.tab')