Free Statistics

of Irreproducible Research!

Author's title

Author*Unverified author*
R Software Modulerwasp_smp.wasp
Title produced by softwareStandard Deviation-Mean Plot
Date of computationFri, 13 Aug 2010 20:33:49 +0000
Cite this page as followsStatistical Computations at FreeStatistics.org, Office for Research Development and Education, URL https://freestatistics.org/blog/index.php?v=date/2010/Aug/13/t1281731595pg4ma30a23uxjv0.htm/, Retrieved Mon, 06 May 2024 05:26:53 +0000
Statistical Computations at FreeStatistics.org, Office for Research Development and Education, URL https://freestatistics.org/blog/index.php?pk=78760, Retrieved Mon, 06 May 2024 05:26:53 +0000
QR Codes:

Original text written by user:
IsPrivate?No (this computation is public)
User-defined keywordsQuaglia Laura
Estimated Impact101
Family? (F = Feedback message, R = changed R code, M = changed R Module, P = changed Parameters, D = changed Data)
-       [Standard Deviation-Mean Plot] [Tijdreeks A - Sta...] [2010-08-13 20:33:49] [f9e29edf9cfe01f572cce0cb5a360ea2] [Current]
Feedback Forum

Post a new message
Dataseries X:
239
238
237
235
255
254
239
229
230
230
231
233
239
236
231
235
253
257
236
226
226
221
217
219
225
226
225
229
242
252
233
232
225
218
209
211
220
225
215
222
238
246
226
230
222
214
208
203
208
212
199
200
223
225
203
207
195
198
193
189
184
188
180
186
215
212
191
190
180
190
189
181
174
179
165
185
211
209
183
178
170
182
195
188
175
176
162
193
211
207
179
176
167
175
190
173
159
159
147
181
196
199
171
170
156
164
178
155
138
142
113
148
156
158
141
139
119
120
125
102


Summary of computational transaction
Raw Inputview raw input (R code)
Raw Outputview raw output of R engine
Computing time1 seconds
R Server'George Udny Yule' @ 72.249.76.132

\begin{tabular}{lllllllll}
\hline
Summary of computational transaction \tabularnewline
Raw Input & view raw input (R code)  \tabularnewline
Raw Output & view raw output of R engine  \tabularnewline
Computing time & 1 seconds \tabularnewline
R Server & 'George Udny Yule' @ 72.249.76.132 \tabularnewline
\hline
\end{tabular}
%Source: https://freestatistics.org/blog/index.php?pk=78760&T=0

[TABLE]
[ROW][C]Summary of computational transaction[/C][/ROW]
[ROW][C]Raw Input[/C][C]view raw input (R code) [/C][/ROW]
[ROW][C]Raw Output[/C][C]view raw output of R engine [/C][/ROW]
[ROW][C]Computing time[/C][C]1 seconds[/C][/ROW]
[ROW][C]R Server[/C][C]'George Udny Yule' @ 72.249.76.132[/C][/ROW]
[/TABLE]
Source: https://freestatistics.org/blog/index.php?pk=78760&T=0

Globally Unique Identifier (entire table): ba.freestatistics.org/blog/index.php?pk=78760&T=0

As an alternative you can also use a QR Code:  

The GUIDs for individual cells are displayed in the table below:

Summary of computational transaction
Raw Inputview raw input (R code)
Raw Outputview raw output of R engine
Computing time1 seconds
R Server'George Udny Yule' @ 72.249.76.132


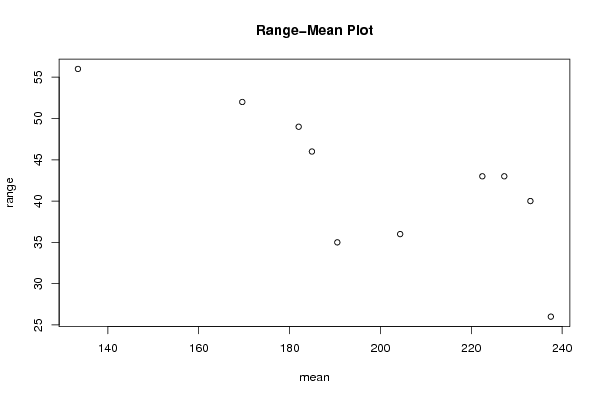
Standard Deviation-Mean Plot
SectionMeanStandard DeviationRange
1237.58.7230103227560826
223312.548089314893540
3227.2512.016087700926843
4222.41666666666712.033727853853443
5204.33333333333311.260012379561536
6190.511.461397661875135
7184.91666666666714.157929569572346
818215.183723342627649
9169.58333333333316.317633146849252
10133.41666666666717.510819166412256

\begin{tabular}{lllllllll}
\hline
Standard Deviation-Mean Plot \tabularnewline
Section & Mean & Standard Deviation & Range \tabularnewline
1 & 237.5 & 8.72301032275608 & 26 \tabularnewline
2 & 233 & 12.5480893148935 & 40 \tabularnewline
3 & 227.25 & 12.0160877009268 & 43 \tabularnewline
4 & 222.416666666667 & 12.0337278538534 & 43 \tabularnewline
5 & 204.333333333333 & 11.2600123795615 & 36 \tabularnewline
6 & 190.5 & 11.4613976618751 & 35 \tabularnewline
7 & 184.916666666667 & 14.1579295695723 & 46 \tabularnewline
8 & 182 & 15.1837233426276 & 49 \tabularnewline
9 & 169.583333333333 & 16.3176331468492 & 52 \tabularnewline
10 & 133.416666666667 & 17.5108191664122 & 56 \tabularnewline
\hline
\end{tabular}
%Source: https://freestatistics.org/blog/index.php?pk=78760&T=1

[TABLE]
[ROW][C]Standard Deviation-Mean Plot[/C][/ROW]
[ROW][C]Section[/C][C]Mean[/C][C]Standard Deviation[/C][C]Range[/C][/ROW]
[ROW][C]1[/C][C]237.5[/C][C]8.72301032275608[/C][C]26[/C][/ROW]
[ROW][C]2[/C][C]233[/C][C]12.5480893148935[/C][C]40[/C][/ROW]
[ROW][C]3[/C][C]227.25[/C][C]12.0160877009268[/C][C]43[/C][/ROW]
[ROW][C]4[/C][C]222.416666666667[/C][C]12.0337278538534[/C][C]43[/C][/ROW]
[ROW][C]5[/C][C]204.333333333333[/C][C]11.2600123795615[/C][C]36[/C][/ROW]
[ROW][C]6[/C][C]190.5[/C][C]11.4613976618751[/C][C]35[/C][/ROW]
[ROW][C]7[/C][C]184.916666666667[/C][C]14.1579295695723[/C][C]46[/C][/ROW]
[ROW][C]8[/C][C]182[/C][C]15.1837233426276[/C][C]49[/C][/ROW]
[ROW][C]9[/C][C]169.583333333333[/C][C]16.3176331468492[/C][C]52[/C][/ROW]
[ROW][C]10[/C][C]133.416666666667[/C][C]17.5108191664122[/C][C]56[/C][/ROW]
[/TABLE]
Source: https://freestatistics.org/blog/index.php?pk=78760&T=1

Globally Unique Identifier (entire table): ba.freestatistics.org/blog/index.php?pk=78760&T=1

As an alternative you can also use a QR Code:  

The GUIDs for individual cells are displayed in the table below:

Standard Deviation-Mean Plot
SectionMeanStandard DeviationRange
1237.58.7230103227560826
223312.548089314893540
3227.2512.016087700926843
4222.41666666666712.033727853853443
5204.33333333333311.260012379561536
6190.511.461397661875135
7184.91666666666714.157929569572346
818215.183723342627649
9169.58333333333316.317633146849252
10133.41666666666717.510819166412256


Regression: S.E.(k) = alpha + beta * Mean(k)
alpha26.8389695290393
beta-0.0691098357602246
S.D.0.0146011956492841
T-STAT-4.73316277791354
p-value0.00147689780827552

\begin{tabular}{lllllllll}
\hline
Regression: S.E.(k) = alpha + beta * Mean(k) \tabularnewline
alpha & 26.8389695290393 \tabularnewline
beta & -0.0691098357602246 \tabularnewline
S.D. & 0.0146011956492841 \tabularnewline
T-STAT & -4.73316277791354 \tabularnewline
p-value & 0.00147689780827552 \tabularnewline
\hline
\end{tabular}
%Source: https://freestatistics.org/blog/index.php?pk=78760&T=2

[TABLE]
[ROW][C]Regression: S.E.(k) = alpha + beta * Mean(k)[/C][/ROW]
[ROW][C]alpha[/C][C]26.8389695290393[/C][/ROW]
[ROW][C]beta[/C][C]-0.0691098357602246[/C][/ROW]
[ROW][C]S.D.[/C][C]0.0146011956492841[/C][/ROW]
[ROW][C]T-STAT[/C][C]-4.73316277791354[/C][/ROW]
[ROW][C]p-value[/C][C]0.00147689780827552[/C][/ROW]
[/TABLE]
Source: https://freestatistics.org/blog/index.php?pk=78760&T=2

Globally Unique Identifier (entire table): ba.freestatistics.org/blog/index.php?pk=78760&T=2

As an alternative you can also use a QR Code:  

The GUIDs for individual cells are displayed in the table below:

Regression: S.E.(k) = alpha + beta * Mean(k)
alpha26.8389695290393
beta-0.0691098357602246
S.D.0.0146011956492841
T-STAT-4.73316277791354
p-value0.00147689780827552


Regression: ln S.E.(k) = alpha + beta * ln Mean(k)
alpha7.56625548459275
beta-0.949505523919863
S.D.0.232352413864419
T-STAT-4.08648874409333
p-value0.0035025578694432
Lambda1.94950552391986

\begin{tabular}{lllllllll}
\hline
Regression: ln S.E.(k) = alpha + beta * ln Mean(k) \tabularnewline
alpha & 7.56625548459275 \tabularnewline
beta & -0.949505523919863 \tabularnewline
S.D. & 0.232352413864419 \tabularnewline
T-STAT & -4.08648874409333 \tabularnewline
p-value & 0.0035025578694432 \tabularnewline
Lambda & 1.94950552391986 \tabularnewline
\hline
\end{tabular}
%Source: https://freestatistics.org/blog/index.php?pk=78760&T=3

[TABLE]
[ROW][C]Regression: ln S.E.(k) = alpha + beta * ln Mean(k)[/C][/ROW]
[ROW][C]alpha[/C][C]7.56625548459275[/C][/ROW]
[ROW][C]beta[/C][C]-0.949505523919863[/C][/ROW]
[ROW][C]S.D.[/C][C]0.232352413864419[/C][/ROW]
[ROW][C]T-STAT[/C][C]-4.08648874409333[/C][/ROW]
[ROW][C]p-value[/C][C]0.0035025578694432[/C][/ROW]
[ROW][C]Lambda[/C][C]1.94950552391986[/C][/ROW]
[/TABLE]
Source: https://freestatistics.org/blog/index.php?pk=78760&T=3

Globally Unique Identifier (entire table): ba.freestatistics.org/blog/index.php?pk=78760&T=3

As an alternative you can also use a QR Code:  

The GUIDs for individual cells are displayed in the table below:

Regression: ln S.E.(k) = alpha + beta * ln Mean(k)
alpha7.56625548459275
beta-0.949505523919863
S.D.0.232352413864419
T-STAT-4.08648874409333
p-value0.0035025578694432
Lambda1.94950552391986


Parameters (Session):
par1 = 12 ;
Parameters (R input):
par1 = 12 ;
R code (references can be found in the software module):
par1 <- as.numeric(par1)
(n <- length(x))
(np <- floor(n / par1))
arr <- array(NA,dim=c(par1,np))
j <- 0
k <- 1
for (i in 1:(np*par1))
{
j = j + 1
arr[j,k] <- x[i]
if (j == par1) {
j = 0
k=k+1
}
}
arr
arr.mean <- array(NA,dim=np)
arr.sd <- array(NA,dim=np)
arr.range <- array(NA,dim=np)
for (j in 1:np)
{
arr.mean[j] <- mean(arr[,j],na.rm=TRUE)
arr.sd[j] <- sd(arr[,j],na.rm=TRUE)
arr.range[j] <- max(arr[,j],na.rm=TRUE) - min(arr[,j],na.rm=TRUE)
}
arr.mean
arr.sd
arr.range
(lm1 <- lm(arr.sd~arr.mean))
(lnlm1 <- lm(log(arr.sd)~log(arr.mean)))
(lm2 <- lm(arr.range~arr.mean))
bitmap(file='test1.png')
plot(arr.mean,arr.sd,main='Standard Deviation-Mean Plot',xlab='mean',ylab='standard deviation')
dev.off()
bitmap(file='test2.png')
plot(arr.mean,arr.range,main='Range-Mean Plot',xlab='mean',ylab='range')
dev.off()
load(file='createtable')
a<-table.start()
a<-table.row.start(a)
a<-table.element(a,'Standard Deviation-Mean Plot',4,TRUE)
a<-table.row.end(a)
a<-table.row.start(a)
a<-table.element(a,'Section',header=TRUE)
a<-table.element(a,'Mean',header=TRUE)
a<-table.element(a,'Standard Deviation',header=TRUE)
a<-table.element(a,'Range',header=TRUE)
a<-table.row.end(a)
for (j in 1:np) {
a<-table.row.start(a)
a<-table.element(a,j,header=TRUE)
a<-table.element(a,arr.mean[j])
a<-table.element(a,arr.sd[j] )
a<-table.element(a,arr.range[j] )
a<-table.row.end(a)
}
a<-table.end(a)
table.save(a,file='mytable.tab')
a<-table.start()
a<-table.row.start(a)
a<-table.element(a,'Regression: S.E.(k) = alpha + beta * Mean(k)',2,TRUE)
a<-table.row.end(a)
a<-table.row.start(a)
a<-table.element(a,'alpha',header=TRUE)
a<-table.element(a,lm1$coefficients[[1]])
a<-table.row.end(a)
a<-table.row.start(a)
a<-table.element(a,'beta',header=TRUE)
a<-table.element(a,lm1$coefficients[[2]])
a<-table.row.end(a)
a<-table.row.start(a)
a<-table.element(a,'S.D.',header=TRUE)
a<-table.element(a,summary(lm1)$coefficients[2,2])
a<-table.row.end(a)
a<-table.row.start(a)
a<-table.element(a,'T-STAT',header=TRUE)
a<-table.element(a,summary(lm1)$coefficients[2,3])
a<-table.row.end(a)
a<-table.row.start(a)
a<-table.element(a,'p-value',header=TRUE)
a<-table.element(a,summary(lm1)$coefficients[2,4])
a<-table.row.end(a)
a<-table.end(a)
table.save(a,file='mytable1.tab')
a<-table.start()
a<-table.row.start(a)
a<-table.element(a,'Regression: ln S.E.(k) = alpha + beta * ln Mean(k)',2,TRUE)
a<-table.row.end(a)
a<-table.row.start(a)
a<-table.element(a,'alpha',header=TRUE)
a<-table.element(a,lnlm1$coefficients[[1]])
a<-table.row.end(a)
a<-table.row.start(a)
a<-table.element(a,'beta',header=TRUE)
a<-table.element(a,lnlm1$coefficients[[2]])
a<-table.row.end(a)
a<-table.row.start(a)
a<-table.element(a,'S.D.',header=TRUE)
a<-table.element(a,summary(lnlm1)$coefficients[2,2])
a<-table.row.end(a)
a<-table.row.start(a)
a<-table.element(a,'T-STAT',header=TRUE)
a<-table.element(a,summary(lnlm1)$coefficients[2,3])
a<-table.row.end(a)
a<-table.row.start(a)
a<-table.element(a,'p-value',header=TRUE)
a<-table.element(a,summary(lnlm1)$coefficients[2,4])
a<-table.row.end(a)
a<-table.row.start(a)
a<-table.element(a,'Lambda',header=TRUE)
a<-table.element(a,1-lnlm1$coefficients[[2]])
a<-table.row.end(a)
a<-table.end(a)
table.save(a,file='mytable2.tab')