Free Statistics

of Irreproducible Research!

Author's title

Author*Unverified author*
R Software Modulerwasp_autocorrelation.wasp
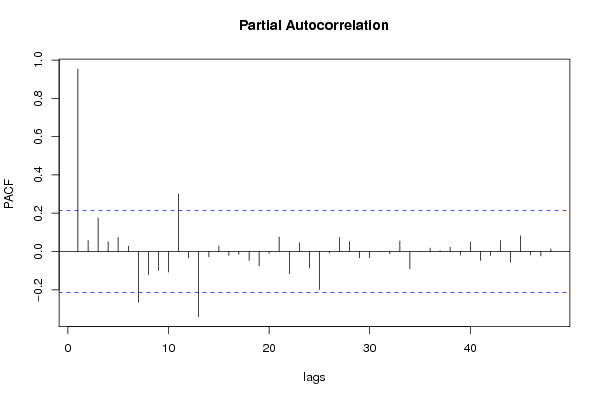
Title produced by software(Partial) Autocorrelation Function
Date of computationThu, 12 Aug 2010 12:58:17 +0000
Cite this page as followsStatistical Computations at FreeStatistics.org, Office for Research Development and Education, URL https://freestatistics.org/blog/index.php?v=date/2010/Aug/12/t1281617869qfppv2c8693zn81.htm/, Retrieved Sat, 04 May 2024 13:10:56 +0000
Statistical Computations at FreeStatistics.org, Office for Research Development and Education, URL https://freestatistics.org/blog/index.php?pk=78698, Retrieved Sat, 04 May 2024 13:10:56 +0000
QR Codes:

Original text written by user:
IsPrivate?No (this computation is public)
User-defined keywordsSchrauwen Nathalie
Estimated Impact139
Family? (F = Feedback message, R = changed R code, M = changed R Module, P = changed Parameters, D = changed Data)
-       [(Partial) Autocorrelation Function] [TIJDREEKS B - STA...] [2010-08-12 12:58:17] [dd2ef098fd65ce7e9f689caa343b799f] [Current]
Feedback Forum

Post a new message
Dataseries X:
162
161
160
158
156
155
156
158
159
159
160
162
168
177
174
169
169
160
168
172
173
175
170
177
187
201
188
179
176
170
179
183
174
177
170
166
171
178
165
162
159
149
153
156
149
150
139
131
141
150
128
124
120
113
120
121
115
119
106
98
106
116
93
94
90
93
100
99
90
91
83
83
92
104
71
69
67
75
86
81
88
87
77
70


Summary of computational transaction
Raw Inputview raw input (R code)
Raw Outputview raw output of R engine
Computing time1 seconds
R Server'Gwilym Jenkins' @ 72.249.127.135

\begin{tabular}{lllllllll}
\hline
Summary of computational transaction \tabularnewline
Raw Input & view raw input (R code)  \tabularnewline
Raw Output & view raw output of R engine  \tabularnewline
Computing time & 1 seconds \tabularnewline
R Server & 'Gwilym Jenkins' @ 72.249.127.135 \tabularnewline
\hline
\end{tabular}
%Source: https://freestatistics.org/blog/index.php?pk=78698&T=0

[TABLE]
[ROW][C]Summary of computational transaction[/C][/ROW]
[ROW][C]Raw Input[/C][C]view raw input (R code) [/C][/ROW]
[ROW][C]Raw Output[/C][C]view raw output of R engine [/C][/ROW]
[ROW][C]Computing time[/C][C]1 seconds[/C][/ROW]
[ROW][C]R Server[/C][C]'Gwilym Jenkins' @ 72.249.127.135[/C][/ROW]
[/TABLE]
Source: https://freestatistics.org/blog/index.php?pk=78698&T=0

Globally Unique Identifier (entire table): ba.freestatistics.org/blog/index.php?pk=78698&T=0

As an alternative you can also use a QR Code:  

The GUIDs for individual cells are displayed in the table below:

Summary of computational transaction
Raw Inputview raw input (R code)
Raw Outputview raw output of R engine
Computing time1 seconds
R Server'Gwilym Jenkins' @ 72.249.127.135


Autocorrelation Function
Time lag kACF(k)T-STATP-value
10.9533418.73750
20.9140998.37790
30.8920728.1760
40.8727457.99880
50.8567947.85260
60.8413747.71130
70.8008477.33990
80.7559196.92810
90.7154296.5570
100.6735796.17350
110.6613486.06140
120.6423095.88690
130.5834945.34780
140.5283674.84263e-06
150.4878654.47141.2e-05
160.4465594.09284.9e-05
170.4151793.80520.000134
180.383253.51250.000359
190.3313573.03690.001592
200.2807962.57350.005911
210.2369972.17210.016333
220.1895251.7370.043024
230.1673441.53370.064427
240.1351111.23830.109525
250.0715860.65610.256776
260.0158710.14550.442348
27-0.021894-0.20070.420725
28-0.057446-0.52650.299962
29-0.084512-0.77460.220386
30-0.114383-1.04830.148746
31-0.160497-1.4710.072517
32-0.199973-1.83280.035189
33-0.232441-2.13040.018033
34-0.264945-2.42830.008653
35-0.274781-2.51840.006843
36-0.292197-2.6780.004453
37-0.331328-3.03670.001593
38-0.361737-3.31540.000676
39-0.378335-3.46750.000415
40-0.390172-3.5760.000291
41-0.395015-3.62040.000251
42-0.40331-3.69640.000194
43-0.42251-3.87240.000106
44-0.434729-3.98447.2e-05
45-0.439598-4.0296.1e-05
46-0.442572-4.05625.6e-05
47-0.430242-3.94328.3e-05
48-0.42566-3.90129.6e-05

\begin{tabular}{lllllllll}
\hline
Autocorrelation Function \tabularnewline
Time lag k & ACF(k) & T-STAT & P-value \tabularnewline
1 & 0.953341 & 8.7375 & 0 \tabularnewline
2 & 0.914099 & 8.3779 & 0 \tabularnewline
3 & 0.892072 & 8.176 & 0 \tabularnewline
4 & 0.872745 & 7.9988 & 0 \tabularnewline
5 & 0.856794 & 7.8526 & 0 \tabularnewline
6 & 0.841374 & 7.7113 & 0 \tabularnewline
7 & 0.800847 & 7.3399 & 0 \tabularnewline
8 & 0.755919 & 6.9281 & 0 \tabularnewline
9 & 0.715429 & 6.557 & 0 \tabularnewline
10 & 0.673579 & 6.1735 & 0 \tabularnewline
11 & 0.661348 & 6.0614 & 0 \tabularnewline
12 & 0.642309 & 5.8869 & 0 \tabularnewline
13 & 0.583494 & 5.3478 & 0 \tabularnewline
14 & 0.528367 & 4.8426 & 3e-06 \tabularnewline
15 & 0.487865 & 4.4714 & 1.2e-05 \tabularnewline
16 & 0.446559 & 4.0928 & 4.9e-05 \tabularnewline
17 & 0.415179 & 3.8052 & 0.000134 \tabularnewline
18 & 0.38325 & 3.5125 & 0.000359 \tabularnewline
19 & 0.331357 & 3.0369 & 0.001592 \tabularnewline
20 & 0.280796 & 2.5735 & 0.005911 \tabularnewline
21 & 0.236997 & 2.1721 & 0.016333 \tabularnewline
22 & 0.189525 & 1.737 & 0.043024 \tabularnewline
23 & 0.167344 & 1.5337 & 0.064427 \tabularnewline
24 & 0.135111 & 1.2383 & 0.109525 \tabularnewline
25 & 0.071586 & 0.6561 & 0.256776 \tabularnewline
26 & 0.015871 & 0.1455 & 0.442348 \tabularnewline
27 & -0.021894 & -0.2007 & 0.420725 \tabularnewline
28 & -0.057446 & -0.5265 & 0.299962 \tabularnewline
29 & -0.084512 & -0.7746 & 0.220386 \tabularnewline
30 & -0.114383 & -1.0483 & 0.148746 \tabularnewline
31 & -0.160497 & -1.471 & 0.072517 \tabularnewline
32 & -0.199973 & -1.8328 & 0.035189 \tabularnewline
33 & -0.232441 & -2.1304 & 0.018033 \tabularnewline
34 & -0.264945 & -2.4283 & 0.008653 \tabularnewline
35 & -0.274781 & -2.5184 & 0.006843 \tabularnewline
36 & -0.292197 & -2.678 & 0.004453 \tabularnewline
37 & -0.331328 & -3.0367 & 0.001593 \tabularnewline
38 & -0.361737 & -3.3154 & 0.000676 \tabularnewline
39 & -0.378335 & -3.4675 & 0.000415 \tabularnewline
40 & -0.390172 & -3.576 & 0.000291 \tabularnewline
41 & -0.395015 & -3.6204 & 0.000251 \tabularnewline
42 & -0.40331 & -3.6964 & 0.000194 \tabularnewline
43 & -0.42251 & -3.8724 & 0.000106 \tabularnewline
44 & -0.434729 & -3.9844 & 7.2e-05 \tabularnewline
45 & -0.439598 & -4.029 & 6.1e-05 \tabularnewline
46 & -0.442572 & -4.0562 & 5.6e-05 \tabularnewline
47 & -0.430242 & -3.9432 & 8.3e-05 \tabularnewline
48 & -0.42566 & -3.9012 & 9.6e-05 \tabularnewline
\hline
\end{tabular}
%Source: https://freestatistics.org/blog/index.php?pk=78698&T=1

[TABLE]
[ROW][C]Autocorrelation Function[/C][/ROW]
[ROW][C]Time lag k[/C][C]ACF(k)[/C][C]T-STAT[/C][C]P-value[/C][/ROW]
[ROW][C]1[/C][C]0.953341[/C][C]8.7375[/C][C]0[/C][/ROW]
[ROW][C]2[/C][C]0.914099[/C][C]8.3779[/C][C]0[/C][/ROW]
[ROW][C]3[/C][C]0.892072[/C][C]8.176[/C][C]0[/C][/ROW]
[ROW][C]4[/C][C]0.872745[/C][C]7.9988[/C][C]0[/C][/ROW]
[ROW][C]5[/C][C]0.856794[/C][C]7.8526[/C][C]0[/C][/ROW]
[ROW][C]6[/C][C]0.841374[/C][C]7.7113[/C][C]0[/C][/ROW]
[ROW][C]7[/C][C]0.800847[/C][C]7.3399[/C][C]0[/C][/ROW]
[ROW][C]8[/C][C]0.755919[/C][C]6.9281[/C][C]0[/C][/ROW]
[ROW][C]9[/C][C]0.715429[/C][C]6.557[/C][C]0[/C][/ROW]
[ROW][C]10[/C][C]0.673579[/C][C]6.1735[/C][C]0[/C][/ROW]
[ROW][C]11[/C][C]0.661348[/C][C]6.0614[/C][C]0[/C][/ROW]
[ROW][C]12[/C][C]0.642309[/C][C]5.8869[/C][C]0[/C][/ROW]
[ROW][C]13[/C][C]0.583494[/C][C]5.3478[/C][C]0[/C][/ROW]
[ROW][C]14[/C][C]0.528367[/C][C]4.8426[/C][C]3e-06[/C][/ROW]
[ROW][C]15[/C][C]0.487865[/C][C]4.4714[/C][C]1.2e-05[/C][/ROW]
[ROW][C]16[/C][C]0.446559[/C][C]4.0928[/C][C]4.9e-05[/C][/ROW]
[ROW][C]17[/C][C]0.415179[/C][C]3.8052[/C][C]0.000134[/C][/ROW]
[ROW][C]18[/C][C]0.38325[/C][C]3.5125[/C][C]0.000359[/C][/ROW]
[ROW][C]19[/C][C]0.331357[/C][C]3.0369[/C][C]0.001592[/C][/ROW]
[ROW][C]20[/C][C]0.280796[/C][C]2.5735[/C][C]0.005911[/C][/ROW]
[ROW][C]21[/C][C]0.236997[/C][C]2.1721[/C][C]0.016333[/C][/ROW]
[ROW][C]22[/C][C]0.189525[/C][C]1.737[/C][C]0.043024[/C][/ROW]
[ROW][C]23[/C][C]0.167344[/C][C]1.5337[/C][C]0.064427[/C][/ROW]
[ROW][C]24[/C][C]0.135111[/C][C]1.2383[/C][C]0.109525[/C][/ROW]
[ROW][C]25[/C][C]0.071586[/C][C]0.6561[/C][C]0.256776[/C][/ROW]
[ROW][C]26[/C][C]0.015871[/C][C]0.1455[/C][C]0.442348[/C][/ROW]
[ROW][C]27[/C][C]-0.021894[/C][C]-0.2007[/C][C]0.420725[/C][/ROW]
[ROW][C]28[/C][C]-0.057446[/C][C]-0.5265[/C][C]0.299962[/C][/ROW]
[ROW][C]29[/C][C]-0.084512[/C][C]-0.7746[/C][C]0.220386[/C][/ROW]
[ROW][C]30[/C][C]-0.114383[/C][C]-1.0483[/C][C]0.148746[/C][/ROW]
[ROW][C]31[/C][C]-0.160497[/C][C]-1.471[/C][C]0.072517[/C][/ROW]
[ROW][C]32[/C][C]-0.199973[/C][C]-1.8328[/C][C]0.035189[/C][/ROW]
[ROW][C]33[/C][C]-0.232441[/C][C]-2.1304[/C][C]0.018033[/C][/ROW]
[ROW][C]34[/C][C]-0.264945[/C][C]-2.4283[/C][C]0.008653[/C][/ROW]
[ROW][C]35[/C][C]-0.274781[/C][C]-2.5184[/C][C]0.006843[/C][/ROW]
[ROW][C]36[/C][C]-0.292197[/C][C]-2.678[/C][C]0.004453[/C][/ROW]
[ROW][C]37[/C][C]-0.331328[/C][C]-3.0367[/C][C]0.001593[/C][/ROW]
[ROW][C]38[/C][C]-0.361737[/C][C]-3.3154[/C][C]0.000676[/C][/ROW]
[ROW][C]39[/C][C]-0.378335[/C][C]-3.4675[/C][C]0.000415[/C][/ROW]
[ROW][C]40[/C][C]-0.390172[/C][C]-3.576[/C][C]0.000291[/C][/ROW]
[ROW][C]41[/C][C]-0.395015[/C][C]-3.6204[/C][C]0.000251[/C][/ROW]
[ROW][C]42[/C][C]-0.40331[/C][C]-3.6964[/C][C]0.000194[/C][/ROW]
[ROW][C]43[/C][C]-0.42251[/C][C]-3.8724[/C][C]0.000106[/C][/ROW]
[ROW][C]44[/C][C]-0.434729[/C][C]-3.9844[/C][C]7.2e-05[/C][/ROW]
[ROW][C]45[/C][C]-0.439598[/C][C]-4.029[/C][C]6.1e-05[/C][/ROW]
[ROW][C]46[/C][C]-0.442572[/C][C]-4.0562[/C][C]5.6e-05[/C][/ROW]
[ROW][C]47[/C][C]-0.430242[/C][C]-3.9432[/C][C]8.3e-05[/C][/ROW]
[ROW][C]48[/C][C]-0.42566[/C][C]-3.9012[/C][C]9.6e-05[/C][/ROW]
[/TABLE]
Source: https://freestatistics.org/blog/index.php?pk=78698&T=1

Globally Unique Identifier (entire table): ba.freestatistics.org/blog/index.php?pk=78698&T=1

As an alternative you can also use a QR Code:  

The GUIDs for individual cells are displayed in the table below:

Autocorrelation Function
Time lag kACF(k)T-STATP-value
10.9533418.73750
20.9140998.37790
30.8920728.1760
40.8727457.99880
50.8567947.85260
60.8413747.71130
70.8008477.33990
80.7559196.92810
90.7154296.5570
100.6735796.17350
110.6613486.06140
120.6423095.88690
130.5834945.34780
140.5283674.84263e-06
150.4878654.47141.2e-05
160.4465594.09284.9e-05
170.4151793.80520.000134
180.383253.51250.000359
190.3313573.03690.001592
200.2807962.57350.005911
210.2369972.17210.016333
220.1895251.7370.043024
230.1673441.53370.064427
240.1351111.23830.109525
250.0715860.65610.256776
260.0158710.14550.442348
27-0.021894-0.20070.420725
28-0.057446-0.52650.299962
29-0.084512-0.77460.220386
30-0.114383-1.04830.148746
31-0.160497-1.4710.072517
32-0.199973-1.83280.035189
33-0.232441-2.13040.018033
34-0.264945-2.42830.008653
35-0.274781-2.51840.006843
36-0.292197-2.6780.004453
37-0.331328-3.03670.001593
38-0.361737-3.31540.000676
39-0.378335-3.46750.000415
40-0.390172-3.5760.000291
41-0.395015-3.62040.000251
42-0.40331-3.69640.000194
43-0.42251-3.87240.000106
44-0.434729-3.98447.2e-05
45-0.439598-4.0296.1e-05
46-0.442572-4.05625.6e-05
47-0.430242-3.94328.3e-05
48-0.42566-3.90129.6e-05


Partial Autocorrelation Function
Time lag kPACF(k)T-STATP-value
10.9533418.73750
20.0574870.52690.299835
30.175211.60580.056032
40.0510620.4680.3205
50.0732960.67180.251786
60.0279240.25590.399316
7-0.265282-2.43130.008585
8-0.12059-1.10520.136108
9-0.099344-0.91050.182582
10-0.107033-0.9810.164712
110.3006732.75570.00359
12-0.033091-0.30330.38121
13-0.340019-3.11630.001253
14-0.027707-0.25390.400081
150.0294620.270.393901
16-0.020527-0.18810.425611
17-0.013636-0.1250.450419
18-0.047074-0.43140.333626
19-0.075176-0.6890.24636
20-0.009739-0.08930.464545
210.0761940.69830.243449
22-0.115631-1.05980.146142
230.0465010.42620.335531
24-0.08635-0.79140.215468
25-0.198741-1.82150.036046
26-0.007178-0.06580.47385
270.0737430.67590.250492
280.0518670.47540.317879
29-0.032329-0.29630.383867
30-0.032476-0.29760.383354
310.0002140.0020.499218
32-0.012019-0.11020.456274
330.0544160.49870.309637
34-0.090027-0.82510.205824
350.0007650.0070.497213
360.0180490.16540.434504
370.004290.03930.484366
380.0229850.21070.41683
39-0.017622-0.16150.436041
400.0482380.44210.329772
41-0.046352-0.42480.336024
42-0.02038-0.18680.426138
430.0568370.52090.301898
44-0.056086-0.5140.304288
450.082360.75480.226228
46-0.017774-0.16290.435493
47-0.022725-0.20830.417757
480.0135340.1240.450788

\begin{tabular}{lllllllll}
\hline
Partial Autocorrelation Function \tabularnewline
Time lag k & PACF(k) & T-STAT & P-value \tabularnewline
1 & 0.953341 & 8.7375 & 0 \tabularnewline
2 & 0.057487 & 0.5269 & 0.299835 \tabularnewline
3 & 0.17521 & 1.6058 & 0.056032 \tabularnewline
4 & 0.051062 & 0.468 & 0.3205 \tabularnewline
5 & 0.073296 & 0.6718 & 0.251786 \tabularnewline
6 & 0.027924 & 0.2559 & 0.399316 \tabularnewline
7 & -0.265282 & -2.4313 & 0.008585 \tabularnewline
8 & -0.12059 & -1.1052 & 0.136108 \tabularnewline
9 & -0.099344 & -0.9105 & 0.182582 \tabularnewline
10 & -0.107033 & -0.981 & 0.164712 \tabularnewline
11 & 0.300673 & 2.7557 & 0.00359 \tabularnewline
12 & -0.033091 & -0.3033 & 0.38121 \tabularnewline
13 & -0.340019 & -3.1163 & 0.001253 \tabularnewline
14 & -0.027707 & -0.2539 & 0.400081 \tabularnewline
15 & 0.029462 & 0.27 & 0.393901 \tabularnewline
16 & -0.020527 & -0.1881 & 0.425611 \tabularnewline
17 & -0.013636 & -0.125 & 0.450419 \tabularnewline
18 & -0.047074 & -0.4314 & 0.333626 \tabularnewline
19 & -0.075176 & -0.689 & 0.24636 \tabularnewline
20 & -0.009739 & -0.0893 & 0.464545 \tabularnewline
21 & 0.076194 & 0.6983 & 0.243449 \tabularnewline
22 & -0.115631 & -1.0598 & 0.146142 \tabularnewline
23 & 0.046501 & 0.4262 & 0.335531 \tabularnewline
24 & -0.08635 & -0.7914 & 0.215468 \tabularnewline
25 & -0.198741 & -1.8215 & 0.036046 \tabularnewline
26 & -0.007178 & -0.0658 & 0.47385 \tabularnewline
27 & 0.073743 & 0.6759 & 0.250492 \tabularnewline
28 & 0.051867 & 0.4754 & 0.317879 \tabularnewline
29 & -0.032329 & -0.2963 & 0.383867 \tabularnewline
30 & -0.032476 & -0.2976 & 0.383354 \tabularnewline
31 & 0.000214 & 0.002 & 0.499218 \tabularnewline
32 & -0.012019 & -0.1102 & 0.456274 \tabularnewline
33 & 0.054416 & 0.4987 & 0.309637 \tabularnewline
34 & -0.090027 & -0.8251 & 0.205824 \tabularnewline
35 & 0.000765 & 0.007 & 0.497213 \tabularnewline
36 & 0.018049 & 0.1654 & 0.434504 \tabularnewline
37 & 0.00429 & 0.0393 & 0.484366 \tabularnewline
38 & 0.022985 & 0.2107 & 0.41683 \tabularnewline
39 & -0.017622 & -0.1615 & 0.436041 \tabularnewline
40 & 0.048238 & 0.4421 & 0.329772 \tabularnewline
41 & -0.046352 & -0.4248 & 0.336024 \tabularnewline
42 & -0.02038 & -0.1868 & 0.426138 \tabularnewline
43 & 0.056837 & 0.5209 & 0.301898 \tabularnewline
44 & -0.056086 & -0.514 & 0.304288 \tabularnewline
45 & 0.08236 & 0.7548 & 0.226228 \tabularnewline
46 & -0.017774 & -0.1629 & 0.435493 \tabularnewline
47 & -0.022725 & -0.2083 & 0.417757 \tabularnewline
48 & 0.013534 & 0.124 & 0.450788 \tabularnewline
\hline
\end{tabular}
%Source: https://freestatistics.org/blog/index.php?pk=78698&T=2

[TABLE]
[ROW][C]Partial Autocorrelation Function[/C][/ROW]
[ROW][C]Time lag k[/C][C]PACF(k)[/C][C]T-STAT[/C][C]P-value[/C][/ROW]
[ROW][C]1[/C][C]0.953341[/C][C]8.7375[/C][C]0[/C][/ROW]
[ROW][C]2[/C][C]0.057487[/C][C]0.5269[/C][C]0.299835[/C][/ROW]
[ROW][C]3[/C][C]0.17521[/C][C]1.6058[/C][C]0.056032[/C][/ROW]
[ROW][C]4[/C][C]0.051062[/C][C]0.468[/C][C]0.3205[/C][/ROW]
[ROW][C]5[/C][C]0.073296[/C][C]0.6718[/C][C]0.251786[/C][/ROW]
[ROW][C]6[/C][C]0.027924[/C][C]0.2559[/C][C]0.399316[/C][/ROW]
[ROW][C]7[/C][C]-0.265282[/C][C]-2.4313[/C][C]0.008585[/C][/ROW]
[ROW][C]8[/C][C]-0.12059[/C][C]-1.1052[/C][C]0.136108[/C][/ROW]
[ROW][C]9[/C][C]-0.099344[/C][C]-0.9105[/C][C]0.182582[/C][/ROW]
[ROW][C]10[/C][C]-0.107033[/C][C]-0.981[/C][C]0.164712[/C][/ROW]
[ROW][C]11[/C][C]0.300673[/C][C]2.7557[/C][C]0.00359[/C][/ROW]
[ROW][C]12[/C][C]-0.033091[/C][C]-0.3033[/C][C]0.38121[/C][/ROW]
[ROW][C]13[/C][C]-0.340019[/C][C]-3.1163[/C][C]0.001253[/C][/ROW]
[ROW][C]14[/C][C]-0.027707[/C][C]-0.2539[/C][C]0.400081[/C][/ROW]
[ROW][C]15[/C][C]0.029462[/C][C]0.27[/C][C]0.393901[/C][/ROW]
[ROW][C]16[/C][C]-0.020527[/C][C]-0.1881[/C][C]0.425611[/C][/ROW]
[ROW][C]17[/C][C]-0.013636[/C][C]-0.125[/C][C]0.450419[/C][/ROW]
[ROW][C]18[/C][C]-0.047074[/C][C]-0.4314[/C][C]0.333626[/C][/ROW]
[ROW][C]19[/C][C]-0.075176[/C][C]-0.689[/C][C]0.24636[/C][/ROW]
[ROW][C]20[/C][C]-0.009739[/C][C]-0.0893[/C][C]0.464545[/C][/ROW]
[ROW][C]21[/C][C]0.076194[/C][C]0.6983[/C][C]0.243449[/C][/ROW]
[ROW][C]22[/C][C]-0.115631[/C][C]-1.0598[/C][C]0.146142[/C][/ROW]
[ROW][C]23[/C][C]0.046501[/C][C]0.4262[/C][C]0.335531[/C][/ROW]
[ROW][C]24[/C][C]-0.08635[/C][C]-0.7914[/C][C]0.215468[/C][/ROW]
[ROW][C]25[/C][C]-0.198741[/C][C]-1.8215[/C][C]0.036046[/C][/ROW]
[ROW][C]26[/C][C]-0.007178[/C][C]-0.0658[/C][C]0.47385[/C][/ROW]
[ROW][C]27[/C][C]0.073743[/C][C]0.6759[/C][C]0.250492[/C][/ROW]
[ROW][C]28[/C][C]0.051867[/C][C]0.4754[/C][C]0.317879[/C][/ROW]
[ROW][C]29[/C][C]-0.032329[/C][C]-0.2963[/C][C]0.383867[/C][/ROW]
[ROW][C]30[/C][C]-0.032476[/C][C]-0.2976[/C][C]0.383354[/C][/ROW]
[ROW][C]31[/C][C]0.000214[/C][C]0.002[/C][C]0.499218[/C][/ROW]
[ROW][C]32[/C][C]-0.012019[/C][C]-0.1102[/C][C]0.456274[/C][/ROW]
[ROW][C]33[/C][C]0.054416[/C][C]0.4987[/C][C]0.309637[/C][/ROW]
[ROW][C]34[/C][C]-0.090027[/C][C]-0.8251[/C][C]0.205824[/C][/ROW]
[ROW][C]35[/C][C]0.000765[/C][C]0.007[/C][C]0.497213[/C][/ROW]
[ROW][C]36[/C][C]0.018049[/C][C]0.1654[/C][C]0.434504[/C][/ROW]
[ROW][C]37[/C][C]0.00429[/C][C]0.0393[/C][C]0.484366[/C][/ROW]
[ROW][C]38[/C][C]0.022985[/C][C]0.2107[/C][C]0.41683[/C][/ROW]
[ROW][C]39[/C][C]-0.017622[/C][C]-0.1615[/C][C]0.436041[/C][/ROW]
[ROW][C]40[/C][C]0.048238[/C][C]0.4421[/C][C]0.329772[/C][/ROW]
[ROW][C]41[/C][C]-0.046352[/C][C]-0.4248[/C][C]0.336024[/C][/ROW]
[ROW][C]42[/C][C]-0.02038[/C][C]-0.1868[/C][C]0.426138[/C][/ROW]
[ROW][C]43[/C][C]0.056837[/C][C]0.5209[/C][C]0.301898[/C][/ROW]
[ROW][C]44[/C][C]-0.056086[/C][C]-0.514[/C][C]0.304288[/C][/ROW]
[ROW][C]45[/C][C]0.08236[/C][C]0.7548[/C][C]0.226228[/C][/ROW]
[ROW][C]46[/C][C]-0.017774[/C][C]-0.1629[/C][C]0.435493[/C][/ROW]
[ROW][C]47[/C][C]-0.022725[/C][C]-0.2083[/C][C]0.417757[/C][/ROW]
[ROW][C]48[/C][C]0.013534[/C][C]0.124[/C][C]0.450788[/C][/ROW]
[/TABLE]
Source: https://freestatistics.org/blog/index.php?pk=78698&T=2

Globally Unique Identifier (entire table): ba.freestatistics.org/blog/index.php?pk=78698&T=2

As an alternative you can also use a QR Code:  

The GUIDs for individual cells are displayed in the table below:

Partial Autocorrelation Function
Time lag kPACF(k)T-STATP-value
10.9533418.73750
20.0574870.52690.299835
30.175211.60580.056032
40.0510620.4680.3205
50.0732960.67180.251786
60.0279240.25590.399316
7-0.265282-2.43130.008585
8-0.12059-1.10520.136108
9-0.099344-0.91050.182582
10-0.107033-0.9810.164712
110.3006732.75570.00359
12-0.033091-0.30330.38121
13-0.340019-3.11630.001253
14-0.027707-0.25390.400081
150.0294620.270.393901
16-0.020527-0.18810.425611
17-0.013636-0.1250.450419
18-0.047074-0.43140.333626
19-0.075176-0.6890.24636
20-0.009739-0.08930.464545
210.0761940.69830.243449
22-0.115631-1.05980.146142
230.0465010.42620.335531
24-0.08635-0.79140.215468
25-0.198741-1.82150.036046
26-0.007178-0.06580.47385
270.0737430.67590.250492
280.0518670.47540.317879
29-0.032329-0.29630.383867
30-0.032476-0.29760.383354
310.0002140.0020.499218
32-0.012019-0.11020.456274
330.0544160.49870.309637
34-0.090027-0.82510.205824
350.0007650.0070.497213
360.0180490.16540.434504
370.004290.03930.484366
380.0229850.21070.41683
39-0.017622-0.16150.436041
400.0482380.44210.329772
41-0.046352-0.42480.336024
42-0.02038-0.18680.426138
430.0568370.52090.301898
44-0.056086-0.5140.304288
450.082360.75480.226228
46-0.017774-0.16290.435493
47-0.022725-0.20830.417757
480.0135340.1240.450788


Parameters (Session):
par1 = 48 ; par2 = 1 ; par3 = 0 ; par4 = 0 ; par5 = 12 ; par6 = White Noise ; par7 = 0.95 ;
Parameters (R input):
par1 = 48 ; par2 = 1 ; par3 = 0 ; par4 = 0 ; par5 = 12 ; par6 = White Noise ; par7 = 0.95 ;
R code (references can be found in the software module):
if (par1 == 'Default') {
par1 = 10*log10(length(x))
} else {
par1 <- as.numeric(par1)
}
par2 <- as.numeric(par2)
par3 <- as.numeric(par3)
par4 <- as.numeric(par4)
par5 <- as.numeric(par5)
if (par6 == 'White Noise') par6 <- 'white' else par6 <- 'ma'
par7 <- as.numeric(par7)
if (par2 == 0) {
x <- log(x)
} else {
x <- (x ^ par2 - 1) / par2
}
if (par3 > 0) x <- diff(x,lag=1,difference=par3)
if (par4 > 0) x <- diff(x,lag=par5,difference=par4)
bitmap(file='pic1.png')
racf <- acf(x, par1, main='Autocorrelation', xlab='time lag', ylab='ACF', ci.type=par6, ci=par7, sub=paste('(lambda=',par2,', d=',par3,', D=',par4,', CI=', par7, ', CI type=',par6,')',sep=''))
dev.off()
bitmap(file='pic2.png')
rpacf <- pacf(x,par1,main='Partial Autocorrelation',xlab='lags',ylab='PACF')
dev.off()
(myacf <- c(racf$acf))
(mypacf <- c(rpacf$acf))
lengthx <- length(x)
sqrtn <- sqrt(lengthx)
load(file='createtable')
a<-table.start()
a<-table.row.start(a)
a<-table.element(a,'Autocorrelation Function',4,TRUE)
a<-table.row.end(a)
a<-table.row.start(a)
a<-table.element(a,'Time lag k',header=TRUE)
a<-table.element(a,hyperlink('basics.htm','ACF(k)','click here for more information about the Autocorrelation Function'),header=TRUE)
a<-table.element(a,'T-STAT',header=TRUE)
a<-table.element(a,'P-value',header=TRUE)
a<-table.row.end(a)
for (i in 2:(par1+1)) {
a<-table.row.start(a)
a<-table.element(a,i-1,header=TRUE)
a<-table.element(a,round(myacf[i],6))
mytstat <- myacf[i]*sqrtn
a<-table.element(a,round(mytstat,4))
a<-table.element(a,round(1-pt(abs(mytstat),lengthx),6))
a<-table.row.end(a)
}
a<-table.end(a)
table.save(a,file='mytable.tab')
a<-table.start()
a<-table.row.start(a)
a<-table.element(a,'Partial Autocorrelation Function',4,TRUE)
a<-table.row.end(a)
a<-table.row.start(a)
a<-table.element(a,'Time lag k',header=TRUE)
a<-table.element(a,hyperlink('basics.htm','PACF(k)','click here for more information about the Partial Autocorrelation Function'),header=TRUE)
a<-table.element(a,'T-STAT',header=TRUE)
a<-table.element(a,'P-value',header=TRUE)
a<-table.row.end(a)
for (i in 1:par1) {
a<-table.row.start(a)
a<-table.element(a,i,header=TRUE)
a<-table.element(a,round(mypacf[i],6))
mytstat <- mypacf[i]*sqrtn
a<-table.element(a,round(mytstat,4))
a<-table.element(a,round(1-pt(abs(mytstat),lengthx),6))
a<-table.row.end(a)
}
a<-table.end(a)
table.save(a,file='mytable1.tab')