Free Statistics

of Irreproducible Research!

Author's title

Author*Unverified author*
R Software Modulerwasp_autocorrelation.wasp
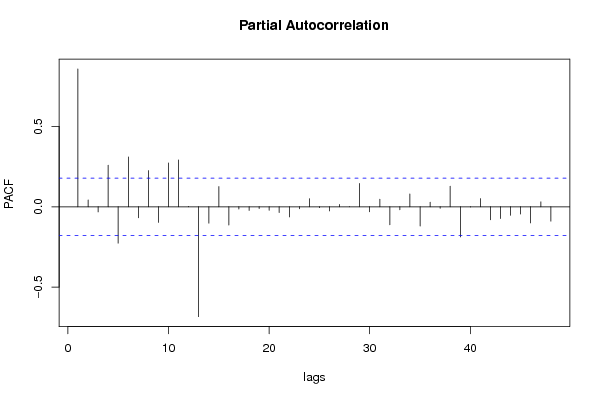
Title produced by software(Partial) Autocorrelation Function
Date of computationTue, 10 Aug 2010 14:25:52 +0000
Cite this page as followsStatistical Computations at FreeStatistics.org, Office for Research Development and Education, URL https://freestatistics.org/blog/index.php?v=date/2010/Aug/10/t1281450479c9whjyk4gr98cwg.htm/, Retrieved Sun, 05 May 2024 06:31:49 +0000
Statistical Computations at FreeStatistics.org, Office for Research Development and Education, URL https://freestatistics.org/blog/index.php?pk=78583, Retrieved Sun, 05 May 2024 06:31:49 +0000
QR Codes:

Original text written by user:
IsPrivate?No (this computation is public)
User-defined keywordsPlatini Olivier
Estimated Impact174
Family? (F = Feedback message, R = changed R code, M = changed R Module, P = changed Parameters, D = changed Data)
-       [(Partial) Autocorrelation Function] [Tijdreeks A - Sta...] [2010-08-10 14:25:52] [49dea061148f13f4e9d1975b9f021cec] [Current]
Feedback Forum

Post a new message
Dataseries X:
94
93
92
90
110
109
94
84
85
85
86
88
93
94
90
91
104
103
88
79
82
88
93
89
94
96
94
92
113
122
107
98
103
110
113
110
123
124
118
117
139
146
134
121
123
122
127
122
139
136
127
123
140
146
138
120
122
115
115
102
119
114
108
102
121
109
102
95
98
92
94
90
113
111
103
90
108
99
95
91
85
72
90
90
114
115
104
93
101
90
79
75
71
61
84
87
107
99
93
74
87
71
67
61
63
52
80
84
102
93
87
72
83
72
66
64
64
47
77
79


Summary of computational transaction
Raw Inputview raw input (R code)
Raw Outputview raw output of R engine
Computing time2 seconds
R Server'RServer@AstonUniversity' @ vre.aston.ac.uk

\begin{tabular}{lllllllll}
\hline
Summary of computational transaction \tabularnewline
Raw Input & view raw input (R code)  \tabularnewline
Raw Output & view raw output of R engine  \tabularnewline
Computing time & 2 seconds \tabularnewline
R Server & 'RServer@AstonUniversity' @ vre.aston.ac.uk \tabularnewline
\hline
\end{tabular}
%Source: https://freestatistics.org/blog/index.php?pk=78583&T=0

[TABLE]
[ROW][C]Summary of computational transaction[/C][/ROW]
[ROW][C]Raw Input[/C][C]view raw input (R code) [/C][/ROW]
[ROW][C]Raw Output[/C][C]view raw output of R engine [/C][/ROW]
[ROW][C]Computing time[/C][C]2 seconds[/C][/ROW]
[ROW][C]R Server[/C][C]'RServer@AstonUniversity' @ vre.aston.ac.uk[/C][/ROW]
[/TABLE]
Source: https://freestatistics.org/blog/index.php?pk=78583&T=0

Globally Unique Identifier (entire table): ba.freestatistics.org/blog/index.php?pk=78583&T=0

As an alternative you can also use a QR Code:  

The GUIDs for individual cells are displayed in the table below:

Summary of computational transaction
Raw Inputview raw input (R code)
Raw Outputview raw output of R engine
Computing time2 seconds
R Server'RServer@AstonUniversity' @ vre.aston.ac.uk


Autocorrelation Function
Time lag kACF(k)T-STATP-value
10.8577539.39620
20.7468618.18150
30.6413027.02510
40.6194466.78570
50.530635.81280
60.5312185.81920
70.4979645.45490
80.5366815.8790
90.5012855.49130
100.549396.01830
110.6022626.59750
120.680897.45880
130.5314585.82180
140.4114874.50768e-06
150.3074213.36760.00051
160.271662.97590.001767
170.1785661.95610.026389
180.1773231.94250.027211
190.1486521.62840.053031
200.1701731.86410.032372
210.1188681.30210.097681
220.1406611.54090.062992
230.1696681.85860.032766
240.2240972.45490.007764
250.0970841.06350.144846
26-0.000857-0.00940.496262
27-0.078145-0.8560.196842
28-0.100156-1.09720.137385
29-0.160333-1.75640.040789
30-0.135632-1.48580.069981
31-0.128009-1.40230.081708
32-0.103565-1.13450.129423
33-0.147944-1.62060.05386
34-0.128306-1.40550.081225
35-0.104332-1.14290.127677
36-0.057979-0.63510.263276
37-0.151283-1.65720.050043
38-0.208909-2.28850.011929
39-0.260506-2.85370.002546
40-0.266692-2.92150.002082
41-0.298949-3.27480.000691
42-0.253075-2.77230.003227
43-0.232833-2.55060.006007
44-0.21117-2.31330.011206
45-0.260279-2.85120.002564
46-0.254284-2.78550.003106
47-0.244868-2.68240.00417
48-0.218001-2.38810.009248

\begin{tabular}{lllllllll}
\hline
Autocorrelation Function \tabularnewline
Time lag k & ACF(k) & T-STAT & P-value \tabularnewline
1 & 0.857753 & 9.3962 & 0 \tabularnewline
2 & 0.746861 & 8.1815 & 0 \tabularnewline
3 & 0.641302 & 7.0251 & 0 \tabularnewline
4 & 0.619446 & 6.7857 & 0 \tabularnewline
5 & 0.53063 & 5.8128 & 0 \tabularnewline
6 & 0.531218 & 5.8192 & 0 \tabularnewline
7 & 0.497964 & 5.4549 & 0 \tabularnewline
8 & 0.536681 & 5.879 & 0 \tabularnewline
9 & 0.501285 & 5.4913 & 0 \tabularnewline
10 & 0.54939 & 6.0183 & 0 \tabularnewline
11 & 0.602262 & 6.5975 & 0 \tabularnewline
12 & 0.68089 & 7.4588 & 0 \tabularnewline
13 & 0.531458 & 5.8218 & 0 \tabularnewline
14 & 0.411487 & 4.5076 & 8e-06 \tabularnewline
15 & 0.307421 & 3.3676 & 0.00051 \tabularnewline
16 & 0.27166 & 2.9759 & 0.001767 \tabularnewline
17 & 0.178566 & 1.9561 & 0.026389 \tabularnewline
18 & 0.177323 & 1.9425 & 0.027211 \tabularnewline
19 & 0.148652 & 1.6284 & 0.053031 \tabularnewline
20 & 0.170173 & 1.8641 & 0.032372 \tabularnewline
21 & 0.118868 & 1.3021 & 0.097681 \tabularnewline
22 & 0.140661 & 1.5409 & 0.062992 \tabularnewline
23 & 0.169668 & 1.8586 & 0.032766 \tabularnewline
24 & 0.224097 & 2.4549 & 0.007764 \tabularnewline
25 & 0.097084 & 1.0635 & 0.144846 \tabularnewline
26 & -0.000857 & -0.0094 & 0.496262 \tabularnewline
27 & -0.078145 & -0.856 & 0.196842 \tabularnewline
28 & -0.100156 & -1.0972 & 0.137385 \tabularnewline
29 & -0.160333 & -1.7564 & 0.040789 \tabularnewline
30 & -0.135632 & -1.4858 & 0.069981 \tabularnewline
31 & -0.128009 & -1.4023 & 0.081708 \tabularnewline
32 & -0.103565 & -1.1345 & 0.129423 \tabularnewline
33 & -0.147944 & -1.6206 & 0.05386 \tabularnewline
34 & -0.128306 & -1.4055 & 0.081225 \tabularnewline
35 & -0.104332 & -1.1429 & 0.127677 \tabularnewline
36 & -0.057979 & -0.6351 & 0.263276 \tabularnewline
37 & -0.151283 & -1.6572 & 0.050043 \tabularnewline
38 & -0.208909 & -2.2885 & 0.011929 \tabularnewline
39 & -0.260506 & -2.8537 & 0.002546 \tabularnewline
40 & -0.266692 & -2.9215 & 0.002082 \tabularnewline
41 & -0.298949 & -3.2748 & 0.000691 \tabularnewline
42 & -0.253075 & -2.7723 & 0.003227 \tabularnewline
43 & -0.232833 & -2.5506 & 0.006007 \tabularnewline
44 & -0.21117 & -2.3133 & 0.011206 \tabularnewline
45 & -0.260279 & -2.8512 & 0.002564 \tabularnewline
46 & -0.254284 & -2.7855 & 0.003106 \tabularnewline
47 & -0.244868 & -2.6824 & 0.00417 \tabularnewline
48 & -0.218001 & -2.3881 & 0.009248 \tabularnewline
\hline
\end{tabular}
%Source: https://freestatistics.org/blog/index.php?pk=78583&T=1

[TABLE]
[ROW][C]Autocorrelation Function[/C][/ROW]
[ROW][C]Time lag k[/C][C]ACF(k)[/C][C]T-STAT[/C][C]P-value[/C][/ROW]
[ROW][C]1[/C][C]0.857753[/C][C]9.3962[/C][C]0[/C][/ROW]
[ROW][C]2[/C][C]0.746861[/C][C]8.1815[/C][C]0[/C][/ROW]
[ROW][C]3[/C][C]0.641302[/C][C]7.0251[/C][C]0[/C][/ROW]
[ROW][C]4[/C][C]0.619446[/C][C]6.7857[/C][C]0[/C][/ROW]
[ROW][C]5[/C][C]0.53063[/C][C]5.8128[/C][C]0[/C][/ROW]
[ROW][C]6[/C][C]0.531218[/C][C]5.8192[/C][C]0[/C][/ROW]
[ROW][C]7[/C][C]0.497964[/C][C]5.4549[/C][C]0[/C][/ROW]
[ROW][C]8[/C][C]0.536681[/C][C]5.879[/C][C]0[/C][/ROW]
[ROW][C]9[/C][C]0.501285[/C][C]5.4913[/C][C]0[/C][/ROW]
[ROW][C]10[/C][C]0.54939[/C][C]6.0183[/C][C]0[/C][/ROW]
[ROW][C]11[/C][C]0.602262[/C][C]6.5975[/C][C]0[/C][/ROW]
[ROW][C]12[/C][C]0.68089[/C][C]7.4588[/C][C]0[/C][/ROW]
[ROW][C]13[/C][C]0.531458[/C][C]5.8218[/C][C]0[/C][/ROW]
[ROW][C]14[/C][C]0.411487[/C][C]4.5076[/C][C]8e-06[/C][/ROW]
[ROW][C]15[/C][C]0.307421[/C][C]3.3676[/C][C]0.00051[/C][/ROW]
[ROW][C]16[/C][C]0.27166[/C][C]2.9759[/C][C]0.001767[/C][/ROW]
[ROW][C]17[/C][C]0.178566[/C][C]1.9561[/C][C]0.026389[/C][/ROW]
[ROW][C]18[/C][C]0.177323[/C][C]1.9425[/C][C]0.027211[/C][/ROW]
[ROW][C]19[/C][C]0.148652[/C][C]1.6284[/C][C]0.053031[/C][/ROW]
[ROW][C]20[/C][C]0.170173[/C][C]1.8641[/C][C]0.032372[/C][/ROW]
[ROW][C]21[/C][C]0.118868[/C][C]1.3021[/C][C]0.097681[/C][/ROW]
[ROW][C]22[/C][C]0.140661[/C][C]1.5409[/C][C]0.062992[/C][/ROW]
[ROW][C]23[/C][C]0.169668[/C][C]1.8586[/C][C]0.032766[/C][/ROW]
[ROW][C]24[/C][C]0.224097[/C][C]2.4549[/C][C]0.007764[/C][/ROW]
[ROW][C]25[/C][C]0.097084[/C][C]1.0635[/C][C]0.144846[/C][/ROW]
[ROW][C]26[/C][C]-0.000857[/C][C]-0.0094[/C][C]0.496262[/C][/ROW]
[ROW][C]27[/C][C]-0.078145[/C][C]-0.856[/C][C]0.196842[/C][/ROW]
[ROW][C]28[/C][C]-0.100156[/C][C]-1.0972[/C][C]0.137385[/C][/ROW]
[ROW][C]29[/C][C]-0.160333[/C][C]-1.7564[/C][C]0.040789[/C][/ROW]
[ROW][C]30[/C][C]-0.135632[/C][C]-1.4858[/C][C]0.069981[/C][/ROW]
[ROW][C]31[/C][C]-0.128009[/C][C]-1.4023[/C][C]0.081708[/C][/ROW]
[ROW][C]32[/C][C]-0.103565[/C][C]-1.1345[/C][C]0.129423[/C][/ROW]
[ROW][C]33[/C][C]-0.147944[/C][C]-1.6206[/C][C]0.05386[/C][/ROW]
[ROW][C]34[/C][C]-0.128306[/C][C]-1.4055[/C][C]0.081225[/C][/ROW]
[ROW][C]35[/C][C]-0.104332[/C][C]-1.1429[/C][C]0.127677[/C][/ROW]
[ROW][C]36[/C][C]-0.057979[/C][C]-0.6351[/C][C]0.263276[/C][/ROW]
[ROW][C]37[/C][C]-0.151283[/C][C]-1.6572[/C][C]0.050043[/C][/ROW]
[ROW][C]38[/C][C]-0.208909[/C][C]-2.2885[/C][C]0.011929[/C][/ROW]
[ROW][C]39[/C][C]-0.260506[/C][C]-2.8537[/C][C]0.002546[/C][/ROW]
[ROW][C]40[/C][C]-0.266692[/C][C]-2.9215[/C][C]0.002082[/C][/ROW]
[ROW][C]41[/C][C]-0.298949[/C][C]-3.2748[/C][C]0.000691[/C][/ROW]
[ROW][C]42[/C][C]-0.253075[/C][C]-2.7723[/C][C]0.003227[/C][/ROW]
[ROW][C]43[/C][C]-0.232833[/C][C]-2.5506[/C][C]0.006007[/C][/ROW]
[ROW][C]44[/C][C]-0.21117[/C][C]-2.3133[/C][C]0.011206[/C][/ROW]
[ROW][C]45[/C][C]-0.260279[/C][C]-2.8512[/C][C]0.002564[/C][/ROW]
[ROW][C]46[/C][C]-0.254284[/C][C]-2.7855[/C][C]0.003106[/C][/ROW]
[ROW][C]47[/C][C]-0.244868[/C][C]-2.6824[/C][C]0.00417[/C][/ROW]
[ROW][C]48[/C][C]-0.218001[/C][C]-2.3881[/C][C]0.009248[/C][/ROW]
[/TABLE]
Source: https://freestatistics.org/blog/index.php?pk=78583&T=1

Globally Unique Identifier (entire table): ba.freestatistics.org/blog/index.php?pk=78583&T=1

As an alternative you can also use a QR Code:  

The GUIDs for individual cells are displayed in the table below:

Autocorrelation Function
Time lag kACF(k)T-STATP-value
10.8577539.39620
20.7468618.18150
30.6413027.02510
40.6194466.78570
50.530635.81280
60.5312185.81920
70.4979645.45490
80.5366815.8790
90.5012855.49130
100.549396.01830
110.6022626.59750
120.680897.45880
130.5314585.82180
140.4114874.50768e-06
150.3074213.36760.00051
160.271662.97590.001767
170.1785661.95610.026389
180.1773231.94250.027211
190.1486521.62840.053031
200.1701731.86410.032372
210.1188681.30210.097681
220.1406611.54090.062992
230.1696681.85860.032766
240.2240972.45490.007764
250.0970841.06350.144846
26-0.000857-0.00940.496262
27-0.078145-0.8560.196842
28-0.100156-1.09720.137385
29-0.160333-1.75640.040789
30-0.135632-1.48580.069981
31-0.128009-1.40230.081708
32-0.103565-1.13450.129423
33-0.147944-1.62060.05386
34-0.128306-1.40550.081225
35-0.104332-1.14290.127677
36-0.057979-0.63510.263276
37-0.151283-1.65720.050043
38-0.208909-2.28850.011929
39-0.260506-2.85370.002546
40-0.266692-2.92150.002082
41-0.298949-3.27480.000691
42-0.253075-2.77230.003227
43-0.232833-2.55060.006007
44-0.21117-2.31330.011206
45-0.260279-2.85120.002564
46-0.254284-2.78550.003106
47-0.244868-2.68240.00417
48-0.218001-2.38810.009248


Partial Autocorrelation Function
Time lag kPACF(k)T-STATP-value
10.8577539.39620
20.0420830.4610.322817
3-0.032062-0.35120.363019
40.2582222.82870.00274
5-0.226387-2.47990.007264
60.3094413.38980.000474
7-0.068055-0.74550.228712
80.2251662.46660.007527
9-0.097105-1.06370.144792
100.272632.98650.001711
110.2915093.19330.000898
120.001510.01650.493413
13-0.683793-7.49060
14-0.101828-1.11550.133439
150.125721.37720.085508
16-0.114152-1.25050.10678
17-0.013658-0.14960.440661
18-0.022505-0.24650.402847
19-0.01106-0.12120.451884
20-0.021254-0.23280.408147
21-0.035849-0.39270.347618
22-0.063147-0.69170.245218
23-0.012001-0.13150.447814
240.0504460.55260.290779
25-0.005533-0.06060.475884
26-0.025735-0.28190.389249
270.0141760.15530.438428
280.0001770.00190.499227
290.1446941.5850.057794
30-0.031581-0.3460.364993
310.0472730.51790.302757
32-0.1122-1.22910.110722
33-0.019158-0.20990.417063
340.0802470.87910.190561
35-0.11985-1.31290.095862
360.0283340.31040.378404
37-0.00897-0.09830.460945
380.1278511.40050.081966
39-0.187389-2.05270.021136
40-0.001856-0.02030.491907
410.0508010.55650.289454
42-0.080504-0.88190.189803
43-0.073616-0.80640.210798
44-0.053356-0.58450.279995
45-0.045263-0.49580.310459
46-0.100253-1.09820.137153
470.0308070.33750.368176
48-0.089467-0.98010.164513

\begin{tabular}{lllllllll}
\hline
Partial Autocorrelation Function \tabularnewline
Time lag k & PACF(k) & T-STAT & P-value \tabularnewline
1 & 0.857753 & 9.3962 & 0 \tabularnewline
2 & 0.042083 & 0.461 & 0.322817 \tabularnewline
3 & -0.032062 & -0.3512 & 0.363019 \tabularnewline
4 & 0.258222 & 2.8287 & 0.00274 \tabularnewline
5 & -0.226387 & -2.4799 & 0.007264 \tabularnewline
6 & 0.309441 & 3.3898 & 0.000474 \tabularnewline
7 & -0.068055 & -0.7455 & 0.228712 \tabularnewline
8 & 0.225166 & 2.4666 & 0.007527 \tabularnewline
9 & -0.097105 & -1.0637 & 0.144792 \tabularnewline
10 & 0.27263 & 2.9865 & 0.001711 \tabularnewline
11 & 0.291509 & 3.1933 & 0.000898 \tabularnewline
12 & 0.00151 & 0.0165 & 0.493413 \tabularnewline
13 & -0.683793 & -7.4906 & 0 \tabularnewline
14 & -0.101828 & -1.1155 & 0.133439 \tabularnewline
15 & 0.12572 & 1.3772 & 0.085508 \tabularnewline
16 & -0.114152 & -1.2505 & 0.10678 \tabularnewline
17 & -0.013658 & -0.1496 & 0.440661 \tabularnewline
18 & -0.022505 & -0.2465 & 0.402847 \tabularnewline
19 & -0.01106 & -0.1212 & 0.451884 \tabularnewline
20 & -0.021254 & -0.2328 & 0.408147 \tabularnewline
21 & -0.035849 & -0.3927 & 0.347618 \tabularnewline
22 & -0.063147 & -0.6917 & 0.245218 \tabularnewline
23 & -0.012001 & -0.1315 & 0.447814 \tabularnewline
24 & 0.050446 & 0.5526 & 0.290779 \tabularnewline
25 & -0.005533 & -0.0606 & 0.475884 \tabularnewline
26 & -0.025735 & -0.2819 & 0.389249 \tabularnewline
27 & 0.014176 & 0.1553 & 0.438428 \tabularnewline
28 & 0.000177 & 0.0019 & 0.499227 \tabularnewline
29 & 0.144694 & 1.585 & 0.057794 \tabularnewline
30 & -0.031581 & -0.346 & 0.364993 \tabularnewline
31 & 0.047273 & 0.5179 & 0.302757 \tabularnewline
32 & -0.1122 & -1.2291 & 0.110722 \tabularnewline
33 & -0.019158 & -0.2099 & 0.417063 \tabularnewline
34 & 0.080247 & 0.8791 & 0.190561 \tabularnewline
35 & -0.11985 & -1.3129 & 0.095862 \tabularnewline
36 & 0.028334 & 0.3104 & 0.378404 \tabularnewline
37 & -0.00897 & -0.0983 & 0.460945 \tabularnewline
38 & 0.127851 & 1.4005 & 0.081966 \tabularnewline
39 & -0.187389 & -2.0527 & 0.021136 \tabularnewline
40 & -0.001856 & -0.0203 & 0.491907 \tabularnewline
41 & 0.050801 & 0.5565 & 0.289454 \tabularnewline
42 & -0.080504 & -0.8819 & 0.189803 \tabularnewline
43 & -0.073616 & -0.8064 & 0.210798 \tabularnewline
44 & -0.053356 & -0.5845 & 0.279995 \tabularnewline
45 & -0.045263 & -0.4958 & 0.310459 \tabularnewline
46 & -0.100253 & -1.0982 & 0.137153 \tabularnewline
47 & 0.030807 & 0.3375 & 0.368176 \tabularnewline
48 & -0.089467 & -0.9801 & 0.164513 \tabularnewline
\hline
\end{tabular}
%Source: https://freestatistics.org/blog/index.php?pk=78583&T=2

[TABLE]
[ROW][C]Partial Autocorrelation Function[/C][/ROW]
[ROW][C]Time lag k[/C][C]PACF(k)[/C][C]T-STAT[/C][C]P-value[/C][/ROW]
[ROW][C]1[/C][C]0.857753[/C][C]9.3962[/C][C]0[/C][/ROW]
[ROW][C]2[/C][C]0.042083[/C][C]0.461[/C][C]0.322817[/C][/ROW]
[ROW][C]3[/C][C]-0.032062[/C][C]-0.3512[/C][C]0.363019[/C][/ROW]
[ROW][C]4[/C][C]0.258222[/C][C]2.8287[/C][C]0.00274[/C][/ROW]
[ROW][C]5[/C][C]-0.226387[/C][C]-2.4799[/C][C]0.007264[/C][/ROW]
[ROW][C]6[/C][C]0.309441[/C][C]3.3898[/C][C]0.000474[/C][/ROW]
[ROW][C]7[/C][C]-0.068055[/C][C]-0.7455[/C][C]0.228712[/C][/ROW]
[ROW][C]8[/C][C]0.225166[/C][C]2.4666[/C][C]0.007527[/C][/ROW]
[ROW][C]9[/C][C]-0.097105[/C][C]-1.0637[/C][C]0.144792[/C][/ROW]
[ROW][C]10[/C][C]0.27263[/C][C]2.9865[/C][C]0.001711[/C][/ROW]
[ROW][C]11[/C][C]0.291509[/C][C]3.1933[/C][C]0.000898[/C][/ROW]
[ROW][C]12[/C][C]0.00151[/C][C]0.0165[/C][C]0.493413[/C][/ROW]
[ROW][C]13[/C][C]-0.683793[/C][C]-7.4906[/C][C]0[/C][/ROW]
[ROW][C]14[/C][C]-0.101828[/C][C]-1.1155[/C][C]0.133439[/C][/ROW]
[ROW][C]15[/C][C]0.12572[/C][C]1.3772[/C][C]0.085508[/C][/ROW]
[ROW][C]16[/C][C]-0.114152[/C][C]-1.2505[/C][C]0.10678[/C][/ROW]
[ROW][C]17[/C][C]-0.013658[/C][C]-0.1496[/C][C]0.440661[/C][/ROW]
[ROW][C]18[/C][C]-0.022505[/C][C]-0.2465[/C][C]0.402847[/C][/ROW]
[ROW][C]19[/C][C]-0.01106[/C][C]-0.1212[/C][C]0.451884[/C][/ROW]
[ROW][C]20[/C][C]-0.021254[/C][C]-0.2328[/C][C]0.408147[/C][/ROW]
[ROW][C]21[/C][C]-0.035849[/C][C]-0.3927[/C][C]0.347618[/C][/ROW]
[ROW][C]22[/C][C]-0.063147[/C][C]-0.6917[/C][C]0.245218[/C][/ROW]
[ROW][C]23[/C][C]-0.012001[/C][C]-0.1315[/C][C]0.447814[/C][/ROW]
[ROW][C]24[/C][C]0.050446[/C][C]0.5526[/C][C]0.290779[/C][/ROW]
[ROW][C]25[/C][C]-0.005533[/C][C]-0.0606[/C][C]0.475884[/C][/ROW]
[ROW][C]26[/C][C]-0.025735[/C][C]-0.2819[/C][C]0.389249[/C][/ROW]
[ROW][C]27[/C][C]0.014176[/C][C]0.1553[/C][C]0.438428[/C][/ROW]
[ROW][C]28[/C][C]0.000177[/C][C]0.0019[/C][C]0.499227[/C][/ROW]
[ROW][C]29[/C][C]0.144694[/C][C]1.585[/C][C]0.057794[/C][/ROW]
[ROW][C]30[/C][C]-0.031581[/C][C]-0.346[/C][C]0.364993[/C][/ROW]
[ROW][C]31[/C][C]0.047273[/C][C]0.5179[/C][C]0.302757[/C][/ROW]
[ROW][C]32[/C][C]-0.1122[/C][C]-1.2291[/C][C]0.110722[/C][/ROW]
[ROW][C]33[/C][C]-0.019158[/C][C]-0.2099[/C][C]0.417063[/C][/ROW]
[ROW][C]34[/C][C]0.080247[/C][C]0.8791[/C][C]0.190561[/C][/ROW]
[ROW][C]35[/C][C]-0.11985[/C][C]-1.3129[/C][C]0.095862[/C][/ROW]
[ROW][C]36[/C][C]0.028334[/C][C]0.3104[/C][C]0.378404[/C][/ROW]
[ROW][C]37[/C][C]-0.00897[/C][C]-0.0983[/C][C]0.460945[/C][/ROW]
[ROW][C]38[/C][C]0.127851[/C][C]1.4005[/C][C]0.081966[/C][/ROW]
[ROW][C]39[/C][C]-0.187389[/C][C]-2.0527[/C][C]0.021136[/C][/ROW]
[ROW][C]40[/C][C]-0.001856[/C][C]-0.0203[/C][C]0.491907[/C][/ROW]
[ROW][C]41[/C][C]0.050801[/C][C]0.5565[/C][C]0.289454[/C][/ROW]
[ROW][C]42[/C][C]-0.080504[/C][C]-0.8819[/C][C]0.189803[/C][/ROW]
[ROW][C]43[/C][C]-0.073616[/C][C]-0.8064[/C][C]0.210798[/C][/ROW]
[ROW][C]44[/C][C]-0.053356[/C][C]-0.5845[/C][C]0.279995[/C][/ROW]
[ROW][C]45[/C][C]-0.045263[/C][C]-0.4958[/C][C]0.310459[/C][/ROW]
[ROW][C]46[/C][C]-0.100253[/C][C]-1.0982[/C][C]0.137153[/C][/ROW]
[ROW][C]47[/C][C]0.030807[/C][C]0.3375[/C][C]0.368176[/C][/ROW]
[ROW][C]48[/C][C]-0.089467[/C][C]-0.9801[/C][C]0.164513[/C][/ROW]
[/TABLE]
Source: https://freestatistics.org/blog/index.php?pk=78583&T=2

Globally Unique Identifier (entire table): ba.freestatistics.org/blog/index.php?pk=78583&T=2

As an alternative you can also use a QR Code:  

The GUIDs for individual cells are displayed in the table below:

Partial Autocorrelation Function
Time lag kPACF(k)T-STATP-value
10.8577539.39620
20.0420830.4610.322817
3-0.032062-0.35120.363019
40.2582222.82870.00274
5-0.226387-2.47990.007264
60.3094413.38980.000474
7-0.068055-0.74550.228712
80.2251662.46660.007527
9-0.097105-1.06370.144792
100.272632.98650.001711
110.2915093.19330.000898
120.001510.01650.493413
13-0.683793-7.49060
14-0.101828-1.11550.133439
150.125721.37720.085508
16-0.114152-1.25050.10678
17-0.013658-0.14960.440661
18-0.022505-0.24650.402847
19-0.01106-0.12120.451884
20-0.021254-0.23280.408147
21-0.035849-0.39270.347618
22-0.063147-0.69170.245218
23-0.012001-0.13150.447814
240.0504460.55260.290779
25-0.005533-0.06060.475884
26-0.025735-0.28190.389249
270.0141760.15530.438428
280.0001770.00190.499227
290.1446941.5850.057794
30-0.031581-0.3460.364993
310.0472730.51790.302757
32-0.1122-1.22910.110722
33-0.019158-0.20990.417063
340.0802470.87910.190561
35-0.11985-1.31290.095862
360.0283340.31040.378404
37-0.00897-0.09830.460945
380.1278511.40050.081966
39-0.187389-2.05270.021136
40-0.001856-0.02030.491907
410.0508010.55650.289454
42-0.080504-0.88190.189803
43-0.073616-0.80640.210798
44-0.053356-0.58450.279995
45-0.045263-0.49580.310459
46-0.100253-1.09820.137153
470.0308070.33750.368176
48-0.089467-0.98010.164513


Parameters (Session):
par1 = 48 ; par2 = 1 ; par3 = 0 ; par4 = 0 ; par5 = 12 ; par6 = White Noise ; par7 = 0.95 ;
Parameters (R input):
par1 = 48 ; par2 = 1 ; par3 = 0 ; par4 = 0 ; par5 = 12 ; par6 = White Noise ; par7 = 0.95 ;
R code (references can be found in the software module):
if (par1 == 'Default') {
par1 = 10*log10(length(x))
} else {
par1 <- as.numeric(par1)
}
par2 <- as.numeric(par2)
par3 <- as.numeric(par3)
par4 <- as.numeric(par4)
par5 <- as.numeric(par5)
if (par6 == 'White Noise') par6 <- 'white' else par6 <- 'ma'
par7 <- as.numeric(par7)
if (par2 == 0) {
x <- log(x)
} else {
x <- (x ^ par2 - 1) / par2
}
if (par3 > 0) x <- diff(x,lag=1,difference=par3)
if (par4 > 0) x <- diff(x,lag=par5,difference=par4)
bitmap(file='pic1.png')
racf <- acf(x, par1, main='Autocorrelation', xlab='time lag', ylab='ACF', ci.type=par6, ci=par7, sub=paste('(lambda=',par2,', d=',par3,', D=',par4,', CI=', par7, ', CI type=',par6,')',sep=''))
dev.off()
bitmap(file='pic2.png')
rpacf <- pacf(x,par1,main='Partial Autocorrelation',xlab='lags',ylab='PACF')
dev.off()
(myacf <- c(racf$acf))
(mypacf <- c(rpacf$acf))
lengthx <- length(x)
sqrtn <- sqrt(lengthx)
load(file='createtable')
a<-table.start()
a<-table.row.start(a)
a<-table.element(a,'Autocorrelation Function',4,TRUE)
a<-table.row.end(a)
a<-table.row.start(a)
a<-table.element(a,'Time lag k',header=TRUE)
a<-table.element(a,hyperlink('basics.htm','ACF(k)','click here for more information about the Autocorrelation Function'),header=TRUE)
a<-table.element(a,'T-STAT',header=TRUE)
a<-table.element(a,'P-value',header=TRUE)
a<-table.row.end(a)
for (i in 2:(par1+1)) {
a<-table.row.start(a)
a<-table.element(a,i-1,header=TRUE)
a<-table.element(a,round(myacf[i],6))
mytstat <- myacf[i]*sqrtn
a<-table.element(a,round(mytstat,4))
a<-table.element(a,round(1-pt(abs(mytstat),lengthx),6))
a<-table.row.end(a)
}
a<-table.end(a)
table.save(a,file='mytable.tab')
a<-table.start()
a<-table.row.start(a)
a<-table.element(a,'Partial Autocorrelation Function',4,TRUE)
a<-table.row.end(a)
a<-table.row.start(a)
a<-table.element(a,'Time lag k',header=TRUE)
a<-table.element(a,hyperlink('basics.htm','PACF(k)','click here for more information about the Partial Autocorrelation Function'),header=TRUE)
a<-table.element(a,'T-STAT',header=TRUE)
a<-table.element(a,'P-value',header=TRUE)
a<-table.row.end(a)
for (i in 1:par1) {
a<-table.row.start(a)
a<-table.element(a,i,header=TRUE)
a<-table.element(a,round(mypacf[i],6))
mytstat <- mypacf[i]*sqrtn
a<-table.element(a,round(mytstat,4))
a<-table.element(a,round(1-pt(abs(mytstat),lengthx),6))
a<-table.row.end(a)
}
a<-table.end(a)
table.save(a,file='mytable1.tab')