Free Statistics

of Irreproducible Research!

Author's title

Author*Unverified author*
R Software Modulerwasp_smp.wasp
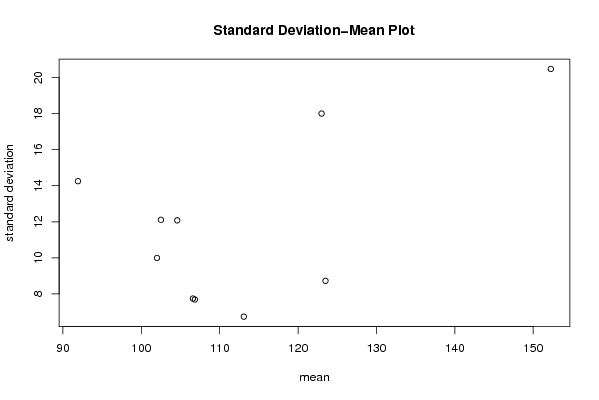
Title produced by softwareStandard Deviation-Mean Plot
Date of computationMon, 09 Aug 2010 12:47:05 +0000
Cite this page as followsStatistical Computations at FreeStatistics.org, Office for Research Development and Education, URL https://freestatistics.org/blog/index.php?v=date/2010/Aug/09/t1281358192utsc4869qk8rt8m.htm/, Retrieved Sun, 28 Apr 2024 23:28:09 +0000
Statistical Computations at FreeStatistics.org, Office for Research Development and Education, URL https://freestatistics.org/blog/index.php?pk=78516, Retrieved Sun, 28 Apr 2024 23:28:09 +0000
QR Codes:

Original text written by user:
IsPrivate?No (this computation is public)
User-defined keywordsSchrauwen Nathalie
Estimated Impact199
Family? (F = Feedback message, R = changed R code, M = changed R Module, P = changed Parameters, D = changed Data)
-       [Standard Deviation-Mean Plot] [TIJDREEKS A - STA...] [2010-08-09 12:47:05] [dd2ef098fd65ce7e9f689caa343b799f] [Current]
Feedback Forum

Post a new message
Dataseries X:
125
124
123
121
141
140
125
115
116
116
117
119
114
110
108
111
124
125
118
108
107
103
113
116
113
105
102
107
119
116
113
102
96
95
101
110
103
88
79
96
118
116
114
102
98
98
101
117
109
98
93
98
114
115
112
112
103
107
104
117
123
113
97
90
109
104
92
102
90
97
99
108
106
86
72
71
96
88
83
90
85
100
108
118
124
99
92
86
112
104
93
104
96
109
113
123
127
96
100
95
133
130
117
129
122
134
141
152
161
122
126
119
160
162
145
161
151
166
169
185


Summary of computational transaction
Raw Inputview raw input (R code)
Raw Outputview raw output of R engine
Computing time1 seconds
R Server'Gwilym Jenkins' @ 72.249.127.135

\begin{tabular}{lllllllll}
\hline
Summary of computational transaction \tabularnewline
Raw Input & view raw input (R code)  \tabularnewline
Raw Output & view raw output of R engine  \tabularnewline
Computing time & 1 seconds \tabularnewline
R Server & 'Gwilym Jenkins' @ 72.249.127.135 \tabularnewline
\hline
\end{tabular}
%Source: https://freestatistics.org/blog/index.php?pk=78516&T=0

[TABLE]
[ROW][C]Summary of computational transaction[/C][/ROW]
[ROW][C]Raw Input[/C][C]view raw input (R code) [/C][/ROW]
[ROW][C]Raw Output[/C][C]view raw output of R engine [/C][/ROW]
[ROW][C]Computing time[/C][C]1 seconds[/C][/ROW]
[ROW][C]R Server[/C][C]'Gwilym Jenkins' @ 72.249.127.135[/C][/ROW]
[/TABLE]
Source: https://freestatistics.org/blog/index.php?pk=78516&T=0

Globally Unique Identifier (entire table): ba.freestatistics.org/blog/index.php?pk=78516&T=0

As an alternative you can also use a QR Code:  

The GUIDs for individual cells are displayed in the table below:

Summary of computational transaction
Raw Inputview raw input (R code)
Raw Outputview raw output of R engine
Computing time1 seconds
R Server'Gwilym Jenkins' @ 72.249.127.135


Standard Deviation-Mean Plot
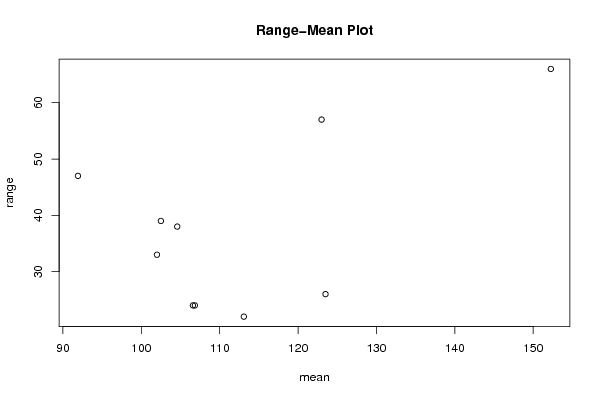
SectionMeanStandard DeviationRange
1123.58.7230103227560826
2113.0833333333336.7346908322550822
3106.5833333333337.739606911950724
4102.512.109350256573039
5106.8333333333337.6850898537756924
61029.9909049549168433
791.916666666666714.253920247575547
8104.58333333333312.078969954077838
912318.005049796704857
10152.2520.481144321723666

\begin{tabular}{lllllllll}
\hline
Standard Deviation-Mean Plot \tabularnewline
Section & Mean & Standard Deviation & Range \tabularnewline
1 & 123.5 & 8.72301032275608 & 26 \tabularnewline
2 & 113.083333333333 & 6.73469083225508 & 22 \tabularnewline
3 & 106.583333333333 & 7.7396069119507 & 24 \tabularnewline
4 & 102.5 & 12.1093502565730 & 39 \tabularnewline
5 & 106.833333333333 & 7.68508985377569 & 24 \tabularnewline
6 & 102 & 9.99090495491684 & 33 \tabularnewline
7 & 91.9166666666667 & 14.2539202475755 & 47 \tabularnewline
8 & 104.583333333333 & 12.0789699540778 & 38 \tabularnewline
9 & 123 & 18.0050497967048 & 57 \tabularnewline
10 & 152.25 & 20.4811443217236 & 66 \tabularnewline
\hline
\end{tabular}
%Source: https://freestatistics.org/blog/index.php?pk=78516&T=1

[TABLE]
[ROW][C]Standard Deviation-Mean Plot[/C][/ROW]
[ROW][C]Section[/C][C]Mean[/C][C]Standard Deviation[/C][C]Range[/C][/ROW]
[ROW][C]1[/C][C]123.5[/C][C]8.72301032275608[/C][C]26[/C][/ROW]
[ROW][C]2[/C][C]113.083333333333[/C][C]6.73469083225508[/C][C]22[/C][/ROW]
[ROW][C]3[/C][C]106.583333333333[/C][C]7.7396069119507[/C][C]24[/C][/ROW]
[ROW][C]4[/C][C]102.5[/C][C]12.1093502565730[/C][C]39[/C][/ROW]
[ROW][C]5[/C][C]106.833333333333[/C][C]7.68508985377569[/C][C]24[/C][/ROW]
[ROW][C]6[/C][C]102[/C][C]9.99090495491684[/C][C]33[/C][/ROW]
[ROW][C]7[/C][C]91.9166666666667[/C][C]14.2539202475755[/C][C]47[/C][/ROW]
[ROW][C]8[/C][C]104.583333333333[/C][C]12.0789699540778[/C][C]38[/C][/ROW]
[ROW][C]9[/C][C]123[/C][C]18.0050497967048[/C][C]57[/C][/ROW]
[ROW][C]10[/C][C]152.25[/C][C]20.4811443217236[/C][C]66[/C][/ROW]
[/TABLE]
Source: https://freestatistics.org/blog/index.php?pk=78516&T=1

Globally Unique Identifier (entire table): ba.freestatistics.org/blog/index.php?pk=78516&T=1

As an alternative you can also use a QR Code:  

The GUIDs for individual cells are displayed in the table below:

Standard Deviation-Mean Plot
SectionMeanStandard DeviationRange
1123.58.7230103227560826
2113.0833333333336.7346908322550822
3106.5833333333337.739606911950724
4102.512.109350256573039
5106.8333333333337.6850898537756924
61029.9909049549168433
791.916666666666714.253920247575547
8104.58333333333312.078969954077838
912318.005049796704857
10152.2520.481144321723666


Regression: S.E.(k) = alpha + beta * Mean(k)
alpha-5.0127824565722
beta0.149105049516565
S.D.0.0808359106931608
T-STAT1.84453973782199
p-value0.102330383897174

\begin{tabular}{lllllllll}
\hline
Regression: S.E.(k) = alpha + beta * Mean(k) \tabularnewline
alpha & -5.0127824565722 \tabularnewline
beta & 0.149105049516565 \tabularnewline
S.D. & 0.0808359106931608 \tabularnewline
T-STAT & 1.84453973782199 \tabularnewline
p-value & 0.102330383897174 \tabularnewline
\hline
\end{tabular}
%Source: https://freestatistics.org/blog/index.php?pk=78516&T=2

[TABLE]
[ROW][C]Regression: S.E.(k) = alpha + beta * Mean(k)[/C][/ROW]
[ROW][C]alpha[/C][C]-5.0127824565722[/C][/ROW]
[ROW][C]beta[/C][C]0.149105049516565[/C][/ROW]
[ROW][C]S.D.[/C][C]0.0808359106931608[/C][/ROW]
[ROW][C]T-STAT[/C][C]1.84453973782199[/C][/ROW]
[ROW][C]p-value[/C][C]0.102330383897174[/C][/ROW]
[/TABLE]
Source: https://freestatistics.org/blog/index.php?pk=78516&T=2

Globally Unique Identifier (entire table): ba.freestatistics.org/blog/index.php?pk=78516&T=2

As an alternative you can also use a QR Code:  

The GUIDs for individual cells are displayed in the table below:

Regression: S.E.(k) = alpha + beta * Mean(k)
alpha-5.0127824565722
beta0.149105049516565
S.D.0.0808359106931608
T-STAT1.84453973782199
p-value0.102330383897174


Regression: ln S.E.(k) = alpha + beta * ln Mean(k)
alpha-2.56265173299956
beta1.05284894685467
S.D.0.869186154787965
T-STAT1.21130432307854
p-value0.260342644368019
Lambda-0.0528489468546725

\begin{tabular}{lllllllll}
\hline
Regression: ln S.E.(k) = alpha + beta * ln Mean(k) \tabularnewline
alpha & -2.56265173299956 \tabularnewline
beta & 1.05284894685467 \tabularnewline
S.D. & 0.869186154787965 \tabularnewline
T-STAT & 1.21130432307854 \tabularnewline
p-value & 0.260342644368019 \tabularnewline
Lambda & -0.0528489468546725 \tabularnewline
\hline
\end{tabular}
%Source: https://freestatistics.org/blog/index.php?pk=78516&T=3

[TABLE]
[ROW][C]Regression: ln S.E.(k) = alpha + beta * ln Mean(k)[/C][/ROW]
[ROW][C]alpha[/C][C]-2.56265173299956[/C][/ROW]
[ROW][C]beta[/C][C]1.05284894685467[/C][/ROW]
[ROW][C]S.D.[/C][C]0.869186154787965[/C][/ROW]
[ROW][C]T-STAT[/C][C]1.21130432307854[/C][/ROW]
[ROW][C]p-value[/C][C]0.260342644368019[/C][/ROW]
[ROW][C]Lambda[/C][C]-0.0528489468546725[/C][/ROW]
[/TABLE]
Source: https://freestatistics.org/blog/index.php?pk=78516&T=3

Globally Unique Identifier (entire table): ba.freestatistics.org/blog/index.php?pk=78516&T=3

As an alternative you can also use a QR Code:  

The GUIDs for individual cells are displayed in the table below:

Regression: ln S.E.(k) = alpha + beta * ln Mean(k)
alpha-2.56265173299956
beta1.05284894685467
S.D.0.869186154787965
T-STAT1.21130432307854
p-value0.260342644368019
Lambda-0.0528489468546725


Parameters (Session):
par1 = 12 ;
Parameters (R input):
par1 = 12 ;
R code (references can be found in the software module):
par1 <- as.numeric(par1)
(n <- length(x))
(np <- floor(n / par1))
arr <- array(NA,dim=c(par1,np))
j <- 0
k <- 1
for (i in 1:(np*par1))
{
j = j + 1
arr[j,k] <- x[i]
if (j == par1) {
j = 0
k=k+1
}
}
arr
arr.mean <- array(NA,dim=np)
arr.sd <- array(NA,dim=np)
arr.range <- array(NA,dim=np)
for (j in 1:np)
{
arr.mean[j] <- mean(arr[,j],na.rm=TRUE)
arr.sd[j] <- sd(arr[,j],na.rm=TRUE)
arr.range[j] <- max(arr[,j],na.rm=TRUE) - min(arr[,j],na.rm=TRUE)
}
arr.mean
arr.sd
arr.range
(lm1 <- lm(arr.sd~arr.mean))
(lnlm1 <- lm(log(arr.sd)~log(arr.mean)))
(lm2 <- lm(arr.range~arr.mean))
bitmap(file='test1.png')
plot(arr.mean,arr.sd,main='Standard Deviation-Mean Plot',xlab='mean',ylab='standard deviation')
dev.off()
bitmap(file='test2.png')
plot(arr.mean,arr.range,main='Range-Mean Plot',xlab='mean',ylab='range')
dev.off()
load(file='createtable')
a<-table.start()
a<-table.row.start(a)
a<-table.element(a,'Standard Deviation-Mean Plot',4,TRUE)
a<-table.row.end(a)
a<-table.row.start(a)
a<-table.element(a,'Section',header=TRUE)
a<-table.element(a,'Mean',header=TRUE)
a<-table.element(a,'Standard Deviation',header=TRUE)
a<-table.element(a,'Range',header=TRUE)
a<-table.row.end(a)
for (j in 1:np) {
a<-table.row.start(a)
a<-table.element(a,j,header=TRUE)
a<-table.element(a,arr.mean[j])
a<-table.element(a,arr.sd[j] )
a<-table.element(a,arr.range[j] )
a<-table.row.end(a)
}
a<-table.end(a)
table.save(a,file='mytable.tab')
a<-table.start()
a<-table.row.start(a)
a<-table.element(a,'Regression: S.E.(k) = alpha + beta * Mean(k)',2,TRUE)
a<-table.row.end(a)
a<-table.row.start(a)
a<-table.element(a,'alpha',header=TRUE)
a<-table.element(a,lm1$coefficients[[1]])
a<-table.row.end(a)
a<-table.row.start(a)
a<-table.element(a,'beta',header=TRUE)
a<-table.element(a,lm1$coefficients[[2]])
a<-table.row.end(a)
a<-table.row.start(a)
a<-table.element(a,'S.D.',header=TRUE)
a<-table.element(a,summary(lm1)$coefficients[2,2])
a<-table.row.end(a)
a<-table.row.start(a)
a<-table.element(a,'T-STAT',header=TRUE)
a<-table.element(a,summary(lm1)$coefficients[2,3])
a<-table.row.end(a)
a<-table.row.start(a)
a<-table.element(a,'p-value',header=TRUE)
a<-table.element(a,summary(lm1)$coefficients[2,4])
a<-table.row.end(a)
a<-table.end(a)
table.save(a,file='mytable1.tab')
a<-table.start()
a<-table.row.start(a)
a<-table.element(a,'Regression: ln S.E.(k) = alpha + beta * ln Mean(k)',2,TRUE)
a<-table.row.end(a)
a<-table.row.start(a)
a<-table.element(a,'alpha',header=TRUE)
a<-table.element(a,lnlm1$coefficients[[1]])
a<-table.row.end(a)
a<-table.row.start(a)
a<-table.element(a,'beta',header=TRUE)
a<-table.element(a,lnlm1$coefficients[[2]])
a<-table.row.end(a)
a<-table.row.start(a)
a<-table.element(a,'S.D.',header=TRUE)
a<-table.element(a,summary(lnlm1)$coefficients[2,2])
a<-table.row.end(a)
a<-table.row.start(a)
a<-table.element(a,'T-STAT',header=TRUE)
a<-table.element(a,summary(lnlm1)$coefficients[2,3])
a<-table.row.end(a)
a<-table.row.start(a)
a<-table.element(a,'p-value',header=TRUE)
a<-table.element(a,summary(lnlm1)$coefficients[2,4])
a<-table.row.end(a)
a<-table.row.start(a)
a<-table.element(a,'Lambda',header=TRUE)
a<-table.element(a,1-lnlm1$coefficients[[2]])
a<-table.row.end(a)
a<-table.end(a)
table.save(a,file='mytable2.tab')