Free Statistics

of Irreproducible Research!

Author's title

Author*Unverified author*
R Software Modulerwasp_smp.wasp
Title produced by softwareStandard Deviation-Mean Plot
Date of computationFri, 06 Aug 2010 07:40:39 +0000
Cite this page as followsStatistical Computations at FreeStatistics.org, Office for Research Development and Education, URL https://freestatistics.org/blog/index.php?v=date/2010/Aug/06/t1281080417pwpj6tpkzpl0lvo.htm/, Retrieved Mon, 06 May 2024 11:55:58 +0000
Statistical Computations at FreeStatistics.org, Office for Research Development and Education, URL https://freestatistics.org/blog/index.php?pk=78443, Retrieved Mon, 06 May 2024 11:55:58 +0000
QR Codes:

Original text written by user:
IsPrivate?No (this computation is public)
User-defined keywordsVan de Walle Mathias
Estimated Impact193
Family? (F = Feedback message, R = changed R code, M = changed R Module, P = changed Parameters, D = changed Data)
-     [Variability] [Spreidingsmaten -...] [2010-05-21 12:27:10] [251b004ef89b028696de15eeefcf9b4b]
- RMPD    [Standard Deviation-Mean Plot] [tijdreeks 2 - sta...] [2010-08-06 07:40:39] [589929edeb20bd59f78e9be1ffd92c80] [Current]
Feedback Forum

Post a new message
Dataseries X:
239
238
237
235
233
232
233
235
236
236
237
239
238
237
244
230
237
244
239
240
230
228
231
228
225
227
238
214
222
233
228
218
203
209
207
203
195
199
207
182
181
189
186
174
153
158
153
147
143
156
168
142
146
150
145
133
111
115
109
105
96
112
127
107
116
125
120
107
86
87
79
83
75
89
104
86
98
98
85
74
49
54
47
56


Summary of computational transaction
Raw Inputview raw input (R code)
Raw Outputview raw output of R engine
Computing time1 seconds
R Server'George Udny Yule' @ 72.249.76.132

\begin{tabular}{lllllllll}
\hline
Summary of computational transaction \tabularnewline
Raw Input & view raw input (R code)  \tabularnewline
Raw Output & view raw output of R engine  \tabularnewline
Computing time & 1 seconds \tabularnewline
R Server & 'George Udny Yule' @ 72.249.76.132 \tabularnewline
\hline
\end{tabular}
%Source: https://freestatistics.org/blog/index.php?pk=78443&T=0

[TABLE]
[ROW][C]Summary of computational transaction[/C][/ROW]
[ROW][C]Raw Input[/C][C]view raw input (R code) [/C][/ROW]
[ROW][C]Raw Output[/C][C]view raw output of R engine [/C][/ROW]
[ROW][C]Computing time[/C][C]1 seconds[/C][/ROW]
[ROW][C]R Server[/C][C]'George Udny Yule' @ 72.249.76.132[/C][/ROW]
[/TABLE]
Source: https://freestatistics.org/blog/index.php?pk=78443&T=0

Globally Unique Identifier (entire table): ba.freestatistics.org/blog/index.php?pk=78443&T=0

As an alternative you can also use a QR Code:  

The GUIDs for individual cells are displayed in the table below:

Summary of computational transaction
Raw Inputview raw input (R code)
Raw Outputview raw output of R engine
Computing time1 seconds
R Server'George Udny Yule' @ 72.249.76.132


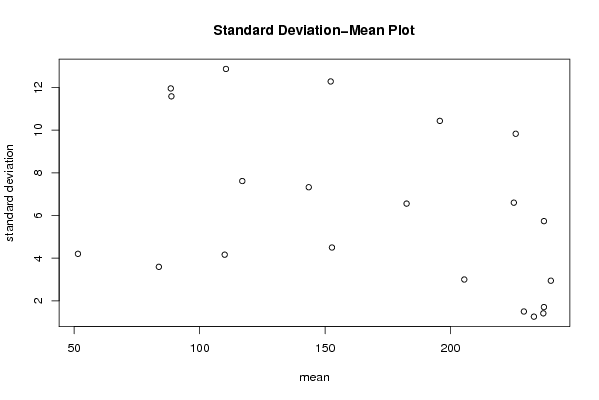
Standard Deviation-Mean Plot
SectionMeanStandard DeviationRange
1237.251.707825127659934
2233.251.258305739211793
32371.414213562373103
4237.255.737304826019514
52402.943920288775957
6229.251.53
72269.8319208025017524
8225.256.6017674401127915
9205.536
10195.7510.436314802968825
11182.56.55743852430215
12152.754.511
13152.2512.284814474246926
14143.57.3257536586119717
151104.1633319989322710
16110.512.871156384205231
171177.6157731058639118
1883.753.593976442141308
1988.511.958260743101429
2088.7511.586630226256524
2151.54.203173404306169

\begin{tabular}{lllllllll}
\hline
Standard Deviation-Mean Plot \tabularnewline
Section & Mean & Standard Deviation & Range \tabularnewline
1 & 237.25 & 1.70782512765993 & 4 \tabularnewline
2 & 233.25 & 1.25830573921179 & 3 \tabularnewline
3 & 237 & 1.41421356237310 & 3 \tabularnewline
4 & 237.25 & 5.7373048260195 & 14 \tabularnewline
5 & 240 & 2.94392028877595 & 7 \tabularnewline
6 & 229.25 & 1.5 & 3 \tabularnewline
7 & 226 & 9.83192080250175 & 24 \tabularnewline
8 & 225.25 & 6.60176744011279 & 15 \tabularnewline
9 & 205.5 & 3 & 6 \tabularnewline
10 & 195.75 & 10.4363148029688 & 25 \tabularnewline
11 & 182.5 & 6.557438524302 & 15 \tabularnewline
12 & 152.75 & 4.5 & 11 \tabularnewline
13 & 152.25 & 12.2848144742469 & 26 \tabularnewline
14 & 143.5 & 7.32575365861197 & 17 \tabularnewline
15 & 110 & 4.16333199893227 & 10 \tabularnewline
16 & 110.5 & 12.8711563842052 & 31 \tabularnewline
17 & 117 & 7.61577310586391 & 18 \tabularnewline
18 & 83.75 & 3.59397644214130 & 8 \tabularnewline
19 & 88.5 & 11.9582607431014 & 29 \tabularnewline
20 & 88.75 & 11.5866302262565 & 24 \tabularnewline
21 & 51.5 & 4.20317340430616 & 9 \tabularnewline
\hline
\end{tabular}
%Source: https://freestatistics.org/blog/index.php?pk=78443&T=1

[TABLE]
[ROW][C]Standard Deviation-Mean Plot[/C][/ROW]
[ROW][C]Section[/C][C]Mean[/C][C]Standard Deviation[/C][C]Range[/C][/ROW]
[ROW][C]1[/C][C]237.25[/C][C]1.70782512765993[/C][C]4[/C][/ROW]
[ROW][C]2[/C][C]233.25[/C][C]1.25830573921179[/C][C]3[/C][/ROW]
[ROW][C]3[/C][C]237[/C][C]1.41421356237310[/C][C]3[/C][/ROW]
[ROW][C]4[/C][C]237.25[/C][C]5.7373048260195[/C][C]14[/C][/ROW]
[ROW][C]5[/C][C]240[/C][C]2.94392028877595[/C][C]7[/C][/ROW]
[ROW][C]6[/C][C]229.25[/C][C]1.5[/C][C]3[/C][/ROW]
[ROW][C]7[/C][C]226[/C][C]9.83192080250175[/C][C]24[/C][/ROW]
[ROW][C]8[/C][C]225.25[/C][C]6.60176744011279[/C][C]15[/C][/ROW]
[ROW][C]9[/C][C]205.5[/C][C]3[/C][C]6[/C][/ROW]
[ROW][C]10[/C][C]195.75[/C][C]10.4363148029688[/C][C]25[/C][/ROW]
[ROW][C]11[/C][C]182.5[/C][C]6.557438524302[/C][C]15[/C][/ROW]
[ROW][C]12[/C][C]152.75[/C][C]4.5[/C][C]11[/C][/ROW]
[ROW][C]13[/C][C]152.25[/C][C]12.2848144742469[/C][C]26[/C][/ROW]
[ROW][C]14[/C][C]143.5[/C][C]7.32575365861197[/C][C]17[/C][/ROW]
[ROW][C]15[/C][C]110[/C][C]4.16333199893227[/C][C]10[/C][/ROW]
[ROW][C]16[/C][C]110.5[/C][C]12.8711563842052[/C][C]31[/C][/ROW]
[ROW][C]17[/C][C]117[/C][C]7.61577310586391[/C][C]18[/C][/ROW]
[ROW][C]18[/C][C]83.75[/C][C]3.59397644214130[/C][C]8[/C][/ROW]
[ROW][C]19[/C][C]88.5[/C][C]11.9582607431014[/C][C]29[/C][/ROW]
[ROW][C]20[/C][C]88.75[/C][C]11.5866302262565[/C][C]24[/C][/ROW]
[ROW][C]21[/C][C]51.5[/C][C]4.20317340430616[/C][C]9[/C][/ROW]
[/TABLE]
Source: https://freestatistics.org/blog/index.php?pk=78443&T=1

Globally Unique Identifier (entire table): ba.freestatistics.org/blog/index.php?pk=78443&T=1

As an alternative you can also use a QR Code:  

The GUIDs for individual cells are displayed in the table below:

Standard Deviation-Mean Plot
SectionMeanStandard DeviationRange
1237.251.707825127659934
2233.251.258305739211793
32371.414213562373103
4237.255.737304826019514
52402.943920288775957
6229.251.53
72269.8319208025017524
8225.256.6017674401127915
9205.536
10195.7510.436314802968825
11182.56.55743852430215
12152.754.511
13152.2512.284814474246926
14143.57.3257536586119717
151104.1633319989322710
16110.512.871156384205231
171177.6157731058639118
1883.753.593976442141308
1988.511.958260743101429
2088.7511.586630226256524
2151.54.203173404306169


Regression: S.E.(k) = alpha + beta * Mean(k)
alpha10.7727025091691
beta-0.0268174407726457
S.D.0.0127890858355143
T-STAT-2.09690052264532
p-value0.0496179594905318

\begin{tabular}{lllllllll}
\hline
Regression: S.E.(k) = alpha + beta * Mean(k) \tabularnewline
alpha & 10.7727025091691 \tabularnewline
beta & -0.0268174407726457 \tabularnewline
S.D. & 0.0127890858355143 \tabularnewline
T-STAT & -2.09690052264532 \tabularnewline
p-value & 0.0496179594905318 \tabularnewline
\hline
\end{tabular}
%Source: https://freestatistics.org/blog/index.php?pk=78443&T=2

[TABLE]
[ROW][C]Regression: S.E.(k) = alpha + beta * Mean(k)[/C][/ROW]
[ROW][C]alpha[/C][C]10.7727025091691[/C][/ROW]
[ROW][C]beta[/C][C]-0.0268174407726457[/C][/ROW]
[ROW][C]S.D.[/C][C]0.0127890858355143[/C][/ROW]
[ROW][C]T-STAT[/C][C]-2.09690052264532[/C][/ROW]
[ROW][C]p-value[/C][C]0.0496179594905318[/C][/ROW]
[/TABLE]
Source: https://freestatistics.org/blog/index.php?pk=78443&T=2

Globally Unique Identifier (entire table): ba.freestatistics.org/blog/index.php?pk=78443&T=2

As an alternative you can also use a QR Code:  

The GUIDs for individual cells are displayed in the table below:

Regression: S.E.(k) = alpha + beta * Mean(k)
alpha10.7727025091691
beta-0.0268174407726457
S.D.0.0127890858355143
T-STAT-2.09690052264532
p-value0.0496179594905318


Regression: ln S.E.(k) = alpha + beta * ln Mean(k)
alpha5.03927258126066
beta-0.682620677810388
S.D.0.354055955920745
T-STAT-1.92800224482932
p-value0.0689362526260258
Lambda1.68262067781039

\begin{tabular}{lllllllll}
\hline
Regression: ln S.E.(k) = alpha + beta * ln Mean(k) \tabularnewline
alpha & 5.03927258126066 \tabularnewline
beta & -0.682620677810388 \tabularnewline
S.D. & 0.354055955920745 \tabularnewline
T-STAT & -1.92800224482932 \tabularnewline
p-value & 0.0689362526260258 \tabularnewline
Lambda & 1.68262067781039 \tabularnewline
\hline
\end{tabular}
%Source: https://freestatistics.org/blog/index.php?pk=78443&T=3

[TABLE]
[ROW][C]Regression: ln S.E.(k) = alpha + beta * ln Mean(k)[/C][/ROW]
[ROW][C]alpha[/C][C]5.03927258126066[/C][/ROW]
[ROW][C]beta[/C][C]-0.682620677810388[/C][/ROW]
[ROW][C]S.D.[/C][C]0.354055955920745[/C][/ROW]
[ROW][C]T-STAT[/C][C]-1.92800224482932[/C][/ROW]
[ROW][C]p-value[/C][C]0.0689362526260258[/C][/ROW]
[ROW][C]Lambda[/C][C]1.68262067781039[/C][/ROW]
[/TABLE]
Source: https://freestatistics.org/blog/index.php?pk=78443&T=3

Globally Unique Identifier (entire table): ba.freestatistics.org/blog/index.php?pk=78443&T=3

As an alternative you can also use a QR Code:  

The GUIDs for individual cells are displayed in the table below:

Regression: ln S.E.(k) = alpha + beta * ln Mean(k)
alpha5.03927258126066
beta-0.682620677810388
S.D.0.354055955920745
T-STAT-1.92800224482932
p-value0.0689362526260258
Lambda1.68262067781039


Parameters (Session):
par1 = 4 ;
Parameters (R input):
par1 = 4 ;
R code (references can be found in the software module):
par1 <- as.numeric(par1)
(n <- length(x))
(np <- floor(n / par1))
arr <- array(NA,dim=c(par1,np))
j <- 0
k <- 1
for (i in 1:(np*par1))
{
j = j + 1
arr[j,k] <- x[i]
if (j == par1) {
j = 0
k=k+1
}
}
arr
arr.mean <- array(NA,dim=np)
arr.sd <- array(NA,dim=np)
arr.range <- array(NA,dim=np)
for (j in 1:np)
{
arr.mean[j] <- mean(arr[,j],na.rm=TRUE)
arr.sd[j] <- sd(arr[,j],na.rm=TRUE)
arr.range[j] <- max(arr[,j],na.rm=TRUE) - min(arr[,j],na.rm=TRUE)
}
arr.mean
arr.sd
arr.range
(lm1 <- lm(arr.sd~arr.mean))
(lnlm1 <- lm(log(arr.sd)~log(arr.mean)))
(lm2 <- lm(arr.range~arr.mean))
bitmap(file='test1.png')
plot(arr.mean,arr.sd,main='Standard Deviation-Mean Plot',xlab='mean',ylab='standard deviation')
dev.off()
bitmap(file='test2.png')
plot(arr.mean,arr.range,main='Range-Mean Plot',xlab='mean',ylab='range')
dev.off()
load(file='createtable')
a<-table.start()
a<-table.row.start(a)
a<-table.element(a,'Standard Deviation-Mean Plot',4,TRUE)
a<-table.row.end(a)
a<-table.row.start(a)
a<-table.element(a,'Section',header=TRUE)
a<-table.element(a,'Mean',header=TRUE)
a<-table.element(a,'Standard Deviation',header=TRUE)
a<-table.element(a,'Range',header=TRUE)
a<-table.row.end(a)
for (j in 1:np) {
a<-table.row.start(a)
a<-table.element(a,j,header=TRUE)
a<-table.element(a,arr.mean[j])
a<-table.element(a,arr.sd[j] )
a<-table.element(a,arr.range[j] )
a<-table.row.end(a)
}
a<-table.end(a)
table.save(a,file='mytable.tab')
a<-table.start()
a<-table.row.start(a)
a<-table.element(a,'Regression: S.E.(k) = alpha + beta * Mean(k)',2,TRUE)
a<-table.row.end(a)
a<-table.row.start(a)
a<-table.element(a,'alpha',header=TRUE)
a<-table.element(a,lm1$coefficients[[1]])
a<-table.row.end(a)
a<-table.row.start(a)
a<-table.element(a,'beta',header=TRUE)
a<-table.element(a,lm1$coefficients[[2]])
a<-table.row.end(a)
a<-table.row.start(a)
a<-table.element(a,'S.D.',header=TRUE)
a<-table.element(a,summary(lm1)$coefficients[2,2])
a<-table.row.end(a)
a<-table.row.start(a)
a<-table.element(a,'T-STAT',header=TRUE)
a<-table.element(a,summary(lm1)$coefficients[2,3])
a<-table.row.end(a)
a<-table.row.start(a)
a<-table.element(a,'p-value',header=TRUE)
a<-table.element(a,summary(lm1)$coefficients[2,4])
a<-table.row.end(a)
a<-table.end(a)
table.save(a,file='mytable1.tab')
a<-table.start()
a<-table.row.start(a)
a<-table.element(a,'Regression: ln S.E.(k) = alpha + beta * ln Mean(k)',2,TRUE)
a<-table.row.end(a)
a<-table.row.start(a)
a<-table.element(a,'alpha',header=TRUE)
a<-table.element(a,lnlm1$coefficients[[1]])
a<-table.row.end(a)
a<-table.row.start(a)
a<-table.element(a,'beta',header=TRUE)
a<-table.element(a,lnlm1$coefficients[[2]])
a<-table.row.end(a)
a<-table.row.start(a)
a<-table.element(a,'S.D.',header=TRUE)
a<-table.element(a,summary(lnlm1)$coefficients[2,2])
a<-table.row.end(a)
a<-table.row.start(a)
a<-table.element(a,'T-STAT',header=TRUE)
a<-table.element(a,summary(lnlm1)$coefficients[2,3])
a<-table.row.end(a)
a<-table.row.start(a)
a<-table.element(a,'p-value',header=TRUE)
a<-table.element(a,summary(lnlm1)$coefficients[2,4])
a<-table.row.end(a)
a<-table.row.start(a)
a<-table.element(a,'Lambda',header=TRUE)
a<-table.element(a,1-lnlm1$coefficients[[2]])
a<-table.row.end(a)
a<-table.end(a)
table.save(a,file='mytable2.tab')