Free Statistics

of Irreproducible Research!

Author's title

Author*Unverified author*
R Software Modulerwasp_histogram.wasp
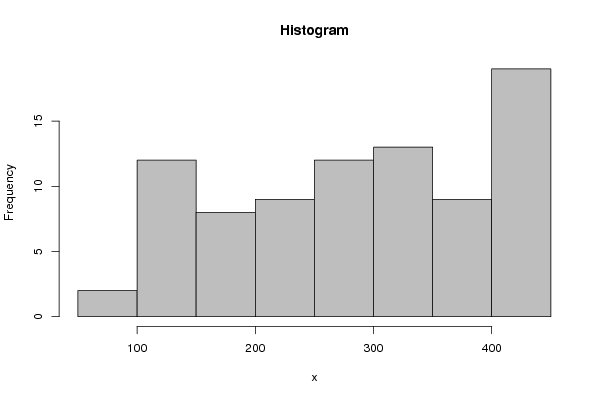
Title produced by softwareHistogram
Date of computationThu, 05 Aug 2010 15:17:39 +0000
Cite this page as followsStatistical Computations at FreeStatistics.org, Office for Research Development and Education, URL https://freestatistics.org/blog/index.php?v=date/2010/Aug/05/t1281021449bbdl57xlhjp5e8b.htm/, Retrieved Sun, 05 May 2024 09:28:38 +0000
Statistical Computations at FreeStatistics.org, Office for Research Development and Education, URL https://freestatistics.org/blog/index.php?pk=78419, Retrieved Sun, 05 May 2024 09:28:38 +0000
QR Codes:

Original text written by user:
IsPrivate?No (this computation is public)
User-defined keywordsMathias Goossenaerts
Estimated Impact128
Family? (F = Feedback message, R = changed R code, M = changed R Module, P = changed Parameters, D = changed Data)
-       [Histogram] [Tijdreeks 2 - Stap 2] [2010-08-05 15:17:39] [0d1085ed835696cdd537ad5fa07600ec] [Current]
Feedback Forum

Post a new message
Dataseries X:
430
429
428
426
424
423
424
426
427
427
428
430
432
435
426
411
405
403
402
399
392
387
380
379
386
385
365
356
338
338
343
338
320
316
317
315
317
321
303
303
290
285
300
291
278
273
277
269
275
278
255
254
245
240
261
247
229
213
218
206
217
219
196
193
188
171
190
180
149
135
151
134
145
151
137
124
125
109
131
133
103
85
104
82


Summary of computational transaction
Raw Inputview raw input (R code)
Raw Outputview raw output of R engine
Computing time1 seconds
R Server'George Udny Yule' @ 72.249.76.132

\begin{tabular}{lllllllll}
\hline
Summary of computational transaction \tabularnewline
Raw Input & view raw input (R code)  \tabularnewline
Raw Output & view raw output of R engine  \tabularnewline
Computing time & 1 seconds \tabularnewline
R Server & 'George Udny Yule' @ 72.249.76.132 \tabularnewline
\hline
\end{tabular}
%Source: https://freestatistics.org/blog/index.php?pk=78419&T=0

[TABLE]
[ROW][C]Summary of computational transaction[/C][/ROW]
[ROW][C]Raw Input[/C][C]view raw input (R code) [/C][/ROW]
[ROW][C]Raw Output[/C][C]view raw output of R engine [/C][/ROW]
[ROW][C]Computing time[/C][C]1 seconds[/C][/ROW]
[ROW][C]R Server[/C][C]'George Udny Yule' @ 72.249.76.132[/C][/ROW]
[/TABLE]
Source: https://freestatistics.org/blog/index.php?pk=78419&T=0

Globally Unique Identifier (entire table): ba.freestatistics.org/blog/index.php?pk=78419&T=0

As an alternative you can also use a QR Code:  

The GUIDs for individual cells are displayed in the table below:

Summary of computational transaction
Raw Inputview raw input (R code)
Raw Outputview raw output of R engine
Computing time1 seconds
R Server'George Udny Yule' @ 72.249.76.132


Frequency Table (Histogram)
BinsMidpointAbs. FrequencyRel. FrequencyCumul. Rel. Freq.Density
[50,100[7520.023810.023810.000476
[100,150[125120.1428570.1666670.002857
[150,200[17580.0952380.2619050.001905
[200,250[22590.1071430.3690480.002143
[250,300[275120.1428570.5119050.002857
[300,350[325130.1547620.6666670.003095
[350,400[37590.1071430.773810.002143
[400,450]425190.2261910.004524

\begin{tabular}{lllllllll}
\hline
Frequency Table (Histogram) \tabularnewline
Bins & Midpoint & Abs. Frequency & Rel. Frequency & Cumul. Rel. Freq. & Density \tabularnewline
[50,100[ & 75 & 2 & 0.02381 & 0.02381 & 0.000476 \tabularnewline
[100,150[ & 125 & 12 & 0.142857 & 0.166667 & 0.002857 \tabularnewline
[150,200[ & 175 & 8 & 0.095238 & 0.261905 & 0.001905 \tabularnewline
[200,250[ & 225 & 9 & 0.107143 & 0.369048 & 0.002143 \tabularnewline
[250,300[ & 275 & 12 & 0.142857 & 0.511905 & 0.002857 \tabularnewline
[300,350[ & 325 & 13 & 0.154762 & 0.666667 & 0.003095 \tabularnewline
[350,400[ & 375 & 9 & 0.107143 & 0.77381 & 0.002143 \tabularnewline
[400,450] & 425 & 19 & 0.22619 & 1 & 0.004524 \tabularnewline
\hline
\end{tabular}
%Source: https://freestatistics.org/blog/index.php?pk=78419&T=1

[TABLE]
[ROW][C]Frequency Table (Histogram)[/C][/ROW]
[ROW][C]Bins[/C][C]Midpoint[/C][C]Abs. Frequency[/C][C]Rel. Frequency[/C][C]Cumul. Rel. Freq.[/C][C]Density[/C][/ROW]
[ROW][C][50,100[[/C][C]75[/C][C]2[/C][C]0.02381[/C][C]0.02381[/C][C]0.000476[/C][/ROW]
[ROW][C][100,150[[/C][C]125[/C][C]12[/C][C]0.142857[/C][C]0.166667[/C][C]0.002857[/C][/ROW]
[ROW][C][150,200[[/C][C]175[/C][C]8[/C][C]0.095238[/C][C]0.261905[/C][C]0.001905[/C][/ROW]
[ROW][C][200,250[[/C][C]225[/C][C]9[/C][C]0.107143[/C][C]0.369048[/C][C]0.002143[/C][/ROW]
[ROW][C][250,300[[/C][C]275[/C][C]12[/C][C]0.142857[/C][C]0.511905[/C][C]0.002857[/C][/ROW]
[ROW][C][300,350[[/C][C]325[/C][C]13[/C][C]0.154762[/C][C]0.666667[/C][C]0.003095[/C][/ROW]
[ROW][C][350,400[[/C][C]375[/C][C]9[/C][C]0.107143[/C][C]0.77381[/C][C]0.002143[/C][/ROW]
[ROW][C][400,450][/C][C]425[/C][C]19[/C][C]0.22619[/C][C]1[/C][C]0.004524[/C][/ROW]
[/TABLE]
Source: https://freestatistics.org/blog/index.php?pk=78419&T=1

Globally Unique Identifier (entire table): ba.freestatistics.org/blog/index.php?pk=78419&T=1

As an alternative you can also use a QR Code:  

The GUIDs for individual cells are displayed in the table below:

Frequency Table (Histogram)
BinsMidpointAbs. FrequencyRel. FrequencyCumul. Rel. Freq.Density
[50,100[7520.023810.023810.000476
[100,150[125120.1428570.1666670.002857
[150,200[17580.0952380.2619050.001905
[200,250[22590.1071430.3690480.002143
[250,300[275120.1428570.5119050.002857
[300,350[325130.1547620.6666670.003095
[350,400[37590.1071430.773810.002143
[400,450]425190.2261910.004524


Parameters (Session):
par2 = grey ; par3 = FALSE ; par4 = Unknown ;
Parameters (R input):
par1 = ; par2 = grey ; par3 = FALSE ; par4 = Unknown ;
R code (references can be found in the software module):
par1 <- as.numeric(par1)
if (par3 == 'TRUE') par3 <- TRUE
if (par3 == 'FALSE') par3 <- FALSE
if (par4 == 'Unknown') par1 <- as.numeric(par1)
if (par4 == 'Interval/Ratio') par1 <- as.numeric(par1)
if (par4 == '3-point Likert') par1 <- c(1:3 - 0.5, 3.5)
if (par4 == '4-point Likert') par1 <- c(1:4 - 0.5, 4.5)
if (par4 == '5-point Likert') par1 <- c(1:5 - 0.5, 5.5)
if (par4 == '6-point Likert') par1 <- c(1:6 - 0.5, 6.5)
if (par4 == '7-point Likert') par1 <- c(1:7 - 0.5, 7.5)
if (par4 == '8-point Likert') par1 <- c(1:8 - 0.5, 8.5)
if (par4 == '9-point Likert') par1 <- c(1:9 - 0.5, 9.5)
if (par4 == '10-point Likert') par1 <- c(1:10 - 0.5, 10.5)
bitmap(file='test1.png')
if (is.na(par1)) {
myhist<-hist(x,col=par2,main=main,xlab=xlab,right=par3)
} else {
if (par1 < 0) par1 <- 3
if (par1 > 50) par1 <- 50
myhist<-hist(x,breaks=par1,col=par2,main=main,xlab=xlab,right=par3)
}
dev.off()
myhist
n <- length(x)
load(file='createtable')
a<-table.start()
a<-table.row.start(a)
a<-table.element(a,hyperlink('histogram.htm','Frequency Table (Histogram)',''),6,TRUE)
a<-table.row.end(a)
a<-table.row.start(a)
a<-table.element(a,'Bins',header=TRUE)
a<-table.element(a,'Midpoint',header=TRUE)
a<-table.element(a,'Abs. Frequency',header=TRUE)
a<-table.element(a,'Rel. Frequency',header=TRUE)
a<-table.element(a,'Cumul. Rel. Freq.',header=TRUE)
a<-table.element(a,'Density',header=TRUE)
a<-table.row.end(a)
crf <- 0
if (par3 == FALSE) mybracket <- '[' else mybracket <- ']'
mynumrows <- (length(myhist$breaks)-1)
for (i in 1:mynumrows) {
a<-table.row.start(a)
if (i == 1)
dum <- paste('[',myhist$breaks[i],sep='')
else
dum <- paste(mybracket,myhist$breaks[i],sep='')
dum <- paste(dum,myhist$breaks[i+1],sep=',')
if (i==mynumrows)
dum <- paste(dum,']',sep='')
else
dum <- paste(dum,mybracket,sep='')
a<-table.element(a,dum,header=TRUE)
a<-table.element(a,myhist$mids[i])
a<-table.element(a,myhist$counts[i])
rf <- myhist$counts[i]/n
crf <- crf + rf
a<-table.element(a,round(rf,6))
a<-table.element(a,round(crf,6))
a<-table.element(a,round(myhist$density[i],6))
a<-table.row.end(a)
}
a<-table.end(a)
table.save(a,file='mytable.tab')