Free Statistics

of Irreproducible Research!

Author's title

Author*Unverified author*
R Software Modulerwasp_smp.wasp
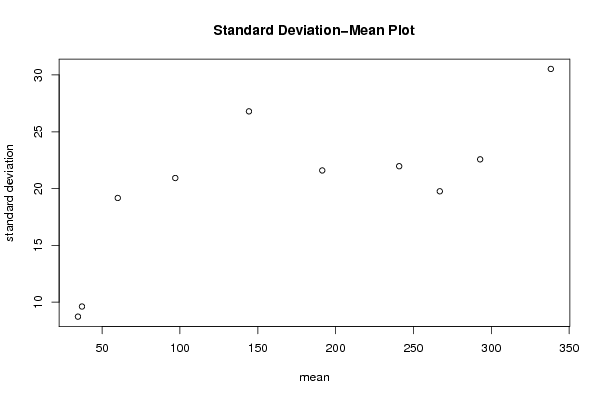
Title produced by softwareStandard Deviation-Mean Plot
Date of computationThu, 05 Aug 2010 12:57:54 +0000
Cite this page as followsStatistical Computations at FreeStatistics.org, Office for Research Development and Education, URL https://freestatistics.org/blog/index.php?v=date/2010/Aug/05/t1281013057iwl27yp885uvnr8.htm/, Retrieved Sun, 05 May 2024 19:40:59 +0000
Statistical Computations at FreeStatistics.org, Office for Research Development and Education, URL https://freestatistics.org/blog/index.php?pk=78400, Retrieved Sun, 05 May 2024 19:40:59 +0000
QR Codes:

Original text written by user:
IsPrivate?No (this computation is public)
User-defined keywordsMathias Goossenaerts
Estimated Impact151
Family? (F = Feedback message, R = changed R code, M = changed R Module, P = changed Parameters, D = changed Data)
-       [Standard Deviation-Mean Plot] [Tijdreeks 1 - Sta...] [2010-08-05 12:57:54] [f7fc4e1bbbe57039ee5ebdd2c8b864c0] [Current]
Feedback Forum

Post a new message
Dataseries X:
36
35
34
32
52
51
36
26
27
27
28
30
28
29
25
28
55
53
42
32
37
41
37
38
39
32
36
39
83
83
66
53
72
77
69
72
81
71
63
66
114
116
109
97
111
120
110
106
115
110
103
112
163
166
156
140
166
176
163
162
171
167
163
168
222
216
197
178
204
220
196
195
213
218
216
225
280
272
252
230
248
259
240
237
252
250
255
255
313
291
271
247
268
283
259
259
267
270
279
269
334
326
301
276
301
313
291
287
289
298
320
312
385
380
351
322
350
363
344
345


Summary of computational transaction
Raw Inputview raw input (R code)
Raw Outputview raw output of R engine
Computing time2 seconds
R Server'RServer@AstonUniversity' @ vre.aston.ac.uk

\begin{tabular}{lllllllll}
\hline
Summary of computational transaction \tabularnewline
Raw Input & view raw input (R code)  \tabularnewline
Raw Output & view raw output of R engine  \tabularnewline
Computing time & 2 seconds \tabularnewline
R Server & 'RServer@AstonUniversity' @ vre.aston.ac.uk \tabularnewline
\hline
\end{tabular}
%Source: https://freestatistics.org/blog/index.php?pk=78400&T=0

[TABLE]
[ROW][C]Summary of computational transaction[/C][/ROW]
[ROW][C]Raw Input[/C][C]view raw input (R code) [/C][/ROW]
[ROW][C]Raw Output[/C][C]view raw output of R engine [/C][/ROW]
[ROW][C]Computing time[/C][C]2 seconds[/C][/ROW]
[ROW][C]R Server[/C][C]'RServer@AstonUniversity' @ vre.aston.ac.uk[/C][/ROW]
[/TABLE]
Source: https://freestatistics.org/blog/index.php?pk=78400&T=0

Globally Unique Identifier (entire table): ba.freestatistics.org/blog/index.php?pk=78400&T=0

As an alternative you can also use a QR Code:  

The GUIDs for individual cells are displayed in the table below:

Summary of computational transaction
Raw Inputview raw input (R code)
Raw Outputview raw output of R engine
Computing time2 seconds
R Server'RServer@AstonUniversity' @ vre.aston.ac.uk


Standard Deviation-Mean Plot
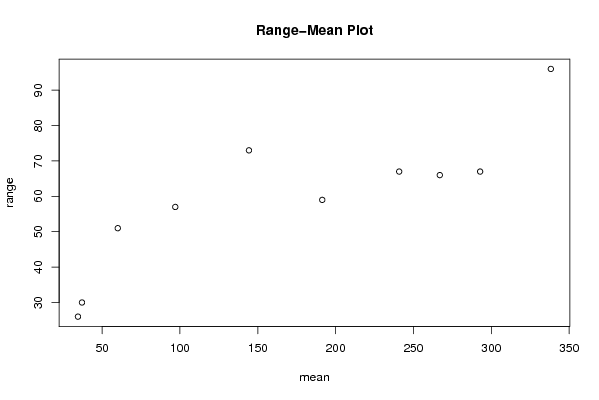
SectionMeanStandard DeviationRange
134.58.7230103227560826
237.08333333333339.614934721409730
360.083333333333319.171277442775751
49720.928449536456357
5144.33333333333326.796652889131673
6191.41666666666721.593173724933359
7240.83333333333321.966227521246167
8266.91666666666719.759731012768666
9292.83333333333322.570428494475767
10338.2530.529047270963696

\begin{tabular}{lllllllll}
\hline
Standard Deviation-Mean Plot \tabularnewline
Section & Mean & Standard Deviation & Range \tabularnewline
1 & 34.5 & 8.72301032275608 & 26 \tabularnewline
2 & 37.0833333333333 & 9.6149347214097 & 30 \tabularnewline
3 & 60.0833333333333 & 19.1712774427757 & 51 \tabularnewline
4 & 97 & 20.9284495364563 & 57 \tabularnewline
5 & 144.333333333333 & 26.7966528891316 & 73 \tabularnewline
6 & 191.416666666667 & 21.5931737249333 & 59 \tabularnewline
7 & 240.833333333333 & 21.9662275212461 & 67 \tabularnewline
8 & 266.916666666667 & 19.7597310127686 & 66 \tabularnewline
9 & 292.833333333333 & 22.5704284944757 & 67 \tabularnewline
10 & 338.25 & 30.5290472709636 & 96 \tabularnewline
\hline
\end{tabular}
%Source: https://freestatistics.org/blog/index.php?pk=78400&T=1

[TABLE]
[ROW][C]Standard Deviation-Mean Plot[/C][/ROW]
[ROW][C]Section[/C][C]Mean[/C][C]Standard Deviation[/C][C]Range[/C][/ROW]
[ROW][C]1[/C][C]34.5[/C][C]8.72301032275608[/C][C]26[/C][/ROW]
[ROW][C]2[/C][C]37.0833333333333[/C][C]9.6149347214097[/C][C]30[/C][/ROW]
[ROW][C]3[/C][C]60.0833333333333[/C][C]19.1712774427757[/C][C]51[/C][/ROW]
[ROW][C]4[/C][C]97[/C][C]20.9284495364563[/C][C]57[/C][/ROW]
[ROW][C]5[/C][C]144.333333333333[/C][C]26.7966528891316[/C][C]73[/C][/ROW]
[ROW][C]6[/C][C]191.416666666667[/C][C]21.5931737249333[/C][C]59[/C][/ROW]
[ROW][C]7[/C][C]240.833333333333[/C][C]21.9662275212461[/C][C]67[/C][/ROW]
[ROW][C]8[/C][C]266.916666666667[/C][C]19.7597310127686[/C][C]66[/C][/ROW]
[ROW][C]9[/C][C]292.833333333333[/C][C]22.5704284944757[/C][C]67[/C][/ROW]
[ROW][C]10[/C][C]338.25[/C][C]30.5290472709636[/C][C]96[/C][/ROW]
[/TABLE]
Source: https://freestatistics.org/blog/index.php?pk=78400&T=1

Globally Unique Identifier (entire table): ba.freestatistics.org/blog/index.php?pk=78400&T=1

As an alternative you can also use a QR Code:  

The GUIDs for individual cells are displayed in the table below:

Standard Deviation-Mean Plot
SectionMeanStandard DeviationRange
134.58.7230103227560826
237.08333333333339.614934721409730
360.083333333333319.171277442775751
49720.928449536456357
5144.33333333333326.796652889131673
6191.41666666666721.593173724933359
7240.83333333333321.966227521246167
8266.91666666666719.759731012768666
9292.83333333333322.570428494475767
10338.2530.529047270963696


Regression: S.E.(k) = alpha + beta * Mean(k)
alpha12.5948887291335
beta0.0444468196950427
S.D.0.0143247594368253
T-STAT3.10279693638563
p-value0.0146038046038118

\begin{tabular}{lllllllll}
\hline
Regression: S.E.(k) = alpha + beta * Mean(k) \tabularnewline
alpha & 12.5948887291335 \tabularnewline
beta & 0.0444468196950427 \tabularnewline
S.D. & 0.0143247594368253 \tabularnewline
T-STAT & 3.10279693638563 \tabularnewline
p-value & 0.0146038046038118 \tabularnewline
\hline
\end{tabular}
%Source: https://freestatistics.org/blog/index.php?pk=78400&T=2

[TABLE]
[ROW][C]Regression: S.E.(k) = alpha + beta * Mean(k)[/C][/ROW]
[ROW][C]alpha[/C][C]12.5948887291335[/C][/ROW]
[ROW][C]beta[/C][C]0.0444468196950427[/C][/ROW]
[ROW][C]S.D.[/C][C]0.0143247594368253[/C][/ROW]
[ROW][C]T-STAT[/C][C]3.10279693638563[/C][/ROW]
[ROW][C]p-value[/C][C]0.0146038046038118[/C][/ROW]
[/TABLE]
Source: https://freestatistics.org/blog/index.php?pk=78400&T=2

Globally Unique Identifier (entire table): ba.freestatistics.org/blog/index.php?pk=78400&T=2

As an alternative you can also use a QR Code:  

The GUIDs for individual cells are displayed in the table below:

Regression: S.E.(k) = alpha + beta * Mean(k)
alpha12.5948887291335
beta0.0444468196950427
S.D.0.0143247594368253
T-STAT3.10279693638563
p-value0.0146038046038118


Regression: ln S.E.(k) = alpha + beta * ln Mean(k)
alpha1.00203563807964
beta0.398402945907435
S.D.0.090536867554397
T-STAT4.40044985727017
p-value0.00228538052909035
Lambda0.601597054092565

\begin{tabular}{lllllllll}
\hline
Regression: ln S.E.(k) = alpha + beta * ln Mean(k) \tabularnewline
alpha & 1.00203563807964 \tabularnewline
beta & 0.398402945907435 \tabularnewline
S.D. & 0.090536867554397 \tabularnewline
T-STAT & 4.40044985727017 \tabularnewline
p-value & 0.00228538052909035 \tabularnewline
Lambda & 0.601597054092565 \tabularnewline
\hline
\end{tabular}
%Source: https://freestatistics.org/blog/index.php?pk=78400&T=3

[TABLE]
[ROW][C]Regression: ln S.E.(k) = alpha + beta * ln Mean(k)[/C][/ROW]
[ROW][C]alpha[/C][C]1.00203563807964[/C][/ROW]
[ROW][C]beta[/C][C]0.398402945907435[/C][/ROW]
[ROW][C]S.D.[/C][C]0.090536867554397[/C][/ROW]
[ROW][C]T-STAT[/C][C]4.40044985727017[/C][/ROW]
[ROW][C]p-value[/C][C]0.00228538052909035[/C][/ROW]
[ROW][C]Lambda[/C][C]0.601597054092565[/C][/ROW]
[/TABLE]
Source: https://freestatistics.org/blog/index.php?pk=78400&T=3

Globally Unique Identifier (entire table): ba.freestatistics.org/blog/index.php?pk=78400&T=3

As an alternative you can also use a QR Code:  

The GUIDs for individual cells are displayed in the table below:

Regression: ln S.E.(k) = alpha + beta * ln Mean(k)
alpha1.00203563807964
beta0.398402945907435
S.D.0.090536867554397
T-STAT4.40044985727017
p-value0.00228538052909035
Lambda0.601597054092565


Parameters (Session):
par1 = 12 ;
Parameters (R input):
par1 = 12 ;
R code (references can be found in the software module):
par1 <- as.numeric(par1)
(n <- length(x))
(np <- floor(n / par1))
arr <- array(NA,dim=c(par1,np))
j <- 0
k <- 1
for (i in 1:(np*par1))
{
j = j + 1
arr[j,k] <- x[i]
if (j == par1) {
j = 0
k=k+1
}
}
arr
arr.mean <- array(NA,dim=np)
arr.sd <- array(NA,dim=np)
arr.range <- array(NA,dim=np)
for (j in 1:np)
{
arr.mean[j] <- mean(arr[,j],na.rm=TRUE)
arr.sd[j] <- sd(arr[,j],na.rm=TRUE)
arr.range[j] <- max(arr[,j],na.rm=TRUE) - min(arr[,j],na.rm=TRUE)
}
arr.mean
arr.sd
arr.range
(lm1 <- lm(arr.sd~arr.mean))
(lnlm1 <- lm(log(arr.sd)~log(arr.mean)))
(lm2 <- lm(arr.range~arr.mean))
bitmap(file='test1.png')
plot(arr.mean,arr.sd,main='Standard Deviation-Mean Plot',xlab='mean',ylab='standard deviation')
dev.off()
bitmap(file='test2.png')
plot(arr.mean,arr.range,main='Range-Mean Plot',xlab='mean',ylab='range')
dev.off()
load(file='createtable')
a<-table.start()
a<-table.row.start(a)
a<-table.element(a,'Standard Deviation-Mean Plot',4,TRUE)
a<-table.row.end(a)
a<-table.row.start(a)
a<-table.element(a,'Section',header=TRUE)
a<-table.element(a,'Mean',header=TRUE)
a<-table.element(a,'Standard Deviation',header=TRUE)
a<-table.element(a,'Range',header=TRUE)
a<-table.row.end(a)
for (j in 1:np) {
a<-table.row.start(a)
a<-table.element(a,j,header=TRUE)
a<-table.element(a,arr.mean[j])
a<-table.element(a,arr.sd[j] )
a<-table.element(a,arr.range[j] )
a<-table.row.end(a)
}
a<-table.end(a)
table.save(a,file='mytable.tab')
a<-table.start()
a<-table.row.start(a)
a<-table.element(a,'Regression: S.E.(k) = alpha + beta * Mean(k)',2,TRUE)
a<-table.row.end(a)
a<-table.row.start(a)
a<-table.element(a,'alpha',header=TRUE)
a<-table.element(a,lm1$coefficients[[1]])
a<-table.row.end(a)
a<-table.row.start(a)
a<-table.element(a,'beta',header=TRUE)
a<-table.element(a,lm1$coefficients[[2]])
a<-table.row.end(a)
a<-table.row.start(a)
a<-table.element(a,'S.D.',header=TRUE)
a<-table.element(a,summary(lm1)$coefficients[2,2])
a<-table.row.end(a)
a<-table.row.start(a)
a<-table.element(a,'T-STAT',header=TRUE)
a<-table.element(a,summary(lm1)$coefficients[2,3])
a<-table.row.end(a)
a<-table.row.start(a)
a<-table.element(a,'p-value',header=TRUE)
a<-table.element(a,summary(lm1)$coefficients[2,4])
a<-table.row.end(a)
a<-table.end(a)
table.save(a,file='mytable1.tab')
a<-table.start()
a<-table.row.start(a)
a<-table.element(a,'Regression: ln S.E.(k) = alpha + beta * ln Mean(k)',2,TRUE)
a<-table.row.end(a)
a<-table.row.start(a)
a<-table.element(a,'alpha',header=TRUE)
a<-table.element(a,lnlm1$coefficients[[1]])
a<-table.row.end(a)
a<-table.row.start(a)
a<-table.element(a,'beta',header=TRUE)
a<-table.element(a,lnlm1$coefficients[[2]])
a<-table.row.end(a)
a<-table.row.start(a)
a<-table.element(a,'S.D.',header=TRUE)
a<-table.element(a,summary(lnlm1)$coefficients[2,2])
a<-table.row.end(a)
a<-table.row.start(a)
a<-table.element(a,'T-STAT',header=TRUE)
a<-table.element(a,summary(lnlm1)$coefficients[2,3])
a<-table.row.end(a)
a<-table.row.start(a)
a<-table.element(a,'p-value',header=TRUE)
a<-table.element(a,summary(lnlm1)$coefficients[2,4])
a<-table.row.end(a)
a<-table.row.start(a)
a<-table.element(a,'Lambda',header=TRUE)
a<-table.element(a,1-lnlm1$coefficients[[2]])
a<-table.row.end(a)
a<-table.end(a)
table.save(a,file='mytable2.tab')