Free Statistics

of Irreproducible Research!

Author's title

Author*Unverified author*
R Software Modulerwasp_smp.wasp
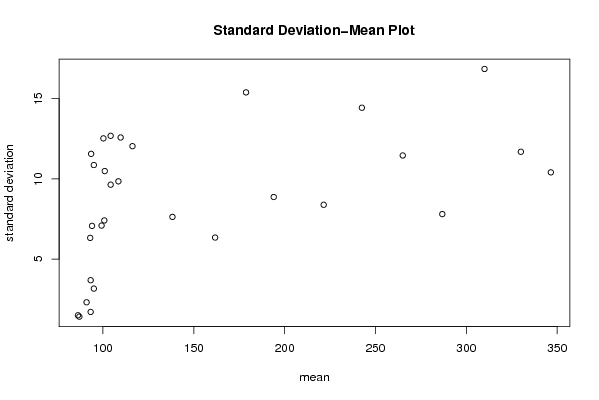
Title produced by softwareStandard Deviation-Mean Plot
Date of computationTue, 03 Aug 2010 14:12:39 +0000
Cite this page as followsStatistical Computations at FreeStatistics.org, Office for Research Development and Education, URL https://freestatistics.org/blog/index.php?v=date/2010/Aug/03/t1280844811ft6lwyxuzmkrfo9.htm/, Retrieved Fri, 03 May 2024 01:20:01 +0000
Statistical Computations at FreeStatistics.org, Office for Research Development and Education, URL https://freestatistics.org/blog/index.php?pk=78263, Retrieved Fri, 03 May 2024 01:20:01 +0000
QR Codes:

Original text written by user:
IsPrivate?No (this computation is public)
User-defined keywordsLisa Bruggeman
Estimated Impact149
Family? (F = Feedback message, R = changed R code, M = changed R Module, P = changed Parameters, D = changed Data)
-     [Quartiles] [Tijdreeks 1 - Stap 8] [2010-07-15 13:59:40] [e35b30db8ce3563ce7b9c1c6d8c0e4ae]
- RM D    [Standard Deviation-Mean Plot] [TIJDREEKS A - STA...] [2010-08-03 14:12:39] [0e6aef37627b8cf9d1bd74110cef2cca] [Current]
Feedback Forum

Post a new message
Dataseries X:
95
94
93
91
111
110
95
85
86
86
87
89
93
96
99
92
109
110
97
88
93
93
89
89
91
97
99
85
101
105
88
80
87
84
87
87
85
96
102
93
111
117
101
88
98
89
93
93
95
105
109
94
113
125
106
95
109
100
94
94
94
103
103
80
106
117
99
95
116
118
100
100
105
121
131
108
136
149
131
137
164
169
154
160
166
186
197
166
191
207
187
191
222
230
210
224
234
251
258
227
254
281
261
264
286
293
276
292
299
319
329
293
318
346
327
329
353
355
332
346


Summary of computational transaction
Raw Inputview raw input (R code)
Raw Outputview raw output of R engine
Computing time1 seconds
R Server'George Udny Yule' @ 72.249.76.132

\begin{tabular}{lllllllll}
\hline
Summary of computational transaction \tabularnewline
Raw Input & view raw input (R code)  \tabularnewline
Raw Output & view raw output of R engine  \tabularnewline
Computing time & 1 seconds \tabularnewline
R Server & 'George Udny Yule' @ 72.249.76.132 \tabularnewline
\hline
\end{tabular}
%Source: https://freestatistics.org/blog/index.php?pk=78263&T=0

[TABLE]
[ROW][C]Summary of computational transaction[/C][/ROW]
[ROW][C]Raw Input[/C][C]view raw input (R code) [/C][/ROW]
[ROW][C]Raw Output[/C][C]view raw output of R engine [/C][/ROW]
[ROW][C]Computing time[/C][C]1 seconds[/C][/ROW]
[ROW][C]R Server[/C][C]'George Udny Yule' @ 72.249.76.132[/C][/ROW]
[/TABLE]
Source: https://freestatistics.org/blog/index.php?pk=78263&T=0

Globally Unique Identifier (entire table): ba.freestatistics.org/blog/index.php?pk=78263&T=0

As an alternative you can also use a QR Code:  

The GUIDs for individual cells are displayed in the table below:

Summary of computational transaction
Raw Inputview raw input (R code)
Raw Outputview raw output of R engine
Computing time1 seconds
R Server'George Udny Yule' @ 72.249.76.132


Standard Deviation-Mean Plot
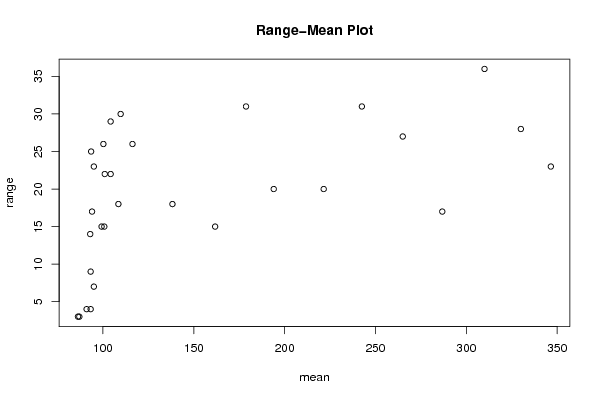
SectionMeanStandard DeviationRange
193.251.707825127659934
2100.2512.526638282742426
3871.414213562373103
4953.162277660168387
510110.488088481701522
6912.309401076758504
7936.3245553203367614
893.511.561430130683125
986.251.53
10947.0710678118654817
11104.2512.685293322058729
1293.253.6855573979169
13100.757.4105780251385715
14109.7512.579745625409130
1599.257.0887234393789115
169510.862780491200223
17104.259.6393291606141722
18108.59.848857801796118
19116.2512.038133853162926
20138.257.6321687612368718
21161.756.3442887702247615
22178.7515.392097539538531
231948.8694231304333820
24221.58.3864970836060820
25242.514.433756729740631
2626511.460075625114127
27286.757.804912982645417
2831016.852299546352736
2933011.690451944500128
30346.510.408329997330723

\begin{tabular}{lllllllll}
\hline
Standard Deviation-Mean Plot \tabularnewline
Section & Mean & Standard Deviation & Range \tabularnewline
1 & 93.25 & 1.70782512765993 & 4 \tabularnewline
2 & 100.25 & 12.5266382827424 & 26 \tabularnewline
3 & 87 & 1.41421356237310 & 3 \tabularnewline
4 & 95 & 3.16227766016838 & 7 \tabularnewline
5 & 101 & 10.4880884817015 & 22 \tabularnewline
6 & 91 & 2.30940107675850 & 4 \tabularnewline
7 & 93 & 6.32455532033676 & 14 \tabularnewline
8 & 93.5 & 11.5614301306831 & 25 \tabularnewline
9 & 86.25 & 1.5 & 3 \tabularnewline
10 & 94 & 7.07106781186548 & 17 \tabularnewline
11 & 104.25 & 12.6852933220587 & 29 \tabularnewline
12 & 93.25 & 3.685557397916 & 9 \tabularnewline
13 & 100.75 & 7.41057802513857 & 15 \tabularnewline
14 & 109.75 & 12.5797456254091 & 30 \tabularnewline
15 & 99.25 & 7.08872343937891 & 15 \tabularnewline
16 & 95 & 10.8627804912002 & 23 \tabularnewline
17 & 104.25 & 9.63932916061417 & 22 \tabularnewline
18 & 108.5 & 9.8488578017961 & 18 \tabularnewline
19 & 116.25 & 12.0381338531629 & 26 \tabularnewline
20 & 138.25 & 7.63216876123687 & 18 \tabularnewline
21 & 161.75 & 6.34428877022476 & 15 \tabularnewline
22 & 178.75 & 15.3920975395385 & 31 \tabularnewline
23 & 194 & 8.86942313043338 & 20 \tabularnewline
24 & 221.5 & 8.38649708360608 & 20 \tabularnewline
25 & 242.5 & 14.4337567297406 & 31 \tabularnewline
26 & 265 & 11.4600756251141 & 27 \tabularnewline
27 & 286.75 & 7.8049129826454 & 17 \tabularnewline
28 & 310 & 16.8522995463527 & 36 \tabularnewline
29 & 330 & 11.6904519445001 & 28 \tabularnewline
30 & 346.5 & 10.4083299973307 & 23 \tabularnewline
\hline
\end{tabular}
%Source: https://freestatistics.org/blog/index.php?pk=78263&T=1

[TABLE]
[ROW][C]Standard Deviation-Mean Plot[/C][/ROW]
[ROW][C]Section[/C][C]Mean[/C][C]Standard Deviation[/C][C]Range[/C][/ROW]
[ROW][C]1[/C][C]93.25[/C][C]1.70782512765993[/C][C]4[/C][/ROW]
[ROW][C]2[/C][C]100.25[/C][C]12.5266382827424[/C][C]26[/C][/ROW]
[ROW][C]3[/C][C]87[/C][C]1.41421356237310[/C][C]3[/C][/ROW]
[ROW][C]4[/C][C]95[/C][C]3.16227766016838[/C][C]7[/C][/ROW]
[ROW][C]5[/C][C]101[/C][C]10.4880884817015[/C][C]22[/C][/ROW]
[ROW][C]6[/C][C]91[/C][C]2.30940107675850[/C][C]4[/C][/ROW]
[ROW][C]7[/C][C]93[/C][C]6.32455532033676[/C][C]14[/C][/ROW]
[ROW][C]8[/C][C]93.5[/C][C]11.5614301306831[/C][C]25[/C][/ROW]
[ROW][C]9[/C][C]86.25[/C][C]1.5[/C][C]3[/C][/ROW]
[ROW][C]10[/C][C]94[/C][C]7.07106781186548[/C][C]17[/C][/ROW]
[ROW][C]11[/C][C]104.25[/C][C]12.6852933220587[/C][C]29[/C][/ROW]
[ROW][C]12[/C][C]93.25[/C][C]3.685557397916[/C][C]9[/C][/ROW]
[ROW][C]13[/C][C]100.75[/C][C]7.41057802513857[/C][C]15[/C][/ROW]
[ROW][C]14[/C][C]109.75[/C][C]12.5797456254091[/C][C]30[/C][/ROW]
[ROW][C]15[/C][C]99.25[/C][C]7.08872343937891[/C][C]15[/C][/ROW]
[ROW][C]16[/C][C]95[/C][C]10.8627804912002[/C][C]23[/C][/ROW]
[ROW][C]17[/C][C]104.25[/C][C]9.63932916061417[/C][C]22[/C][/ROW]
[ROW][C]18[/C][C]108.5[/C][C]9.8488578017961[/C][C]18[/C][/ROW]
[ROW][C]19[/C][C]116.25[/C][C]12.0381338531629[/C][C]26[/C][/ROW]
[ROW][C]20[/C][C]138.25[/C][C]7.63216876123687[/C][C]18[/C][/ROW]
[ROW][C]21[/C][C]161.75[/C][C]6.34428877022476[/C][C]15[/C][/ROW]
[ROW][C]22[/C][C]178.75[/C][C]15.3920975395385[/C][C]31[/C][/ROW]
[ROW][C]23[/C][C]194[/C][C]8.86942313043338[/C][C]20[/C][/ROW]
[ROW][C]24[/C][C]221.5[/C][C]8.38649708360608[/C][C]20[/C][/ROW]
[ROW][C]25[/C][C]242.5[/C][C]14.4337567297406[/C][C]31[/C][/ROW]
[ROW][C]26[/C][C]265[/C][C]11.4600756251141[/C][C]27[/C][/ROW]
[ROW][C]27[/C][C]286.75[/C][C]7.8049129826454[/C][C]17[/C][/ROW]
[ROW][C]28[/C][C]310[/C][C]16.8522995463527[/C][C]36[/C][/ROW]
[ROW][C]29[/C][C]330[/C][C]11.6904519445001[/C][C]28[/C][/ROW]
[ROW][C]30[/C][C]346.5[/C][C]10.4083299973307[/C][C]23[/C][/ROW]
[/TABLE]
Source: https://freestatistics.org/blog/index.php?pk=78263&T=1

Globally Unique Identifier (entire table): ba.freestatistics.org/blog/index.php?pk=78263&T=1

As an alternative you can also use a QR Code:  

The GUIDs for individual cells are displayed in the table below:

Standard Deviation-Mean Plot
SectionMeanStandard DeviationRange
193.251.707825127659934
2100.2512.526638282742426
3871.414213562373103
4953.162277660168387
510110.488088481701522
6912.309401076758504
7936.3245553203367614
893.511.561430130683125
986.251.53
10947.0710678118654817
11104.2512.685293322058729
1293.253.6855573979169
13100.757.4105780251385715
14109.7512.579745625409130
1599.257.0887234393789115
169510.862780491200223
17104.259.6393291606141722
18108.59.848857801796118
19116.2512.038133853162926
20138.257.6321687612368718
21161.756.3442887702247615
22178.7515.392097539538531
231948.8694231304333820
24221.58.3864970836060820
25242.514.433756729740631
2626511.460075625114127
27286.757.804912982645417
2831016.852299546352736
2933011.690451944500128
30346.510.408329997330723


Regression: S.E.(k) = alpha + beta * Mean(k)
alpha5.23231782521091
beta0.023391534836551
S.D.0.00852047944486471
T-STAT2.74533082180594
p-value0.0104384565800472

\begin{tabular}{lllllllll}
\hline
Regression: S.E.(k) = alpha + beta * Mean(k) \tabularnewline
alpha & 5.23231782521091 \tabularnewline
beta & 0.023391534836551 \tabularnewline
S.D. & 0.00852047944486471 \tabularnewline
T-STAT & 2.74533082180594 \tabularnewline
p-value & 0.0104384565800472 \tabularnewline
\hline
\end{tabular}
%Source: https://freestatistics.org/blog/index.php?pk=78263&T=2

[TABLE]
[ROW][C]Regression: S.E.(k) = alpha + beta * Mean(k)[/C][/ROW]
[ROW][C]alpha[/C][C]5.23231782521091[/C][/ROW]
[ROW][C]beta[/C][C]0.023391534836551[/C][/ROW]
[ROW][C]S.D.[/C][C]0.00852047944486471[/C][/ROW]
[ROW][C]T-STAT[/C][C]2.74533082180594[/C][/ROW]
[ROW][C]p-value[/C][C]0.0104384565800472[/C][/ROW]
[/TABLE]
Source: https://freestatistics.org/blog/index.php?pk=78263&T=2

Globally Unique Identifier (entire table): ba.freestatistics.org/blog/index.php?pk=78263&T=2

As an alternative you can also use a QR Code:  

The GUIDs for individual cells are displayed in the table below:

Regression: S.E.(k) = alpha + beta * Mean(k)
alpha5.23231782521091
beta0.023391534836551
S.D.0.00852047944486471
T-STAT2.74533082180594
p-value0.0104384565800472


Regression: ln S.E.(k) = alpha + beta * ln Mean(k)
alpha-1.52186922535830
beta0.717554426997993
S.D.0.246603154493645
T-STAT2.90975364233017
p-value0.00701376491692247
Lambda0.282445573002007

\begin{tabular}{lllllllll}
\hline
Regression: ln S.E.(k) = alpha + beta * ln Mean(k) \tabularnewline
alpha & -1.52186922535830 \tabularnewline
beta & 0.717554426997993 \tabularnewline
S.D. & 0.246603154493645 \tabularnewline
T-STAT & 2.90975364233017 \tabularnewline
p-value & 0.00701376491692247 \tabularnewline
Lambda & 0.282445573002007 \tabularnewline
\hline
\end{tabular}
%Source: https://freestatistics.org/blog/index.php?pk=78263&T=3

[TABLE]
[ROW][C]Regression: ln S.E.(k) = alpha + beta * ln Mean(k)[/C][/ROW]
[ROW][C]alpha[/C][C]-1.52186922535830[/C][/ROW]
[ROW][C]beta[/C][C]0.717554426997993[/C][/ROW]
[ROW][C]S.D.[/C][C]0.246603154493645[/C][/ROW]
[ROW][C]T-STAT[/C][C]2.90975364233017[/C][/ROW]
[ROW][C]p-value[/C][C]0.00701376491692247[/C][/ROW]
[ROW][C]Lambda[/C][C]0.282445573002007[/C][/ROW]
[/TABLE]
Source: https://freestatistics.org/blog/index.php?pk=78263&T=3

Globally Unique Identifier (entire table): ba.freestatistics.org/blog/index.php?pk=78263&T=3

As an alternative you can also use a QR Code:  

The GUIDs for individual cells are displayed in the table below:

Regression: ln S.E.(k) = alpha + beta * ln Mean(k)
alpha-1.52186922535830
beta0.717554426997993
S.D.0.246603154493645
T-STAT2.90975364233017
p-value0.00701376491692247
Lambda0.282445573002007


Parameters (Session):
Parameters (R input):
par1 = 4 ;
R code (references can be found in the software module):
par1 <- as.numeric(par1)
(n <- length(x))
(np <- floor(n / par1))
arr <- array(NA,dim=c(par1,np))
j <- 0
k <- 1
for (i in 1:(np*par1))
{
j = j + 1
arr[j,k] <- x[i]
if (j == par1) {
j = 0
k=k+1
}
}
arr
arr.mean <- array(NA,dim=np)
arr.sd <- array(NA,dim=np)
arr.range <- array(NA,dim=np)
for (j in 1:np)
{
arr.mean[j] <- mean(arr[,j],na.rm=TRUE)
arr.sd[j] <- sd(arr[,j],na.rm=TRUE)
arr.range[j] <- max(arr[,j],na.rm=TRUE) - min(arr[,j],na.rm=TRUE)
}
arr.mean
arr.sd
arr.range
(lm1 <- lm(arr.sd~arr.mean))
(lnlm1 <- lm(log(arr.sd)~log(arr.mean)))
(lm2 <- lm(arr.range~arr.mean))
bitmap(file='test1.png')
plot(arr.mean,arr.sd,main='Standard Deviation-Mean Plot',xlab='mean',ylab='standard deviation')
dev.off()
bitmap(file='test2.png')
plot(arr.mean,arr.range,main='Range-Mean Plot',xlab='mean',ylab='range')
dev.off()
load(file='createtable')
a<-table.start()
a<-table.row.start(a)
a<-table.element(a,'Standard Deviation-Mean Plot',4,TRUE)
a<-table.row.end(a)
a<-table.row.start(a)
a<-table.element(a,'Section',header=TRUE)
a<-table.element(a,'Mean',header=TRUE)
a<-table.element(a,'Standard Deviation',header=TRUE)
a<-table.element(a,'Range',header=TRUE)
a<-table.row.end(a)
for (j in 1:np) {
a<-table.row.start(a)
a<-table.element(a,j,header=TRUE)
a<-table.element(a,arr.mean[j])
a<-table.element(a,arr.sd[j] )
a<-table.element(a,arr.range[j] )
a<-table.row.end(a)
}
a<-table.end(a)
table.save(a,file='mytable.tab')
a<-table.start()
a<-table.row.start(a)
a<-table.element(a,'Regression: S.E.(k) = alpha + beta * Mean(k)',2,TRUE)
a<-table.row.end(a)
a<-table.row.start(a)
a<-table.element(a,'alpha',header=TRUE)
a<-table.element(a,lm1$coefficients[[1]])
a<-table.row.end(a)
a<-table.row.start(a)
a<-table.element(a,'beta',header=TRUE)
a<-table.element(a,lm1$coefficients[[2]])
a<-table.row.end(a)
a<-table.row.start(a)
a<-table.element(a,'S.D.',header=TRUE)
a<-table.element(a,summary(lm1)$coefficients[2,2])
a<-table.row.end(a)
a<-table.row.start(a)
a<-table.element(a,'T-STAT',header=TRUE)
a<-table.element(a,summary(lm1)$coefficients[2,3])
a<-table.row.end(a)
a<-table.row.start(a)
a<-table.element(a,'p-value',header=TRUE)
a<-table.element(a,summary(lm1)$coefficients[2,4])
a<-table.row.end(a)
a<-table.end(a)
table.save(a,file='mytable1.tab')
a<-table.start()
a<-table.row.start(a)
a<-table.element(a,'Regression: ln S.E.(k) = alpha + beta * ln Mean(k)',2,TRUE)
a<-table.row.end(a)
a<-table.row.start(a)
a<-table.element(a,'alpha',header=TRUE)
a<-table.element(a,lnlm1$coefficients[[1]])
a<-table.row.end(a)
a<-table.row.start(a)
a<-table.element(a,'beta',header=TRUE)
a<-table.element(a,lnlm1$coefficients[[2]])
a<-table.row.end(a)
a<-table.row.start(a)
a<-table.element(a,'S.D.',header=TRUE)
a<-table.element(a,summary(lnlm1)$coefficients[2,2])
a<-table.row.end(a)
a<-table.row.start(a)
a<-table.element(a,'T-STAT',header=TRUE)
a<-table.element(a,summary(lnlm1)$coefficients[2,3])
a<-table.row.end(a)
a<-table.row.start(a)
a<-table.element(a,'p-value',header=TRUE)
a<-table.element(a,summary(lnlm1)$coefficients[2,4])
a<-table.row.end(a)
a<-table.row.start(a)
a<-table.element(a,'Lambda',header=TRUE)
a<-table.element(a,1-lnlm1$coefficients[[2]])
a<-table.row.end(a)
a<-table.end(a)
table.save(a,file='mytable2.tab')