Free Statistics

of Irreproducible Research!

Author's title

Author*Unverified author*
R Software Modulerwasp_autocorrelation.wasp
Title produced by software(Partial) Autocorrelation Function
Date of computationTue, 03 Aug 2010 13:17:33 +0000
Cite this page as followsStatistical Computations at FreeStatistics.org, Office for Research Development and Education, URL https://freestatistics.org/blog/index.php?v=date/2010/Aug/03/t128084156296x76oy1g9n0kw1.htm/, Retrieved Thu, 02 May 2024 19:36:28 +0000
Statistical Computations at FreeStatistics.org, Office for Research Development and Education, URL https://freestatistics.org/blog/index.php?pk=78254, Retrieved Thu, 02 May 2024 19:36:28 +0000
QR Codes:

Original text written by user:
IsPrivate?No (this computation is public)
User-defined keywordsLisa Bruggeman
Estimated Impact184
Family? (F = Feedback message, R = changed R code, M = changed R Module, P = changed Parameters, D = changed Data)
-     [Quartiles] [Tijdreeks 1 - Stap 8] [2010-07-15 13:59:40] [e35b30db8ce3563ce7b9c1c6d8c0e4ae]
- RM D    [(Partial) Autocorrelation Function] [TIJDREEKS A - STA...] [2010-08-03 13:17:33] [0e6aef37627b8cf9d1bd74110cef2cca] [Current]
Feedback Forum

Post a new message
Dataseries X:
95
94
93
91
111
110
95
85
86
86
87
89
93
96
99
92
109
110
97
88
93
93
89
89
91
97
99
85
101
105
88
80
87
84
87
87
85
96
102
93
111
117
101
88
98
89
93
93
95
105
109
94
113
125
106
95
109
100
94
94
94
103
103
80
106
117
99
95
116
118
100
100
105
121
131
108
136
149
131
137
164
169
154
160
166
186
197
166
191
207
187
191
222
230
210
224
234
251
258
227
254
281
261
264
286
293
276
292
299
319
329
293
318
346
327
329
353
355
332
346


Summary of computational transaction
Raw Inputview raw input (R code)
Raw Outputview raw output of R engine
Computing time3 seconds
R Server'George Udny Yule' @ 72.249.76.132

\begin{tabular}{lllllllll}
\hline
Summary of computational transaction \tabularnewline
Raw Input & view raw input (R code)  \tabularnewline
Raw Output & view raw output of R engine  \tabularnewline
Computing time & 3 seconds \tabularnewline
R Server & 'George Udny Yule' @ 72.249.76.132 \tabularnewline
\hline
\end{tabular}
%Source: https://freestatistics.org/blog/index.php?pk=78254&T=0

[TABLE]
[ROW][C]Summary of computational transaction[/C][/ROW]
[ROW][C]Raw Input[/C][C]view raw input (R code) [/C][/ROW]
[ROW][C]Raw Output[/C][C]view raw output of R engine [/C][/ROW]
[ROW][C]Computing time[/C][C]3 seconds[/C][/ROW]
[ROW][C]R Server[/C][C]'George Udny Yule' @ 72.249.76.132[/C][/ROW]
[/TABLE]
Source: https://freestatistics.org/blog/index.php?pk=78254&T=0

Globally Unique Identifier (entire table): ba.freestatistics.org/blog/index.php?pk=78254&T=0

As an alternative you can also use a QR Code:  

The GUIDs for individual cells are displayed in the table below:

Summary of computational transaction
Raw Inputview raw input (R code)
Raw Outputview raw output of R engine
Computing time3 seconds
R Server'George Udny Yule' @ 72.249.76.132


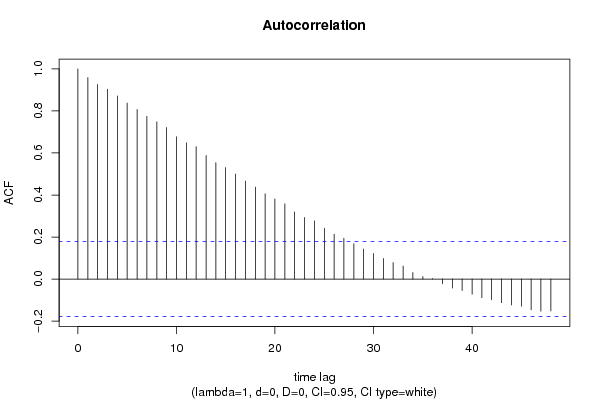
Autocorrelation Function
Time lag kACF(k)T-STATP-value
10.95880510.50320
20.92602910.14410
30.9038679.90140
40.8716019.54790
50.8376129.17560
60.8072628.84310
70.7743238.48230
80.748448.19870
90.721717.90590
100.6770837.41710
110.6485127.10410
120.6303286.90490
130.588126.44250
140.5539366.06810
150.5308275.81490
160.4998835.47590
170.466715.11251e-06
180.4375724.79342e-06
190.4057674.4451e-05
200.3813274.17722.8e-05
210.3581663.92357.3e-05
220.3194733.49960.000327
230.2935693.21590.000836
240.2771263.03580.001472
250.2418832.64970.004571
260.2136512.34040.010456
270.1945662.13140.01755
280.1682691.84330.033877
290.1426471.56260.060388
300.1222231.33890.09157
310.098391.07780.14164
320.07880.86320.194873
330.0619080.67820.249487
340.0309430.3390.367617
350.0118040.12930.448666
360.0023120.02530.48992
37-0.022542-0.24690.402691
38-0.043013-0.47120.319183
39-0.054611-0.59820.275406
40-0.072052-0.78930.215751
41-0.088481-0.96930.167183
42-0.098964-1.08410.140247
43-0.11234-1.23060.110434
44-0.122955-1.34690.090275
45-0.129092-1.41410.079956
46-0.146266-1.60230.055864
47-0.153205-1.67830.047947
48-0.151883-1.66380.049381

\begin{tabular}{lllllllll}
\hline
Autocorrelation Function \tabularnewline
Time lag k & ACF(k) & T-STAT & P-value \tabularnewline
1 & 0.958805 & 10.5032 & 0 \tabularnewline
2 & 0.926029 & 10.1441 & 0 \tabularnewline
3 & 0.903867 & 9.9014 & 0 \tabularnewline
4 & 0.871601 & 9.5479 & 0 \tabularnewline
5 & 0.837612 & 9.1756 & 0 \tabularnewline
6 & 0.807262 & 8.8431 & 0 \tabularnewline
7 & 0.774323 & 8.4823 & 0 \tabularnewline
8 & 0.74844 & 8.1987 & 0 \tabularnewline
9 & 0.72171 & 7.9059 & 0 \tabularnewline
10 & 0.677083 & 7.4171 & 0 \tabularnewline
11 & 0.648512 & 7.1041 & 0 \tabularnewline
12 & 0.630328 & 6.9049 & 0 \tabularnewline
13 & 0.58812 & 6.4425 & 0 \tabularnewline
14 & 0.553936 & 6.0681 & 0 \tabularnewline
15 & 0.530827 & 5.8149 & 0 \tabularnewline
16 & 0.499883 & 5.4759 & 0 \tabularnewline
17 & 0.46671 & 5.1125 & 1e-06 \tabularnewline
18 & 0.437572 & 4.7934 & 2e-06 \tabularnewline
19 & 0.405767 & 4.445 & 1e-05 \tabularnewline
20 & 0.381327 & 4.1772 & 2.8e-05 \tabularnewline
21 & 0.358166 & 3.9235 & 7.3e-05 \tabularnewline
22 & 0.319473 & 3.4996 & 0.000327 \tabularnewline
23 & 0.293569 & 3.2159 & 0.000836 \tabularnewline
24 & 0.277126 & 3.0358 & 0.001472 \tabularnewline
25 & 0.241883 & 2.6497 & 0.004571 \tabularnewline
26 & 0.213651 & 2.3404 & 0.010456 \tabularnewline
27 & 0.194566 & 2.1314 & 0.01755 \tabularnewline
28 & 0.168269 & 1.8433 & 0.033877 \tabularnewline
29 & 0.142647 & 1.5626 & 0.060388 \tabularnewline
30 & 0.122223 & 1.3389 & 0.09157 \tabularnewline
31 & 0.09839 & 1.0778 & 0.14164 \tabularnewline
32 & 0.0788 & 0.8632 & 0.194873 \tabularnewline
33 & 0.061908 & 0.6782 & 0.249487 \tabularnewline
34 & 0.030943 & 0.339 & 0.367617 \tabularnewline
35 & 0.011804 & 0.1293 & 0.448666 \tabularnewline
36 & 0.002312 & 0.0253 & 0.48992 \tabularnewline
37 & -0.022542 & -0.2469 & 0.402691 \tabularnewline
38 & -0.043013 & -0.4712 & 0.319183 \tabularnewline
39 & -0.054611 & -0.5982 & 0.275406 \tabularnewline
40 & -0.072052 & -0.7893 & 0.215751 \tabularnewline
41 & -0.088481 & -0.9693 & 0.167183 \tabularnewline
42 & -0.098964 & -1.0841 & 0.140247 \tabularnewline
43 & -0.11234 & -1.2306 & 0.110434 \tabularnewline
44 & -0.122955 & -1.3469 & 0.090275 \tabularnewline
45 & -0.129092 & -1.4141 & 0.079956 \tabularnewline
46 & -0.146266 & -1.6023 & 0.055864 \tabularnewline
47 & -0.153205 & -1.6783 & 0.047947 \tabularnewline
48 & -0.151883 & -1.6638 & 0.049381 \tabularnewline
\hline
\end{tabular}
%Source: https://freestatistics.org/blog/index.php?pk=78254&T=1

[TABLE]
[ROW][C]Autocorrelation Function[/C][/ROW]
[ROW][C]Time lag k[/C][C]ACF(k)[/C][C]T-STAT[/C][C]P-value[/C][/ROW]
[ROW][C]1[/C][C]0.958805[/C][C]10.5032[/C][C]0[/C][/ROW]
[ROW][C]2[/C][C]0.926029[/C][C]10.1441[/C][C]0[/C][/ROW]
[ROW][C]3[/C][C]0.903867[/C][C]9.9014[/C][C]0[/C][/ROW]
[ROW][C]4[/C][C]0.871601[/C][C]9.5479[/C][C]0[/C][/ROW]
[ROW][C]5[/C][C]0.837612[/C][C]9.1756[/C][C]0[/C][/ROW]
[ROW][C]6[/C][C]0.807262[/C][C]8.8431[/C][C]0[/C][/ROW]
[ROW][C]7[/C][C]0.774323[/C][C]8.4823[/C][C]0[/C][/ROW]
[ROW][C]8[/C][C]0.74844[/C][C]8.1987[/C][C]0[/C][/ROW]
[ROW][C]9[/C][C]0.72171[/C][C]7.9059[/C][C]0[/C][/ROW]
[ROW][C]10[/C][C]0.677083[/C][C]7.4171[/C][C]0[/C][/ROW]
[ROW][C]11[/C][C]0.648512[/C][C]7.1041[/C][C]0[/C][/ROW]
[ROW][C]12[/C][C]0.630328[/C][C]6.9049[/C][C]0[/C][/ROW]
[ROW][C]13[/C][C]0.58812[/C][C]6.4425[/C][C]0[/C][/ROW]
[ROW][C]14[/C][C]0.553936[/C][C]6.0681[/C][C]0[/C][/ROW]
[ROW][C]15[/C][C]0.530827[/C][C]5.8149[/C][C]0[/C][/ROW]
[ROW][C]16[/C][C]0.499883[/C][C]5.4759[/C][C]0[/C][/ROW]
[ROW][C]17[/C][C]0.46671[/C][C]5.1125[/C][C]1e-06[/C][/ROW]
[ROW][C]18[/C][C]0.437572[/C][C]4.7934[/C][C]2e-06[/C][/ROW]
[ROW][C]19[/C][C]0.405767[/C][C]4.445[/C][C]1e-05[/C][/ROW]
[ROW][C]20[/C][C]0.381327[/C][C]4.1772[/C][C]2.8e-05[/C][/ROW]
[ROW][C]21[/C][C]0.358166[/C][C]3.9235[/C][C]7.3e-05[/C][/ROW]
[ROW][C]22[/C][C]0.319473[/C][C]3.4996[/C][C]0.000327[/C][/ROW]
[ROW][C]23[/C][C]0.293569[/C][C]3.2159[/C][C]0.000836[/C][/ROW]
[ROW][C]24[/C][C]0.277126[/C][C]3.0358[/C][C]0.001472[/C][/ROW]
[ROW][C]25[/C][C]0.241883[/C][C]2.6497[/C][C]0.004571[/C][/ROW]
[ROW][C]26[/C][C]0.213651[/C][C]2.3404[/C][C]0.010456[/C][/ROW]
[ROW][C]27[/C][C]0.194566[/C][C]2.1314[/C][C]0.01755[/C][/ROW]
[ROW][C]28[/C][C]0.168269[/C][C]1.8433[/C][C]0.033877[/C][/ROW]
[ROW][C]29[/C][C]0.142647[/C][C]1.5626[/C][C]0.060388[/C][/ROW]
[ROW][C]30[/C][C]0.122223[/C][C]1.3389[/C][C]0.09157[/C][/ROW]
[ROW][C]31[/C][C]0.09839[/C][C]1.0778[/C][C]0.14164[/C][/ROW]
[ROW][C]32[/C][C]0.0788[/C][C]0.8632[/C][C]0.194873[/C][/ROW]
[ROW][C]33[/C][C]0.061908[/C][C]0.6782[/C][C]0.249487[/C][/ROW]
[ROW][C]34[/C][C]0.030943[/C][C]0.339[/C][C]0.367617[/C][/ROW]
[ROW][C]35[/C][C]0.011804[/C][C]0.1293[/C][C]0.448666[/C][/ROW]
[ROW][C]36[/C][C]0.002312[/C][C]0.0253[/C][C]0.48992[/C][/ROW]
[ROW][C]37[/C][C]-0.022542[/C][C]-0.2469[/C][C]0.402691[/C][/ROW]
[ROW][C]38[/C][C]-0.043013[/C][C]-0.4712[/C][C]0.319183[/C][/ROW]
[ROW][C]39[/C][C]-0.054611[/C][C]-0.5982[/C][C]0.275406[/C][/ROW]
[ROW][C]40[/C][C]-0.072052[/C][C]-0.7893[/C][C]0.215751[/C][/ROW]
[ROW][C]41[/C][C]-0.088481[/C][C]-0.9693[/C][C]0.167183[/C][/ROW]
[ROW][C]42[/C][C]-0.098964[/C][C]-1.0841[/C][C]0.140247[/C][/ROW]
[ROW][C]43[/C][C]-0.11234[/C][C]-1.2306[/C][C]0.110434[/C][/ROW]
[ROW][C]44[/C][C]-0.122955[/C][C]-1.3469[/C][C]0.090275[/C][/ROW]
[ROW][C]45[/C][C]-0.129092[/C][C]-1.4141[/C][C]0.079956[/C][/ROW]
[ROW][C]46[/C][C]-0.146266[/C][C]-1.6023[/C][C]0.055864[/C][/ROW]
[ROW][C]47[/C][C]-0.153205[/C][C]-1.6783[/C][C]0.047947[/C][/ROW]
[ROW][C]48[/C][C]-0.151883[/C][C]-1.6638[/C][C]0.049381[/C][/ROW]
[/TABLE]
Source: https://freestatistics.org/blog/index.php?pk=78254&T=1

Globally Unique Identifier (entire table): ba.freestatistics.org/blog/index.php?pk=78254&T=1

As an alternative you can also use a QR Code:  

The GUIDs for individual cells are displayed in the table below:

Autocorrelation Function
Time lag kACF(k)T-STATP-value
10.95880510.50320
20.92602910.14410
30.9038679.90140
40.8716019.54790
50.8376129.17560
60.8072628.84310
70.7743238.48230
80.748448.19870
90.721717.90590
100.6770837.41710
110.6485127.10410
120.6303286.90490
130.588126.44250
140.5539366.06810
150.5308275.81490
160.4998835.47590
170.466715.11251e-06
180.4375724.79342e-06
190.4057674.4451e-05
200.3813274.17722.8e-05
210.3581663.92357.3e-05
220.3194733.49960.000327
230.2935693.21590.000836
240.2771263.03580.001472
250.2418832.64970.004571
260.2136512.34040.010456
270.1945662.13140.01755
280.1682691.84330.033877
290.1426471.56260.060388
300.1222231.33890.09157
310.098391.07780.14164
320.07880.86320.194873
330.0619080.67820.249487
340.0309430.3390.367617
350.0118040.12930.448666
360.0023120.02530.48992
37-0.022542-0.24690.402691
38-0.043013-0.47120.319183
39-0.054611-0.59820.275406
40-0.072052-0.78930.215751
41-0.088481-0.96930.167183
42-0.098964-1.08410.140247
43-0.11234-1.23060.110434
44-0.122955-1.34690.090275
45-0.129092-1.41410.079956
46-0.146266-1.60230.055864
47-0.153205-1.67830.047947
48-0.151883-1.66380.049381


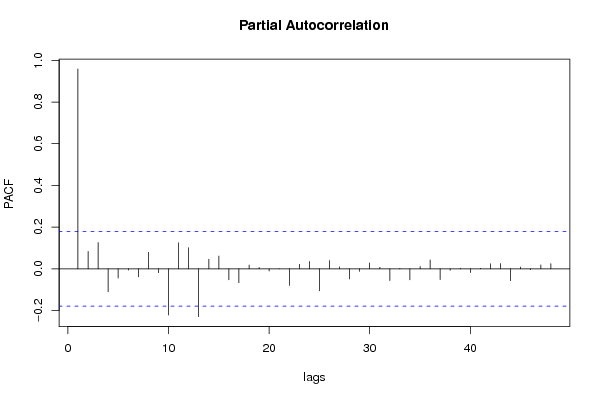
Partial Autocorrelation Function
Time lag kPACF(k)T-STATP-value
10.95880510.50320
20.0833130.91270.181628
30.1257571.37760.085445
4-0.110709-1.21280.113803
5-0.044623-0.48880.312929
6-0.006064-0.06640.473576
7-0.038401-0.42070.337377
80.0795920.87190.192506
9-0.018834-0.20630.418447
10-0.222301-2.43520.008178
110.124831.36740.087021
120.10121.10860.134911
13-0.229779-2.51710.006576
140.0458250.5020.308298
150.0612040.67050.251928
16-0.052733-0.57770.282287
17-0.066938-0.73330.232412
180.0177780.19470.422959
190.0062120.0680.472932
20-0.011085-0.12140.451776
210.0003350.00370.498539
22-0.079836-0.87460.19178
230.0213760.23420.40763
240.0349280.38260.35134
25-0.105951-1.16060.124046
260.0393690.43130.333524
270.0085320.09350.462847
28-0.048745-0.5340.297175
29-0.01216-0.13320.447125
300.028080.30760.379461
310.0069180.07580.469857
32-0.056851-0.62280.267308
330.0022870.02510.490027
34-0.052926-0.57980.281578
350.0111770.12240.451379
360.042240.46270.322201
37-0.051908-0.56860.285338
38-0.007175-0.07860.46874
390.0025240.02770.488993
40-0.018152-0.19880.421359
410.0023580.02580.489717
420.0240130.26310.396481
430.0251540.27550.391686
44-0.057282-0.62750.265764
450.0080770.08850.46482
46-0.004604-0.05040.479931
470.0184040.20160.420284
480.0241980.26510.395702

\begin{tabular}{lllllllll}
\hline
Partial Autocorrelation Function \tabularnewline
Time lag k & PACF(k) & T-STAT & P-value \tabularnewline
1 & 0.958805 & 10.5032 & 0 \tabularnewline
2 & 0.083313 & 0.9127 & 0.181628 \tabularnewline
3 & 0.125757 & 1.3776 & 0.085445 \tabularnewline
4 & -0.110709 & -1.2128 & 0.113803 \tabularnewline
5 & -0.044623 & -0.4888 & 0.312929 \tabularnewline
6 & -0.006064 & -0.0664 & 0.473576 \tabularnewline
7 & -0.038401 & -0.4207 & 0.337377 \tabularnewline
8 & 0.079592 & 0.8719 & 0.192506 \tabularnewline
9 & -0.018834 & -0.2063 & 0.418447 \tabularnewline
10 & -0.222301 & -2.4352 & 0.008178 \tabularnewline
11 & 0.12483 & 1.3674 & 0.087021 \tabularnewline
12 & 0.1012 & 1.1086 & 0.134911 \tabularnewline
13 & -0.229779 & -2.5171 & 0.006576 \tabularnewline
14 & 0.045825 & 0.502 & 0.308298 \tabularnewline
15 & 0.061204 & 0.6705 & 0.251928 \tabularnewline
16 & -0.052733 & -0.5777 & 0.282287 \tabularnewline
17 & -0.066938 & -0.7333 & 0.232412 \tabularnewline
18 & 0.017778 & 0.1947 & 0.422959 \tabularnewline
19 & 0.006212 & 0.068 & 0.472932 \tabularnewline
20 & -0.011085 & -0.1214 & 0.451776 \tabularnewline
21 & 0.000335 & 0.0037 & 0.498539 \tabularnewline
22 & -0.079836 & -0.8746 & 0.19178 \tabularnewline
23 & 0.021376 & 0.2342 & 0.40763 \tabularnewline
24 & 0.034928 & 0.3826 & 0.35134 \tabularnewline
25 & -0.105951 & -1.1606 & 0.124046 \tabularnewline
26 & 0.039369 & 0.4313 & 0.333524 \tabularnewline
27 & 0.008532 & 0.0935 & 0.462847 \tabularnewline
28 & -0.048745 & -0.534 & 0.297175 \tabularnewline
29 & -0.01216 & -0.1332 & 0.447125 \tabularnewline
30 & 0.02808 & 0.3076 & 0.379461 \tabularnewline
31 & 0.006918 & 0.0758 & 0.469857 \tabularnewline
32 & -0.056851 & -0.6228 & 0.267308 \tabularnewline
33 & 0.002287 & 0.0251 & 0.490027 \tabularnewline
34 & -0.052926 & -0.5798 & 0.281578 \tabularnewline
35 & 0.011177 & 0.1224 & 0.451379 \tabularnewline
36 & 0.04224 & 0.4627 & 0.322201 \tabularnewline
37 & -0.051908 & -0.5686 & 0.285338 \tabularnewline
38 & -0.007175 & -0.0786 & 0.46874 \tabularnewline
39 & 0.002524 & 0.0277 & 0.488993 \tabularnewline
40 & -0.018152 & -0.1988 & 0.421359 \tabularnewline
41 & 0.002358 & 0.0258 & 0.489717 \tabularnewline
42 & 0.024013 & 0.2631 & 0.396481 \tabularnewline
43 & 0.025154 & 0.2755 & 0.391686 \tabularnewline
44 & -0.057282 & -0.6275 & 0.265764 \tabularnewline
45 & 0.008077 & 0.0885 & 0.46482 \tabularnewline
46 & -0.004604 & -0.0504 & 0.479931 \tabularnewline
47 & 0.018404 & 0.2016 & 0.420284 \tabularnewline
48 & 0.024198 & 0.2651 & 0.395702 \tabularnewline
\hline
\end{tabular}
%Source: https://freestatistics.org/blog/index.php?pk=78254&T=2

[TABLE]
[ROW][C]Partial Autocorrelation Function[/C][/ROW]
[ROW][C]Time lag k[/C][C]PACF(k)[/C][C]T-STAT[/C][C]P-value[/C][/ROW]
[ROW][C]1[/C][C]0.958805[/C][C]10.5032[/C][C]0[/C][/ROW]
[ROW][C]2[/C][C]0.083313[/C][C]0.9127[/C][C]0.181628[/C][/ROW]
[ROW][C]3[/C][C]0.125757[/C][C]1.3776[/C][C]0.085445[/C][/ROW]
[ROW][C]4[/C][C]-0.110709[/C][C]-1.2128[/C][C]0.113803[/C][/ROW]
[ROW][C]5[/C][C]-0.044623[/C][C]-0.4888[/C][C]0.312929[/C][/ROW]
[ROW][C]6[/C][C]-0.006064[/C][C]-0.0664[/C][C]0.473576[/C][/ROW]
[ROW][C]7[/C][C]-0.038401[/C][C]-0.4207[/C][C]0.337377[/C][/ROW]
[ROW][C]8[/C][C]0.079592[/C][C]0.8719[/C][C]0.192506[/C][/ROW]
[ROW][C]9[/C][C]-0.018834[/C][C]-0.2063[/C][C]0.418447[/C][/ROW]
[ROW][C]10[/C][C]-0.222301[/C][C]-2.4352[/C][C]0.008178[/C][/ROW]
[ROW][C]11[/C][C]0.12483[/C][C]1.3674[/C][C]0.087021[/C][/ROW]
[ROW][C]12[/C][C]0.1012[/C][C]1.1086[/C][C]0.134911[/C][/ROW]
[ROW][C]13[/C][C]-0.229779[/C][C]-2.5171[/C][C]0.006576[/C][/ROW]
[ROW][C]14[/C][C]0.045825[/C][C]0.502[/C][C]0.308298[/C][/ROW]
[ROW][C]15[/C][C]0.061204[/C][C]0.6705[/C][C]0.251928[/C][/ROW]
[ROW][C]16[/C][C]-0.052733[/C][C]-0.5777[/C][C]0.282287[/C][/ROW]
[ROW][C]17[/C][C]-0.066938[/C][C]-0.7333[/C][C]0.232412[/C][/ROW]
[ROW][C]18[/C][C]0.017778[/C][C]0.1947[/C][C]0.422959[/C][/ROW]
[ROW][C]19[/C][C]0.006212[/C][C]0.068[/C][C]0.472932[/C][/ROW]
[ROW][C]20[/C][C]-0.011085[/C][C]-0.1214[/C][C]0.451776[/C][/ROW]
[ROW][C]21[/C][C]0.000335[/C][C]0.0037[/C][C]0.498539[/C][/ROW]
[ROW][C]22[/C][C]-0.079836[/C][C]-0.8746[/C][C]0.19178[/C][/ROW]
[ROW][C]23[/C][C]0.021376[/C][C]0.2342[/C][C]0.40763[/C][/ROW]
[ROW][C]24[/C][C]0.034928[/C][C]0.3826[/C][C]0.35134[/C][/ROW]
[ROW][C]25[/C][C]-0.105951[/C][C]-1.1606[/C][C]0.124046[/C][/ROW]
[ROW][C]26[/C][C]0.039369[/C][C]0.4313[/C][C]0.333524[/C][/ROW]
[ROW][C]27[/C][C]0.008532[/C][C]0.0935[/C][C]0.462847[/C][/ROW]
[ROW][C]28[/C][C]-0.048745[/C][C]-0.534[/C][C]0.297175[/C][/ROW]
[ROW][C]29[/C][C]-0.01216[/C][C]-0.1332[/C][C]0.447125[/C][/ROW]
[ROW][C]30[/C][C]0.02808[/C][C]0.3076[/C][C]0.379461[/C][/ROW]
[ROW][C]31[/C][C]0.006918[/C][C]0.0758[/C][C]0.469857[/C][/ROW]
[ROW][C]32[/C][C]-0.056851[/C][C]-0.6228[/C][C]0.267308[/C][/ROW]
[ROW][C]33[/C][C]0.002287[/C][C]0.0251[/C][C]0.490027[/C][/ROW]
[ROW][C]34[/C][C]-0.052926[/C][C]-0.5798[/C][C]0.281578[/C][/ROW]
[ROW][C]35[/C][C]0.011177[/C][C]0.1224[/C][C]0.451379[/C][/ROW]
[ROW][C]36[/C][C]0.04224[/C][C]0.4627[/C][C]0.322201[/C][/ROW]
[ROW][C]37[/C][C]-0.051908[/C][C]-0.5686[/C][C]0.285338[/C][/ROW]
[ROW][C]38[/C][C]-0.007175[/C][C]-0.0786[/C][C]0.46874[/C][/ROW]
[ROW][C]39[/C][C]0.002524[/C][C]0.0277[/C][C]0.488993[/C][/ROW]
[ROW][C]40[/C][C]-0.018152[/C][C]-0.1988[/C][C]0.421359[/C][/ROW]
[ROW][C]41[/C][C]0.002358[/C][C]0.0258[/C][C]0.489717[/C][/ROW]
[ROW][C]42[/C][C]0.024013[/C][C]0.2631[/C][C]0.396481[/C][/ROW]
[ROW][C]43[/C][C]0.025154[/C][C]0.2755[/C][C]0.391686[/C][/ROW]
[ROW][C]44[/C][C]-0.057282[/C][C]-0.6275[/C][C]0.265764[/C][/ROW]
[ROW][C]45[/C][C]0.008077[/C][C]0.0885[/C][C]0.46482[/C][/ROW]
[ROW][C]46[/C][C]-0.004604[/C][C]-0.0504[/C][C]0.479931[/C][/ROW]
[ROW][C]47[/C][C]0.018404[/C][C]0.2016[/C][C]0.420284[/C][/ROW]
[ROW][C]48[/C][C]0.024198[/C][C]0.2651[/C][C]0.395702[/C][/ROW]
[/TABLE]
Source: https://freestatistics.org/blog/index.php?pk=78254&T=2

Globally Unique Identifier (entire table): ba.freestatistics.org/blog/index.php?pk=78254&T=2

As an alternative you can also use a QR Code:  

The GUIDs for individual cells are displayed in the table below:

Partial Autocorrelation Function
Time lag kPACF(k)T-STATP-value
10.95880510.50320
20.0833130.91270.181628
30.1257571.37760.085445
4-0.110709-1.21280.113803
5-0.044623-0.48880.312929
6-0.006064-0.06640.473576
7-0.038401-0.42070.337377
80.0795920.87190.192506
9-0.018834-0.20630.418447
10-0.222301-2.43520.008178
110.124831.36740.087021
120.10121.10860.134911
13-0.229779-2.51710.006576
140.0458250.5020.308298
150.0612040.67050.251928
16-0.052733-0.57770.282287
17-0.066938-0.73330.232412
180.0177780.19470.422959
190.0062120.0680.472932
20-0.011085-0.12140.451776
210.0003350.00370.498539
22-0.079836-0.87460.19178
230.0213760.23420.40763
240.0349280.38260.35134
25-0.105951-1.16060.124046
260.0393690.43130.333524
270.0085320.09350.462847
28-0.048745-0.5340.297175
29-0.01216-0.13320.447125
300.028080.30760.379461
310.0069180.07580.469857
32-0.056851-0.62280.267308
330.0022870.02510.490027
34-0.052926-0.57980.281578
350.0111770.12240.451379
360.042240.46270.322201
37-0.051908-0.56860.285338
38-0.007175-0.07860.46874
390.0025240.02770.488993
40-0.018152-0.19880.421359
410.0023580.02580.489717
420.0240130.26310.396481
430.0251540.27550.391686
44-0.057282-0.62750.265764
450.0080770.08850.46482
46-0.004604-0.05040.479931
470.0184040.20160.420284
480.0241980.26510.395702


Parameters (Session):
Parameters (R input):
par1 = 48 ; par2 = 1 ; par3 = 0 ; par4 = 0 ; par5 = 12 ; par6 = White Noise ; par7 = 0.95 ;
R code (references can be found in the software module):
if (par1 == 'Default') {
par1 = 10*log10(length(x))
} else {
par1 <- as.numeric(par1)
}
par2 <- as.numeric(par2)
par3 <- as.numeric(par3)
par4 <- as.numeric(par4)
par5 <- as.numeric(par5)
if (par6 == 'White Noise') par6 <- 'white' else par6 <- 'ma'
par7 <- as.numeric(par7)
if (par2 == 0) {
x <- log(x)
} else {
x <- (x ^ par2 - 1) / par2
}
if (par3 > 0) x <- diff(x,lag=1,difference=par3)
if (par4 > 0) x <- diff(x,lag=par5,difference=par4)
bitmap(file='pic1.png')
racf <- acf(x, par1, main='Autocorrelation', xlab='time lag', ylab='ACF', ci.type=par6, ci=par7, sub=paste('(lambda=',par2,', d=',par3,', D=',par4,', CI=', par7, ', CI type=',par6,')',sep=''))
dev.off()
bitmap(file='pic2.png')
rpacf <- pacf(x,par1,main='Partial Autocorrelation',xlab='lags',ylab='PACF')
dev.off()
(myacf <- c(racf$acf))
(mypacf <- c(rpacf$acf))
lengthx <- length(x)
sqrtn <- sqrt(lengthx)
load(file='createtable')
a<-table.start()
a<-table.row.start(a)
a<-table.element(a,'Autocorrelation Function',4,TRUE)
a<-table.row.end(a)
a<-table.row.start(a)
a<-table.element(a,'Time lag k',header=TRUE)
a<-table.element(a,hyperlink('basics.htm','ACF(k)','click here for more information about the Autocorrelation Function'),header=TRUE)
a<-table.element(a,'T-STAT',header=TRUE)
a<-table.element(a,'P-value',header=TRUE)
a<-table.row.end(a)
for (i in 2:(par1+1)) {
a<-table.row.start(a)
a<-table.element(a,i-1,header=TRUE)
a<-table.element(a,round(myacf[i],6))
mytstat <- myacf[i]*sqrtn
a<-table.element(a,round(mytstat,4))
a<-table.element(a,round(1-pt(abs(mytstat),lengthx),6))
a<-table.row.end(a)
}
a<-table.end(a)
table.save(a,file='mytable.tab')
a<-table.start()
a<-table.row.start(a)
a<-table.element(a,'Partial Autocorrelation Function',4,TRUE)
a<-table.row.end(a)
a<-table.row.start(a)
a<-table.element(a,'Time lag k',header=TRUE)
a<-table.element(a,hyperlink('basics.htm','PACF(k)','click here for more information about the Partial Autocorrelation Function'),header=TRUE)
a<-table.element(a,'T-STAT',header=TRUE)
a<-table.element(a,'P-value',header=TRUE)
a<-table.row.end(a)
for (i in 1:par1) {
a<-table.row.start(a)
a<-table.element(a,i,header=TRUE)
a<-table.element(a,round(mypacf[i],6))
mytstat <- mypacf[i]*sqrtn
a<-table.element(a,round(mytstat,4))
a<-table.element(a,round(1-pt(abs(mytstat),lengthx),6))
a<-table.row.end(a)
}
a<-table.end(a)
table.save(a,file='mytable1.tab')