Free Statistics

of Irreproducible Research!

Author's title

Author*Unverified author*
R Software Modulerwasp_centraltendency.wasp
Title produced by softwareCentral Tendency
Date of computationSun, 25 Apr 2010 09:19:26 +0000
Cite this page as followsStatistical Computations at FreeStatistics.org, Office for Research Development and Education, URL https://freestatistics.org/blog/index.php?v=date/2010/Apr/25/t1272187217f81bsqrs8b8mqm2.htm/, Retrieved Sat, 27 Apr 2024 19:08:18 +0000
Statistical Computations at FreeStatistics.org, Office for Research Development and Education, URL https://freestatistics.org/blog/index.php?pk=74775, Retrieved Sat, 27 Apr 2024 19:08:18 +0000
QR Codes:

Original text written by user:
IsPrivate?No (this computation is public)
User-defined keywordsKDGP1W52
Estimated Impact201
Family? (F = Feedback message, R = changed R code, M = changed R Module, P = changed Parameters, D = changed Data)
-       [Central Tendency] [retail sales and ...] [2010-04-25 09:19:26] [35611de12c9fa8a4a915f3548e0dcd01] [Current]
Feedback Forum

Post a new message
Dataseries X:
357704
281463
282445
319107
315278
328499
321151
328025
326280
313444
319639
324067
386918
293009
294822
338844
335407
345080
350608
351285
355147
332791
335615
343202
404868
317902
313552
361505
351436
373350
366310
361669
375078
345547
348117
356089
416856
328087
322747
373626
358275
391287
376371
371848
387261
353159
367855
376822
425283
342191
344062
373587
370144
399979
380431
385909
384798
352554
352479
338788
387964
313593
304056
334149
336155
354668
351418
354316
359483
330411
344726
347175


Summary of computational transaction
Raw Inputview raw input (R code)
Raw Outputview raw output of R engine
Computing time1 seconds
R Server'Gwilym Jenkins' @ 72.249.127.135

\begin{tabular}{lllllllll}
\hline
Summary of computational transaction \tabularnewline
Raw Input & view raw input (R code)  \tabularnewline
Raw Output & view raw output of R engine  \tabularnewline
Computing time & 1 seconds \tabularnewline
R Server & 'Gwilym Jenkins' @ 72.249.127.135 \tabularnewline
\hline
\end{tabular}
%Source: https://freestatistics.org/blog/index.php?pk=74775&T=0

[TABLE]
[ROW][C]Summary of computational transaction[/C][/ROW]
[ROW][C]Raw Input[/C][C]view raw input (R code) [/C][/ROW]
[ROW][C]Raw Output[/C][C]view raw output of R engine [/C][/ROW]
[ROW][C]Computing time[/C][C]1 seconds[/C][/ROW]
[ROW][C]R Server[/C][C]'Gwilym Jenkins' @ 72.249.127.135[/C][/ROW]
[/TABLE]
Source: https://freestatistics.org/blog/index.php?pk=74775&T=0

Globally Unique Identifier (entire table): ba.freestatistics.org/blog/index.php?pk=74775&T=0

As an alternative you can also use a QR Code:  

The GUIDs for individual cells are displayed in the table below:

Summary of computational transaction
Raw Inputview raw input (R code)
Raw Outputview raw output of R engine
Computing time1 seconds
R Server'Gwilym Jenkins' @ 72.249.127.135


Central Tendency - Ungrouped Data
MeasureValueS.E.Value/S.E.
Arithmetic Mean349274.5277777783503.374451095799.696601848695
Geometric Mean348020.808421584
Harmonic Mean346758.604795102
Quadratic Mean350519.790689564
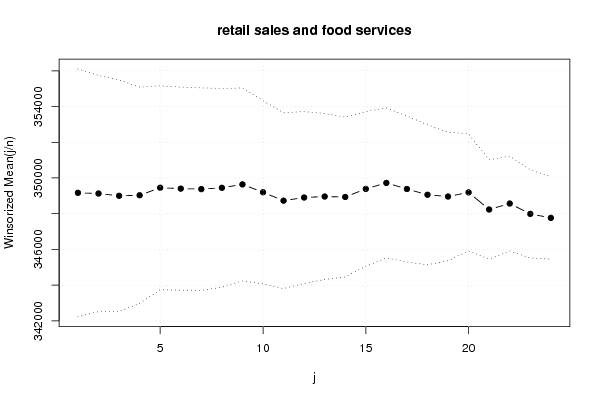
Winsorized Mean ( 1 / 24 )349171.1253465.67648360619100.751217446780
Winsorized Mean ( 2 / 24 )349131.5694444443305.19500624015105.631156039293
Winsorized Mean ( 3 / 24 )349003.4027777783240.49122700199107.700770756496
Winsorized Mean ( 4 / 24 )349033.5138888893024.93815124456115.385338951570
Winsorized Mean ( 5 / 24 )349454.6944444442853.78636489264122.452997443483
Winsorized Mean ( 6 / 24 )349405.1111111112841.1224668255122.981362187289
Winsorized Mean ( 7 / 24 )349375.752834.17397579927123.272513608298
Winsorized Mean ( 8 / 24 )349450.8611111112780.50805999835125.678780126003
Winsorized Mean ( 9 / 24 )349639.9861111112699.38054705702129.526007917744
Winsorized Mean ( 10 / 24 )349200.8194444442563.93734751040136.197095371117
Winsorized Mean ( 11 / 24 )348730.7222222222458.72739001550141.833829825283
Winsorized Mean ( 12 / 24 )348907.5555555562405.15156495927145.066764456262
Winsorized Mean ( 13 / 24 )348962.2638888892321.53467964117150.315335346542
Winsorized Mean ( 14 / 24 )348936.5972222222236.69898511699156.005166338452
Winsorized Mean ( 15 / 24 )349389.5138888892164.64163357286161.407555167551
Winsorized Mean ( 16 / 24 )349724.6252098.92042183169166.621193144046
Winsorized Mean ( 17 / 24 )349384.6252041.17425981587171.168445476829
Winsorized Mean ( 18 / 24 )349061.6251960.71186495761178.028006683963
Winsorized Mean ( 19 / 24 )348962.1388888891796.20094832257194.277894806133
Winsorized Mean ( 20 / 24 )349194.0833333331638.04931781252213.176782613391
Winsorized Mean ( 21 / 24 )348236.5416666671389.49642719244250.620681602111
Winsorized Mean ( 22 / 24 )348570.8194444441328.36519676653262.405865715938
Winsorized Mean ( 23 / 24 )347991.3472222221232.25023628317282.403149113501
Winsorized Mean ( 24 / 24 )347768.6805555561154.49660168262301.229713494783
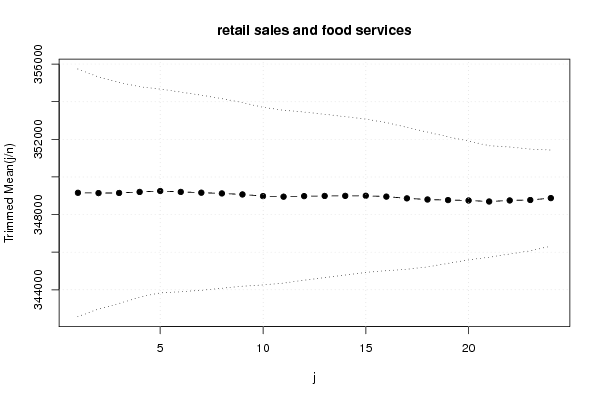
Trimmed Mean ( 1 / 24 )349157.4285714293292.69718847297106.039944940505
Trimmed Mean ( 2 / 24 )349142.9264705883084.00457011041113.210897887252
Trimmed Mean ( 3 / 24 )349149.1212121212939.80778548952118.765969304345
Trimmed Mean ( 4 / 24 )349203.7656252796.89860336251124.853923987511
Trimmed Mean ( 5 / 24 )349253.1935483872707.85433846995128.977836284107
Trimmed Mean ( 6 / 24 )349204.8333333332654.83546131353131.535395854837
Trimmed Mean ( 7 / 24 )349163.3965517242593.15025417692134.648347502929
Trimmed Mean ( 8 / 24 )349124.3928571432518.77439915076138.608838082067
Trimmed Mean ( 9 / 24 )349069.9814814812440.15484173356143.052389754698
Trimmed Mean ( 10 / 24 )348982.2884615382361.79300949741147.761589207093
Trimmed Mean ( 11 / 24 )348950.822295.64163662985152.005789767902
Trimmed Mean ( 12 / 24 )348980.8333333332235.61190382306156.100811923818
Trimmed Mean ( 13 / 24 )348990.3913043482170.36184598123160.798252121211
Trimmed Mean ( 14 / 24 )348993.9318181822104.73574503922165.813657434548
Trimmed Mean ( 15 / 24 )349000.9523809522038.15261224290171.233964662191
Trimmed Mean ( 16 / 24 )348954.3251966.46555818362177.452548582809
Trimmed Mean ( 17 / 24 )348863.1052631581885.59667378823185.014701241639
Trimmed Mean ( 18 / 24 )348801.751790.38661577006194.819234531631
Trimmed Mean ( 19 / 24 )348771.1764705881681.18058131969207.456105754452
Trimmed Mean ( 20 / 24 )348748.56251577.90959353122221.019356197418
Trimmed Mean ( 21 / 24 )348695.11480.42656973955235.536910190247
Trimmed Mean ( 22 / 24 )348751.251421.09358518147245.410473762336
Trimmed Mean ( 23 / 24 )348773.9615384621350.78707367311258.200547174369
Trimmed Mean ( 24 / 24 )348876.0416666671275.40477729190273.541426124687
Median350946.5
Midrange353373
Midmean - Weighted Average at Xnp348241.891891892
Midmean - Weighted Average at X(n+1)p348801.75
Midmean - Empirical Distribution Function348241.891891892
Midmean - Empirical Distribution Function - Averaging348801.75
Midmean - Empirical Distribution Function - Interpolation348801.75
Midmean - Closest Observation348241.891891892
Midmean - True Basic - Statistics Graphics Toolkit348801.75
Midmean - MS Excel (old versions)348863.105263158
Number of observations72

\begin{tabular}{lllllllll}
\hline
Central Tendency - Ungrouped Data \tabularnewline
Measure & Value & S.E. & Value/S.E. \tabularnewline
Arithmetic Mean & 349274.527777778 & 3503.3744510957 & 99.696601848695 \tabularnewline
Geometric Mean & 348020.808421584 &  &  \tabularnewline
Harmonic Mean & 346758.604795102 &  &  \tabularnewline
Quadratic Mean & 350519.790689564 &  &  \tabularnewline
Winsorized Mean ( 1 / 24 ) & 349171.125 & 3465.67648360619 & 100.751217446780 \tabularnewline
Winsorized Mean ( 2 / 24 ) & 349131.569444444 & 3305.19500624015 & 105.631156039293 \tabularnewline
Winsorized Mean ( 3 / 24 ) & 349003.402777778 & 3240.49122700199 & 107.700770756496 \tabularnewline
Winsorized Mean ( 4 / 24 ) & 349033.513888889 & 3024.93815124456 & 115.385338951570 \tabularnewline
Winsorized Mean ( 5 / 24 ) & 349454.694444444 & 2853.78636489264 & 122.452997443483 \tabularnewline
Winsorized Mean ( 6 / 24 ) & 349405.111111111 & 2841.1224668255 & 122.981362187289 \tabularnewline
Winsorized Mean ( 7 / 24 ) & 349375.75 & 2834.17397579927 & 123.272513608298 \tabularnewline
Winsorized Mean ( 8 / 24 ) & 349450.861111111 & 2780.50805999835 & 125.678780126003 \tabularnewline
Winsorized Mean ( 9 / 24 ) & 349639.986111111 & 2699.38054705702 & 129.526007917744 \tabularnewline
Winsorized Mean ( 10 / 24 ) & 349200.819444444 & 2563.93734751040 & 136.197095371117 \tabularnewline
Winsorized Mean ( 11 / 24 ) & 348730.722222222 & 2458.72739001550 & 141.833829825283 \tabularnewline
Winsorized Mean ( 12 / 24 ) & 348907.555555556 & 2405.15156495927 & 145.066764456262 \tabularnewline
Winsorized Mean ( 13 / 24 ) & 348962.263888889 & 2321.53467964117 & 150.315335346542 \tabularnewline
Winsorized Mean ( 14 / 24 ) & 348936.597222222 & 2236.69898511699 & 156.005166338452 \tabularnewline
Winsorized Mean ( 15 / 24 ) & 349389.513888889 & 2164.64163357286 & 161.407555167551 \tabularnewline
Winsorized Mean ( 16 / 24 ) & 349724.625 & 2098.92042183169 & 166.621193144046 \tabularnewline
Winsorized Mean ( 17 / 24 ) & 349384.625 & 2041.17425981587 & 171.168445476829 \tabularnewline
Winsorized Mean ( 18 / 24 ) & 349061.625 & 1960.71186495761 & 178.028006683963 \tabularnewline
Winsorized Mean ( 19 / 24 ) & 348962.138888889 & 1796.20094832257 & 194.277894806133 \tabularnewline
Winsorized Mean ( 20 / 24 ) & 349194.083333333 & 1638.04931781252 & 213.176782613391 \tabularnewline
Winsorized Mean ( 21 / 24 ) & 348236.541666667 & 1389.49642719244 & 250.620681602111 \tabularnewline
Winsorized Mean ( 22 / 24 ) & 348570.819444444 & 1328.36519676653 & 262.405865715938 \tabularnewline
Winsorized Mean ( 23 / 24 ) & 347991.347222222 & 1232.25023628317 & 282.403149113501 \tabularnewline
Winsorized Mean ( 24 / 24 ) & 347768.680555556 & 1154.49660168262 & 301.229713494783 \tabularnewline
Trimmed Mean ( 1 / 24 ) & 349157.428571429 & 3292.69718847297 & 106.039944940505 \tabularnewline
Trimmed Mean ( 2 / 24 ) & 349142.926470588 & 3084.00457011041 & 113.210897887252 \tabularnewline
Trimmed Mean ( 3 / 24 ) & 349149.121212121 & 2939.80778548952 & 118.765969304345 \tabularnewline
Trimmed Mean ( 4 / 24 ) & 349203.765625 & 2796.89860336251 & 124.853923987511 \tabularnewline
Trimmed Mean ( 5 / 24 ) & 349253.193548387 & 2707.85433846995 & 128.977836284107 \tabularnewline
Trimmed Mean ( 6 / 24 ) & 349204.833333333 & 2654.83546131353 & 131.535395854837 \tabularnewline
Trimmed Mean ( 7 / 24 ) & 349163.396551724 & 2593.15025417692 & 134.648347502929 \tabularnewline
Trimmed Mean ( 8 / 24 ) & 349124.392857143 & 2518.77439915076 & 138.608838082067 \tabularnewline
Trimmed Mean ( 9 / 24 ) & 349069.981481481 & 2440.15484173356 & 143.052389754698 \tabularnewline
Trimmed Mean ( 10 / 24 ) & 348982.288461538 & 2361.79300949741 & 147.761589207093 \tabularnewline
Trimmed Mean ( 11 / 24 ) & 348950.82 & 2295.64163662985 & 152.005789767902 \tabularnewline
Trimmed Mean ( 12 / 24 ) & 348980.833333333 & 2235.61190382306 & 156.100811923818 \tabularnewline
Trimmed Mean ( 13 / 24 ) & 348990.391304348 & 2170.36184598123 & 160.798252121211 \tabularnewline
Trimmed Mean ( 14 / 24 ) & 348993.931818182 & 2104.73574503922 & 165.813657434548 \tabularnewline
Trimmed Mean ( 15 / 24 ) & 349000.952380952 & 2038.15261224290 & 171.233964662191 \tabularnewline
Trimmed Mean ( 16 / 24 ) & 348954.325 & 1966.46555818362 & 177.452548582809 \tabularnewline
Trimmed Mean ( 17 / 24 ) & 348863.105263158 & 1885.59667378823 & 185.014701241639 \tabularnewline
Trimmed Mean ( 18 / 24 ) & 348801.75 & 1790.38661577006 & 194.819234531631 \tabularnewline
Trimmed Mean ( 19 / 24 ) & 348771.176470588 & 1681.18058131969 & 207.456105754452 \tabularnewline
Trimmed Mean ( 20 / 24 ) & 348748.5625 & 1577.90959353122 & 221.019356197418 \tabularnewline
Trimmed Mean ( 21 / 24 ) & 348695.1 & 1480.42656973955 & 235.536910190247 \tabularnewline
Trimmed Mean ( 22 / 24 ) & 348751.25 & 1421.09358518147 & 245.410473762336 \tabularnewline
Trimmed Mean ( 23 / 24 ) & 348773.961538462 & 1350.78707367311 & 258.200547174369 \tabularnewline
Trimmed Mean ( 24 / 24 ) & 348876.041666667 & 1275.40477729190 & 273.541426124687 \tabularnewline
Median & 350946.5 &  &  \tabularnewline
Midrange & 353373 &  &  \tabularnewline
Midmean - Weighted Average at Xnp & 348241.891891892 &  &  \tabularnewline
Midmean - Weighted Average at X(n+1)p & 348801.75 &  &  \tabularnewline
Midmean - Empirical Distribution Function & 348241.891891892 &  &  \tabularnewline
Midmean - Empirical Distribution Function - Averaging & 348801.75 &  &  \tabularnewline
Midmean - Empirical Distribution Function - Interpolation & 348801.75 &  &  \tabularnewline
Midmean - Closest Observation & 348241.891891892 &  &  \tabularnewline
Midmean - True Basic - Statistics Graphics Toolkit & 348801.75 &  &  \tabularnewline
Midmean - MS Excel (old versions) & 348863.105263158 &  &  \tabularnewline
Number of observations & 72 &  &  \tabularnewline
\hline
\end{tabular}
%Source: https://freestatistics.org/blog/index.php?pk=74775&T=1

[TABLE]
[ROW][C]Central Tendency - Ungrouped Data[/C][/ROW]
[ROW][C]Measure[/C][C]Value[/C][C]S.E.[/C][C]Value/S.E.[/C][/ROW]
[ROW][C]Arithmetic Mean[/C][C]349274.527777778[/C][C]3503.3744510957[/C][C]99.696601848695[/C][/ROW]
[ROW][C]Geometric Mean[/C][C]348020.808421584[/C][C][/C][C][/C][/ROW]
[ROW][C]Harmonic Mean[/C][C]346758.604795102[/C][C][/C][C][/C][/ROW]
[ROW][C]Quadratic Mean[/C][C]350519.790689564[/C][C][/C][C][/C][/ROW]
[ROW][C]Winsorized Mean ( 1 / 24 )[/C][C]349171.125[/C][C]3465.67648360619[/C][C]100.751217446780[/C][/ROW]
[ROW][C]Winsorized Mean ( 2 / 24 )[/C][C]349131.569444444[/C][C]3305.19500624015[/C][C]105.631156039293[/C][/ROW]
[ROW][C]Winsorized Mean ( 3 / 24 )[/C][C]349003.402777778[/C][C]3240.49122700199[/C][C]107.700770756496[/C][/ROW]
[ROW][C]Winsorized Mean ( 4 / 24 )[/C][C]349033.513888889[/C][C]3024.93815124456[/C][C]115.385338951570[/C][/ROW]
[ROW][C]Winsorized Mean ( 5 / 24 )[/C][C]349454.694444444[/C][C]2853.78636489264[/C][C]122.452997443483[/C][/ROW]
[ROW][C]Winsorized Mean ( 6 / 24 )[/C][C]349405.111111111[/C][C]2841.1224668255[/C][C]122.981362187289[/C][/ROW]
[ROW][C]Winsorized Mean ( 7 / 24 )[/C][C]349375.75[/C][C]2834.17397579927[/C][C]123.272513608298[/C][/ROW]
[ROW][C]Winsorized Mean ( 8 / 24 )[/C][C]349450.861111111[/C][C]2780.50805999835[/C][C]125.678780126003[/C][/ROW]
[ROW][C]Winsorized Mean ( 9 / 24 )[/C][C]349639.986111111[/C][C]2699.38054705702[/C][C]129.526007917744[/C][/ROW]
[ROW][C]Winsorized Mean ( 10 / 24 )[/C][C]349200.819444444[/C][C]2563.93734751040[/C][C]136.197095371117[/C][/ROW]
[ROW][C]Winsorized Mean ( 11 / 24 )[/C][C]348730.722222222[/C][C]2458.72739001550[/C][C]141.833829825283[/C][/ROW]
[ROW][C]Winsorized Mean ( 12 / 24 )[/C][C]348907.555555556[/C][C]2405.15156495927[/C][C]145.066764456262[/C][/ROW]
[ROW][C]Winsorized Mean ( 13 / 24 )[/C][C]348962.263888889[/C][C]2321.53467964117[/C][C]150.315335346542[/C][/ROW]
[ROW][C]Winsorized Mean ( 14 / 24 )[/C][C]348936.597222222[/C][C]2236.69898511699[/C][C]156.005166338452[/C][/ROW]
[ROW][C]Winsorized Mean ( 15 / 24 )[/C][C]349389.513888889[/C][C]2164.64163357286[/C][C]161.407555167551[/C][/ROW]
[ROW][C]Winsorized Mean ( 16 / 24 )[/C][C]349724.625[/C][C]2098.92042183169[/C][C]166.621193144046[/C][/ROW]
[ROW][C]Winsorized Mean ( 17 / 24 )[/C][C]349384.625[/C][C]2041.17425981587[/C][C]171.168445476829[/C][/ROW]
[ROW][C]Winsorized Mean ( 18 / 24 )[/C][C]349061.625[/C][C]1960.71186495761[/C][C]178.028006683963[/C][/ROW]
[ROW][C]Winsorized Mean ( 19 / 24 )[/C][C]348962.138888889[/C][C]1796.20094832257[/C][C]194.277894806133[/C][/ROW]
[ROW][C]Winsorized Mean ( 20 / 24 )[/C][C]349194.083333333[/C][C]1638.04931781252[/C][C]213.176782613391[/C][/ROW]
[ROW][C]Winsorized Mean ( 21 / 24 )[/C][C]348236.541666667[/C][C]1389.49642719244[/C][C]250.620681602111[/C][/ROW]
[ROW][C]Winsorized Mean ( 22 / 24 )[/C][C]348570.819444444[/C][C]1328.36519676653[/C][C]262.405865715938[/C][/ROW]
[ROW][C]Winsorized Mean ( 23 / 24 )[/C][C]347991.347222222[/C][C]1232.25023628317[/C][C]282.403149113501[/C][/ROW]
[ROW][C]Winsorized Mean ( 24 / 24 )[/C][C]347768.680555556[/C][C]1154.49660168262[/C][C]301.229713494783[/C][/ROW]
[ROW][C]Trimmed Mean ( 1 / 24 )[/C][C]349157.428571429[/C][C]3292.69718847297[/C][C]106.039944940505[/C][/ROW]
[ROW][C]Trimmed Mean ( 2 / 24 )[/C][C]349142.926470588[/C][C]3084.00457011041[/C][C]113.210897887252[/C][/ROW]
[ROW][C]Trimmed Mean ( 3 / 24 )[/C][C]349149.121212121[/C][C]2939.80778548952[/C][C]118.765969304345[/C][/ROW]
[ROW][C]Trimmed Mean ( 4 / 24 )[/C][C]349203.765625[/C][C]2796.89860336251[/C][C]124.853923987511[/C][/ROW]
[ROW][C]Trimmed Mean ( 5 / 24 )[/C][C]349253.193548387[/C][C]2707.85433846995[/C][C]128.977836284107[/C][/ROW]
[ROW][C]Trimmed Mean ( 6 / 24 )[/C][C]349204.833333333[/C][C]2654.83546131353[/C][C]131.535395854837[/C][/ROW]
[ROW][C]Trimmed Mean ( 7 / 24 )[/C][C]349163.396551724[/C][C]2593.15025417692[/C][C]134.648347502929[/C][/ROW]
[ROW][C]Trimmed Mean ( 8 / 24 )[/C][C]349124.392857143[/C][C]2518.77439915076[/C][C]138.608838082067[/C][/ROW]
[ROW][C]Trimmed Mean ( 9 / 24 )[/C][C]349069.981481481[/C][C]2440.15484173356[/C][C]143.052389754698[/C][/ROW]
[ROW][C]Trimmed Mean ( 10 / 24 )[/C][C]348982.288461538[/C][C]2361.79300949741[/C][C]147.761589207093[/C][/ROW]
[ROW][C]Trimmed Mean ( 11 / 24 )[/C][C]348950.82[/C][C]2295.64163662985[/C][C]152.005789767902[/C][/ROW]
[ROW][C]Trimmed Mean ( 12 / 24 )[/C][C]348980.833333333[/C][C]2235.61190382306[/C][C]156.100811923818[/C][/ROW]
[ROW][C]Trimmed Mean ( 13 / 24 )[/C][C]348990.391304348[/C][C]2170.36184598123[/C][C]160.798252121211[/C][/ROW]
[ROW][C]Trimmed Mean ( 14 / 24 )[/C][C]348993.931818182[/C][C]2104.73574503922[/C][C]165.813657434548[/C][/ROW]
[ROW][C]Trimmed Mean ( 15 / 24 )[/C][C]349000.952380952[/C][C]2038.15261224290[/C][C]171.233964662191[/C][/ROW]
[ROW][C]Trimmed Mean ( 16 / 24 )[/C][C]348954.325[/C][C]1966.46555818362[/C][C]177.452548582809[/C][/ROW]
[ROW][C]Trimmed Mean ( 17 / 24 )[/C][C]348863.105263158[/C][C]1885.59667378823[/C][C]185.014701241639[/C][/ROW]
[ROW][C]Trimmed Mean ( 18 / 24 )[/C][C]348801.75[/C][C]1790.38661577006[/C][C]194.819234531631[/C][/ROW]
[ROW][C]Trimmed Mean ( 19 / 24 )[/C][C]348771.176470588[/C][C]1681.18058131969[/C][C]207.456105754452[/C][/ROW]
[ROW][C]Trimmed Mean ( 20 / 24 )[/C][C]348748.5625[/C][C]1577.90959353122[/C][C]221.019356197418[/C][/ROW]
[ROW][C]Trimmed Mean ( 21 / 24 )[/C][C]348695.1[/C][C]1480.42656973955[/C][C]235.536910190247[/C][/ROW]
[ROW][C]Trimmed Mean ( 22 / 24 )[/C][C]348751.25[/C][C]1421.09358518147[/C][C]245.410473762336[/C][/ROW]
[ROW][C]Trimmed Mean ( 23 / 24 )[/C][C]348773.961538462[/C][C]1350.78707367311[/C][C]258.200547174369[/C][/ROW]
[ROW][C]Trimmed Mean ( 24 / 24 )[/C][C]348876.041666667[/C][C]1275.40477729190[/C][C]273.541426124687[/C][/ROW]
[ROW][C]Median[/C][C]350946.5[/C][C][/C][C][/C][/ROW]
[ROW][C]Midrange[/C][C]353373[/C][C][/C][C][/C][/ROW]
[ROW][C]Midmean - Weighted Average at Xnp[/C][C]348241.891891892[/C][C][/C][C][/C][/ROW]
[ROW][C]Midmean - Weighted Average at X(n+1)p[/C][C]348801.75[/C][C][/C][C][/C][/ROW]
[ROW][C]Midmean - Empirical Distribution Function[/C][C]348241.891891892[/C][C][/C][C][/C][/ROW]
[ROW][C]Midmean - Empirical Distribution Function - Averaging[/C][C]348801.75[/C][C][/C][C][/C][/ROW]
[ROW][C]Midmean - Empirical Distribution Function - Interpolation[/C][C]348801.75[/C][C][/C][C][/C][/ROW]
[ROW][C]Midmean - Closest Observation[/C][C]348241.891891892[/C][C][/C][C][/C][/ROW]
[ROW][C]Midmean - True Basic - Statistics Graphics Toolkit[/C][C]348801.75[/C][C][/C][C][/C][/ROW]
[ROW][C]Midmean - MS Excel (old versions)[/C][C]348863.105263158[/C][C][/C][C][/C][/ROW]
[ROW][C]Number of observations[/C][C]72[/C][C][/C][C][/C][/ROW]
[/TABLE]
Source: https://freestatistics.org/blog/index.php?pk=74775&T=1

Globally Unique Identifier (entire table): ba.freestatistics.org/blog/index.php?pk=74775&T=1

As an alternative you can also use a QR Code:  

The GUIDs for individual cells are displayed in the table below:

Central Tendency - Ungrouped Data
MeasureValueS.E.Value/S.E.
Arithmetic Mean349274.5277777783503.374451095799.696601848695
Geometric Mean348020.808421584
Harmonic Mean346758.604795102
Quadratic Mean350519.790689564
Winsorized Mean ( 1 / 24 )349171.1253465.67648360619100.751217446780
Winsorized Mean ( 2 / 24 )349131.5694444443305.19500624015105.631156039293
Winsorized Mean ( 3 / 24 )349003.4027777783240.49122700199107.700770756496
Winsorized Mean ( 4 / 24 )349033.5138888893024.93815124456115.385338951570
Winsorized Mean ( 5 / 24 )349454.6944444442853.78636489264122.452997443483
Winsorized Mean ( 6 / 24 )349405.1111111112841.1224668255122.981362187289
Winsorized Mean ( 7 / 24 )349375.752834.17397579927123.272513608298
Winsorized Mean ( 8 / 24 )349450.8611111112780.50805999835125.678780126003
Winsorized Mean ( 9 / 24 )349639.9861111112699.38054705702129.526007917744
Winsorized Mean ( 10 / 24 )349200.8194444442563.93734751040136.197095371117
Winsorized Mean ( 11 / 24 )348730.7222222222458.72739001550141.833829825283
Winsorized Mean ( 12 / 24 )348907.5555555562405.15156495927145.066764456262
Winsorized Mean ( 13 / 24 )348962.2638888892321.53467964117150.315335346542
Winsorized Mean ( 14 / 24 )348936.5972222222236.69898511699156.005166338452
Winsorized Mean ( 15 / 24 )349389.5138888892164.64163357286161.407555167551
Winsorized Mean ( 16 / 24 )349724.6252098.92042183169166.621193144046
Winsorized Mean ( 17 / 24 )349384.6252041.17425981587171.168445476829
Winsorized Mean ( 18 / 24 )349061.6251960.71186495761178.028006683963
Winsorized Mean ( 19 / 24 )348962.1388888891796.20094832257194.277894806133
Winsorized Mean ( 20 / 24 )349194.0833333331638.04931781252213.176782613391
Winsorized Mean ( 21 / 24 )348236.5416666671389.49642719244250.620681602111
Winsorized Mean ( 22 / 24 )348570.8194444441328.36519676653262.405865715938
Winsorized Mean ( 23 / 24 )347991.3472222221232.25023628317282.403149113501
Winsorized Mean ( 24 / 24 )347768.6805555561154.49660168262301.229713494783
Trimmed Mean ( 1 / 24 )349157.4285714293292.69718847297106.039944940505
Trimmed Mean ( 2 / 24 )349142.9264705883084.00457011041113.210897887252
Trimmed Mean ( 3 / 24 )349149.1212121212939.80778548952118.765969304345
Trimmed Mean ( 4 / 24 )349203.7656252796.89860336251124.853923987511
Trimmed Mean ( 5 / 24 )349253.1935483872707.85433846995128.977836284107
Trimmed Mean ( 6 / 24 )349204.8333333332654.83546131353131.535395854837
Trimmed Mean ( 7 / 24 )349163.3965517242593.15025417692134.648347502929
Trimmed Mean ( 8 / 24 )349124.3928571432518.77439915076138.608838082067
Trimmed Mean ( 9 / 24 )349069.9814814812440.15484173356143.052389754698
Trimmed Mean ( 10 / 24 )348982.2884615382361.79300949741147.761589207093
Trimmed Mean ( 11 / 24 )348950.822295.64163662985152.005789767902
Trimmed Mean ( 12 / 24 )348980.8333333332235.61190382306156.100811923818
Trimmed Mean ( 13 / 24 )348990.3913043482170.36184598123160.798252121211
Trimmed Mean ( 14 / 24 )348993.9318181822104.73574503922165.813657434548
Trimmed Mean ( 15 / 24 )349000.9523809522038.15261224290171.233964662191
Trimmed Mean ( 16 / 24 )348954.3251966.46555818362177.452548582809
Trimmed Mean ( 17 / 24 )348863.1052631581885.59667378823185.014701241639
Trimmed Mean ( 18 / 24 )348801.751790.38661577006194.819234531631
Trimmed Mean ( 19 / 24 )348771.1764705881681.18058131969207.456105754452
Trimmed Mean ( 20 / 24 )348748.56251577.90959353122221.019356197418
Trimmed Mean ( 21 / 24 )348695.11480.42656973955235.536910190247
Trimmed Mean ( 22 / 24 )348751.251421.09358518147245.410473762336
Trimmed Mean ( 23 / 24 )348773.9615384621350.78707367311258.200547174369
Trimmed Mean ( 24 / 24 )348876.0416666671275.40477729190273.541426124687
Median350946.5
Midrange353373
Midmean - Weighted Average at Xnp348241.891891892
Midmean - Weighted Average at X(n+1)p348801.75
Midmean - Empirical Distribution Function348241.891891892
Midmean - Empirical Distribution Function - Averaging348801.75
Midmean - Empirical Distribution Function - Interpolation348801.75
Midmean - Closest Observation348241.891891892
Midmean - True Basic - Statistics Graphics Toolkit348801.75
Midmean - MS Excel (old versions)348863.105263158
Number of observations72


Parameters (Session):
Parameters (R input):
R code (references can be found in the software module):
geomean <- function(x) {
return(exp(mean(log(x))))
}
harmean <- function(x) {
return(1/mean(1/x))
}
quamean <- function(x) {
return(sqrt(mean(x*x)))
}
winmean <- function(x) {
x <-sort(x[!is.na(x)])
n<-length(x)
denom <- 3
nodenom <- n/denom
if (nodenom>40) denom <- n/40
sqrtn = sqrt(n)
roundnodenom = floor(nodenom)
win <- array(NA,dim=c(roundnodenom,2))
for (j in 1:roundnodenom) {
win[j,1] <- (j*x[j+1]+sum(x[(j+1):(n-j)])+j*x[n-j])/n
win[j,2] <- sd(c(rep(x[j+1],j),x[(j+1):(n-j)],rep(x[n-j],j)))/sqrtn
}
return(win)
}
trimean <- function(x) {
x <-sort(x[!is.na(x)])
n<-length(x)
denom <- 3
nodenom <- n/denom
if (nodenom>40) denom <- n/40
sqrtn = sqrt(n)
roundnodenom = floor(nodenom)
tri <- array(NA,dim=c(roundnodenom,2))
for (j in 1:roundnodenom) {
tri[j,1] <- mean(x,trim=j/n)
tri[j,2] <- sd(x[(j+1):(n-j)]) / sqrt(n-j*2)
}
return(tri)
}
midrange <- function(x) {
return((max(x)+min(x))/2)
}
q1 <- function(data,n,p,i,f) {
np <- n*p;
i <<- floor(np)
f <<- np - i
qvalue <- (1-f)*data[i] + f*data[i+1]
}
q2 <- function(data,n,p,i,f) {
np <- (n+1)*p
i <<- floor(np)
f <<- np - i
qvalue <- (1-f)*data[i] + f*data[i+1]
}
q3 <- function(data,n,p,i,f) {
np <- n*p
i <<- floor(np)
f <<- np - i
if (f==0) {
qvalue <- data[i]
} else {
qvalue <- data[i+1]
}
}
q4 <- function(data,n,p,i,f) {
np <- n*p
i <<- floor(np)
f <<- np - i
if (f==0) {
qvalue <- (data[i]+data[i+1])/2
} else {
qvalue <- data[i+1]
}
}
q5 <- function(data,n,p,i,f) {
np <- (n-1)*p
i <<- floor(np)
f <<- np - i
if (f==0) {
qvalue <- data[i+1]
} else {
qvalue <- data[i+1] + f*(data[i+2]-data[i+1])
}
}
q6 <- function(data,n,p,i,f) {
np <- n*p+0.5
i <<- floor(np)
f <<- np - i
qvalue <- data[i]
}
q7 <- function(data,n,p,i,f) {
np <- (n+1)*p
i <<- floor(np)
f <<- np - i
if (f==0) {
qvalue <- data[i]
} else {
qvalue <- f*data[i] + (1-f)*data[i+1]
}
}
q8 <- function(data,n,p,i,f) {
np <- (n+1)*p
i <<- floor(np)
f <<- np - i
if (f==0) {
qvalue <- data[i]
} else {
if (f == 0.5) {
qvalue <- (data[i]+data[i+1])/2
} else {
if (f < 0.5) {
qvalue <- data[i]
} else {
qvalue <- data[i+1]
}
}
}
}
midmean <- function(x,def) {
x <-sort(x[!is.na(x)])
n<-length(x)
if (def==1) {
qvalue1 <- q1(x,n,0.25,i,f)
qvalue3 <- q1(x,n,0.75,i,f)
}
if (def==2) {
qvalue1 <- q2(x,n,0.25,i,f)
qvalue3 <- q2(x,n,0.75,i,f)
}
if (def==3) {
qvalue1 <- q3(x,n,0.25,i,f)
qvalue3 <- q3(x,n,0.75,i,f)
}
if (def==4) {
qvalue1 <- q4(x,n,0.25,i,f)
qvalue3 <- q4(x,n,0.75,i,f)
}
if (def==5) {
qvalue1 <- q5(x,n,0.25,i,f)
qvalue3 <- q5(x,n,0.75,i,f)
}
if (def==6) {
qvalue1 <- q6(x,n,0.25,i,f)
qvalue3 <- q6(x,n,0.75,i,f)
}
if (def==7) {
qvalue1 <- q7(x,n,0.25,i,f)
qvalue3 <- q7(x,n,0.75,i,f)
}
if (def==8) {
qvalue1 <- q8(x,n,0.25,i,f)
qvalue3 <- q8(x,n,0.75,i,f)
}
midm <- 0
myn <- 0
roundno4 <- round(n/4)
round3no4 <- round(3*n/4)
for (i in 1:n) {
if ((x[i]>=qvalue1) & (x[i]<=qvalue3)){
midm = midm + x[i]
myn = myn + 1
}
}
midm = midm / myn
return(midm)
}
(arm <- mean(x))
sqrtn <- sqrt(length(x))
(armse <- sd(x) / sqrtn)
(armose <- arm / armse)
(geo <- geomean(x))
(har <- harmean(x))
(qua <- quamean(x))
(win <- winmean(x))
(tri <- trimean(x))
(midr <- midrange(x))
midm <- array(NA,dim=8)
for (j in 1:8) midm[j] <- midmean(x,j)
midm
bitmap(file='test1.png')
lb <- win[,1] - 2*win[,2]
ub <- win[,1] + 2*win[,2]
if ((ylimmin == '') | (ylimmax == '')) plot(win[,1],type='b',main=main, xlab='j', pch=19, ylab='Winsorized Mean(j/n)', ylim=c(min(lb),max(ub))) else plot(win[,1],type='l',main=main, xlab='j', pch=19, ylab='Winsorized Mean(j/n)', ylim=c(ylimmin,ylimmax))
lines(ub,lty=3)
lines(lb,lty=3)
grid()
dev.off()
bitmap(file='test2.png')
lb <- tri[,1] - 2*tri[,2]
ub <- tri[,1] + 2*tri[,2]
if ((ylimmin == '') | (ylimmax == '')) plot(tri[,1],type='b',main=main, xlab='j', pch=19, ylab='Trimmed Mean(j/n)', ylim=c(min(lb),max(ub))) else plot(tri[,1],type='l',main=main, xlab='j', pch=19, ylab='Trimmed Mean(j/n)', ylim=c(ylimmin,ylimmax))
lines(ub,lty=3)
lines(lb,lty=3)
grid()
dev.off()
load(file='createtable')
a<-table.start()
a<-table.row.start(a)
a<-table.element(a,'Central Tendency - Ungrouped Data',4,TRUE)
a<-table.row.end(a)
a<-table.row.start(a)
a<-table.element(a,'Measure',header=TRUE)
a<-table.element(a,'Value',header=TRUE)
a<-table.element(a,'S.E.',header=TRUE)
a<-table.element(a,'Value/S.E.',header=TRUE)
a<-table.row.end(a)
a<-table.row.start(a)
a<-table.element(a,hyperlink('arithmetic_mean.htm', 'Arithmetic Mean', 'click to view the definition of the Arithmetic Mean'),header=TRUE)
a<-table.element(a,arm)
a<-table.element(a,hyperlink('arithmetic_mean_standard_error.htm', armse, 'click to view the definition of the Standard Error of the Arithmetic Mean'))
a<-table.element(a,armose)
a<-table.row.end(a)
a<-table.row.start(a)
a<-table.element(a,hyperlink('geometric_mean.htm', 'Geometric Mean', 'click to view the definition of the Geometric Mean'),header=TRUE)
a<-table.element(a,geo)
a<-table.element(a,'')
a<-table.row.end(a)
a<-table.row.start(a)
a<-table.element(a,hyperlink('harmonic_mean.htm', 'Harmonic Mean', 'click to view the definition of the Harmonic Mean'),header=TRUE)
a<-table.element(a,har)
a<-table.element(a,'')
a<-table.row.end(a)
a<-table.row.start(a)
a<-table.element(a,hyperlink('quadratic_mean.htm', 'Quadratic Mean', 'click to view the definition of the Quadratic Mean'),header=TRUE)
a<-table.element(a,qua)
a<-table.element(a,'')
a<-table.row.end(a)
for (j in 1:length(win[,1])) {
a<-table.row.start(a)
mylabel <- paste('Winsorized Mean (',j)
mylabel <- paste(mylabel,'/')
mylabel <- paste(mylabel,length(win[,1]))
mylabel <- paste(mylabel,')')
a<-table.element(a,hyperlink('winsorized_mean.htm', mylabel, 'click to view the definition of the Winsorized Mean'),header=TRUE)
a<-table.element(a,win[j,1])
a<-table.element(a,win[j,2])
a<-table.element(a,win[j,1]/win[j,2])
a<-table.row.end(a)
}
for (j in 1:length(tri[,1])) {
a<-table.row.start(a)
mylabel <- paste('Trimmed Mean (',j)
mylabel <- paste(mylabel,'/')
mylabel <- paste(mylabel,length(tri[,1]))
mylabel <- paste(mylabel,')')
a<-table.element(a,hyperlink('arithmetic_mean.htm', mylabel, 'click to view the definition of the Trimmed Mean'),header=TRUE)
a<-table.element(a,tri[j,1])
a<-table.element(a,tri[j,2])
a<-table.element(a,tri[j,1]/tri[j,2])
a<-table.row.end(a)
}
a<-table.row.start(a)
a<-table.element(a,hyperlink('median_1.htm', 'Median', 'click to view the definition of the Median'),header=TRUE)
a<-table.element(a,median(x))
a<-table.element(a,'')
a<-table.row.end(a)
a<-table.row.start(a)
a<-table.element(a,hyperlink('midrange.htm', 'Midrange', 'click to view the definition of the Midrange'),header=TRUE)
a<-table.element(a,midr)
a<-table.element(a,'')
a<-table.row.end(a)
a<-table.row.start(a)
mymid <- hyperlink('midmean.htm', 'Midmean', 'click to view the definition of the Midmean')
mylabel <- paste(mymid,hyperlink('method_1.htm','Weighted Average at Xnp',''),sep=' - ')
a<-table.element(a,mylabel,header=TRUE)
a<-table.element(a,midm[1])
a<-table.element(a,'')
a<-table.row.end(a)
a<-table.row.start(a)
mymid <- hyperlink('midmean.htm', 'Midmean', 'click to view the definition of the Midmean')
mylabel <- paste(mymid,hyperlink('method_2.htm','Weighted Average at X(n+1)p',''),sep=' - ')
a<-table.element(a,mylabel,header=TRUE)
a<-table.element(a,midm[2])
a<-table.element(a,'')
a<-table.row.end(a)
a<-table.row.start(a)
mymid <- hyperlink('midmean.htm', 'Midmean', 'click to view the definition of the Midmean')
mylabel <- paste(mymid,hyperlink('method_3.htm','Empirical Distribution Function',''),sep=' - ')
a<-table.element(a,mylabel,header=TRUE)
a<-table.element(a,midm[3])
a<-table.element(a,'')
a<-table.row.end(a)
a<-table.row.start(a)
mymid <- hyperlink('midmean.htm', 'Midmean', 'click to view the definition of the Midmean')
mylabel <- paste(mymid,hyperlink('method_4.htm','Empirical Distribution Function - Averaging',''),sep=' - ')
a<-table.element(a,mylabel,header=TRUE)
a<-table.element(a,midm[4])
a<-table.element(a,'')
a<-table.row.end(a)
a<-table.row.start(a)
mymid <- hyperlink('midmean.htm', 'Midmean', 'click to view the definition of the Midmean')
mylabel <- paste(mymid,hyperlink('method_5.htm','Empirical Distribution Function - Interpolation',''),sep=' - ')
a<-table.element(a,mylabel,header=TRUE)
a<-table.element(a,midm[5])
a<-table.element(a,'')
a<-table.row.end(a)
a<-table.row.start(a)
mymid <- hyperlink('midmean.htm', 'Midmean', 'click to view the definition of the Midmean')
mylabel <- paste(mymid,hyperlink('method_6.htm','Closest Observation',''),sep=' - ')
a<-table.element(a,mylabel,header=TRUE)
a<-table.element(a,midm[6])
a<-table.element(a,'')
a<-table.row.end(a)
a<-table.row.start(a)
mymid <- hyperlink('midmean.htm', 'Midmean', 'click to view the definition of the Midmean')
mylabel <- paste(mymid,hyperlink('method_7.htm','True Basic - Statistics Graphics Toolkit',''),sep=' - ')
a<-table.element(a,mylabel,header=TRUE)
a<-table.element(a,midm[7])
a<-table.element(a,'')
a<-table.row.end(a)
a<-table.row.start(a)
mymid <- hyperlink('midmean.htm', 'Midmean', 'click to view the definition of the Midmean')
mylabel <- paste(mymid,hyperlink('method_8.htm','MS Excel (old versions)',''),sep=' - ')
a<-table.element(a,mylabel,header=TRUE)
a<-table.element(a,midm[8])
a<-table.element(a,'')
a<-table.row.end(a)
a<-table.row.start(a)
a<-table.element(a,'Number of observations',header=TRUE)
a<-table.element(a,length(x))
a<-table.element(a,'')
a<-table.row.end(a)
a<-table.end(a)
table.save(a,file='mytable.tab')