Free Statistics

of Irreproducible Research!

Author's title

Author*The author of this computation has been verified*
R Software Modulerwasp_multipleregression.wasp
Title produced by softwareMultiple Regression
Date of computationWed, 18 Nov 2009 14:21:33 -0700
Cite this page as followsStatistical Computations at FreeStatistics.org, Office for Research Development and Education, URL https://freestatistics.org/blog/index.php?v=date/2009/Nov/18/t1258579365q3qb6ctd3r81msz.htm/, Retrieved Fri, 17 May 2024 20:56:39 +0000
Statistical Computations at FreeStatistics.org, Office for Research Development and Education, URL https://freestatistics.org/blog/index.php?pk=57625, Retrieved Fri, 17 May 2024 20:56:39 +0000
QR Codes:

Original text written by user:
IsPrivate?No (this computation is public)
User-defined keywordsW7
Estimated Impact220
Family? (F = Feedback message, R = changed R code, M = changed R Module, P = changed Parameters, D = changed Data)
-     [Multiple Regression] [Q1 The Seatbeltlaw] [2007-11-14 19:27:43] [8cd6641b921d30ebe00b648d1481bba0]
- RMPD  [Multiple Regression] [Seatbelt] [2009-11-12 13:54:52] [b98453cac15ba1066b407e146608df68]
-   PD      [Multiple Regression] [w7] [2009-11-18 21:21:33] [950726a732ba3ca782ecb1a5307d0f6f] [Current]
Feedback Forum

Post a new message
Dataseries X:
13132.1	12002.4
17665.9	15525.5
16913	14247.9
17318.8	15000.7
16224.2	14931.4
15469.6	13333.7
16557.5	14711.2
19414.8	17197.3
17335	14985.2
16525.2	14734.4
18160.4	15937.8
15553.8	13028.1
15262.2	13836.8
18581	16677.5
17564.1	15130
18948.6	17504
17187.8	16979.9
17564.8	16012.5
17668.4	16247.7
20811.7	19268.2
17257.8	15533
18984.2	16803.3
20532.6	17396.1
17082.3	15155.4
16894.9	15692.4
20274.9	18063.7
20078.6	17568.6
19900.9	18154.3
17012.2	15467.4
19642.9	16956.1
19024	16854
21691	19396.4
18835.9	16457.6
19873.4	17284.5
21468.2	18395.3
19406.8	16938.7
18385.3	16414.3
20739.3	18173.4
22268.3	19919.7
21569	19623.8
17514.8	17228.1
21124.7	18730.3
21251	19039.1
21393	19413.3
22145.2	20013.6
20310.5	17917.2
23466.9	21270.3
21264.6	18766.1
18388.1	16790.8
22635.4	19960.6
22014.3	19586.7
18422.7	17179
16120.2	14964.9
16037.7	13918.5
16410.7	14401.3
17749.8	15994.6
16349.8	14521.1
15662.3	13746.5
17782.3	15956
16398.9	14332.2


Summary of computational transaction
Raw Inputview raw input (R code)
Raw Outputview raw output of R engine
Computing time3 seconds
R Server'Gwilym Jenkins' @ 72.249.127.135

\begin{tabular}{lllllllll}
\hline
Summary of computational transaction \tabularnewline
Raw Input & view raw input (R code)  \tabularnewline
Raw Output & view raw output of R engine  \tabularnewline
Computing time & 3 seconds \tabularnewline
R Server & 'Gwilym Jenkins' @ 72.249.127.135 \tabularnewline
\hline
\end{tabular}
%Source: https://freestatistics.org/blog/index.php?pk=57625&T=0

[TABLE]
[ROW][C]Summary of computational transaction[/C][/ROW]
[ROW][C]Raw Input[/C][C]view raw input (R code) [/C][/ROW]
[ROW][C]Raw Output[/C][C]view raw output of R engine [/C][/ROW]
[ROW][C]Computing time[/C][C]3 seconds[/C][/ROW]
[ROW][C]R Server[/C][C]'Gwilym Jenkins' @ 72.249.127.135[/C][/ROW]
[/TABLE]
Source: https://freestatistics.org/blog/index.php?pk=57625&T=0

Globally Unique Identifier (entire table): ba.freestatistics.org/blog/index.php?pk=57625&T=0

As an alternative you can also use a QR Code:  

The GUIDs for individual cells are displayed in the table below:

Summary of computational transaction
Raw Inputview raw input (R code)
Raw Outputview raw output of R engine
Computing time3 seconds
R Server'Gwilym Jenkins' @ 72.249.127.135


Multiple Linear Regression - Estimated Regression Equation
Uitvoer[t] = + 1759.89583601506 + 1.03809312850065Invoer[t] -823.37862132792M1[t] -91.8703965724779M2[t] + 102.518288888236M3[t] -640.979016258622M4[t] -1421.37817130003M5[t] -134.800925868524M6[t] -396.771399633361M7[t] -445.014237636709M8[t] -244.492657519431M9[t] -143.757487305076M10[t] + 110.384926787108M11[t] -1.62912632200185t + e[t]

\begin{tabular}{lllllllll}
\hline
Multiple Linear Regression - Estimated Regression Equation \tabularnewline
Uitvoer[t] =  +  1759.89583601506 +  1.03809312850065Invoer[t] -823.37862132792M1[t] -91.8703965724779M2[t] +  102.518288888236M3[t] -640.979016258622M4[t] -1421.37817130003M5[t] -134.800925868524M6[t] -396.771399633361M7[t] -445.014237636709M8[t] -244.492657519431M9[t] -143.757487305076M10[t] +  110.384926787108M11[t] -1.62912632200185t  + e[t] \tabularnewline
\hline
\end{tabular}
%Source: https://freestatistics.org/blog/index.php?pk=57625&T=1

[TABLE]
[ROW][C]Multiple Linear Regression - Estimated Regression Equation[/C][/ROW]
[ROW][C]Uitvoer[t] =  +  1759.89583601506 +  1.03809312850065Invoer[t] -823.37862132792M1[t] -91.8703965724779M2[t] +  102.518288888236M3[t] -640.979016258622M4[t] -1421.37817130003M5[t] -134.800925868524M6[t] -396.771399633361M7[t] -445.014237636709M8[t] -244.492657519431M9[t] -143.757487305076M10[t] +  110.384926787108M11[t] -1.62912632200185t  + e[t][/C][/ROW]
[/TABLE]
Source: https://freestatistics.org/blog/index.php?pk=57625&T=1

Globally Unique Identifier (entire table): ba.freestatistics.org/blog/index.php?pk=57625&T=1

As an alternative you can also use a QR Code:  

The GUIDs for individual cells are displayed in the table below:

Multiple Linear Regression - Estimated Regression Equation
Uitvoer[t] = + 1759.89583601506 + 1.03809312850065Invoer[t] -823.37862132792M1[t] -91.8703965724779M2[t] + 102.518288888236M3[t] -640.979016258622M4[t] -1421.37817130003M5[t] -134.800925868524M6[t] -396.771399633361M7[t] -445.014237636709M8[t] -244.492657519431M9[t] -143.757487305076M10[t] + 110.384926787108M11[t] -1.62912632200185t + e[t]


Multiple Linear Regression - Ordinary Least Squares
VariableParameterS.D.T-STATH0: parameter = 02-tail p-value1-tail p-value
(Intercept)1759.89583601506484.3607783.63340.0007020.000351
Invoer1.038093128500650.03118733.285700
M1-823.37862132792246.381189-3.34190.001660.00083
M2-91.8703965724779257.623344-0.35660.7230160.361508
M3102.518288888236253.6086160.40420.6879110.343955
M4-640.979016258622254.60532-2.51750.0153640.007682
M5-1421.37817130003245.656024-5.78611e-060
M6-134.800925868524245.106779-0.550.5850020.292501
M7-396.771399633361245.924652-1.61340.1135010.05675
M8-445.014237636709259.358745-1.71580.0929230.046462
M9-244.492657519431245.536367-0.99570.3245810.162291
M10-143.757487305076244.798122-0.58720.5599080.279954
M11110.384926787108253.5384250.43540.6653250.332662
t-1.629126322001853.223713-0.50540.6157210.307861

\begin{tabular}{lllllllll}
\hline
Multiple Linear Regression - Ordinary Least Squares \tabularnewline
Variable & Parameter & S.D. & T-STATH0: parameter = 0 & 2-tail p-value & 1-tail p-value \tabularnewline
(Intercept) & 1759.89583601506 & 484.360778 & 3.6334 & 0.000702 & 0.000351 \tabularnewline
Invoer & 1.03809312850065 & 0.031187 & 33.2857 & 0 & 0 \tabularnewline
M1 & -823.37862132792 & 246.381189 & -3.3419 & 0.00166 & 0.00083 \tabularnewline
M2 & -91.8703965724779 & 257.623344 & -0.3566 & 0.723016 & 0.361508 \tabularnewline
M3 & 102.518288888236 & 253.608616 & 0.4042 & 0.687911 & 0.343955 \tabularnewline
M4 & -640.979016258622 & 254.60532 & -2.5175 & 0.015364 & 0.007682 \tabularnewline
M5 & -1421.37817130003 & 245.656024 & -5.7861 & 1e-06 & 0 \tabularnewline
M6 & -134.800925868524 & 245.106779 & -0.55 & 0.585002 & 0.292501 \tabularnewline
M7 & -396.771399633361 & 245.924652 & -1.6134 & 0.113501 & 0.05675 \tabularnewline
M8 & -445.014237636709 & 259.358745 & -1.7158 & 0.092923 & 0.046462 \tabularnewline
M9 & -244.492657519431 & 245.536367 & -0.9957 & 0.324581 & 0.162291 \tabularnewline
M10 & -143.757487305076 & 244.798122 & -0.5872 & 0.559908 & 0.279954 \tabularnewline
M11 & 110.384926787108 & 253.538425 & 0.4354 & 0.665325 & 0.332662 \tabularnewline
t & -1.62912632200185 & 3.223713 & -0.5054 & 0.615721 & 0.307861 \tabularnewline
\hline
\end{tabular}
%Source: https://freestatistics.org/blog/index.php?pk=57625&T=2

[TABLE]
[ROW][C]Multiple Linear Regression - Ordinary Least Squares[/C][/ROW]
[ROW][C]Variable[/C][C]Parameter[/C][C]S.D.[/C][C]T-STATH0: parameter = 0[/C][C]2-tail p-value[/C][C]1-tail p-value[/C][/ROW]
[ROW][C](Intercept)[/C][C]1759.89583601506[/C][C]484.360778[/C][C]3.6334[/C][C]0.000702[/C][C]0.000351[/C][/ROW]
[ROW][C]Invoer[/C][C]1.03809312850065[/C][C]0.031187[/C][C]33.2857[/C][C]0[/C][C]0[/C][/ROW]
[ROW][C]M1[/C][C]-823.37862132792[/C][C]246.381189[/C][C]-3.3419[/C][C]0.00166[/C][C]0.00083[/C][/ROW]
[ROW][C]M2[/C][C]-91.8703965724779[/C][C]257.623344[/C][C]-0.3566[/C][C]0.723016[/C][C]0.361508[/C][/ROW]
[ROW][C]M3[/C][C]102.518288888236[/C][C]253.608616[/C][C]0.4042[/C][C]0.687911[/C][C]0.343955[/C][/ROW]
[ROW][C]M4[/C][C]-640.979016258622[/C][C]254.60532[/C][C]-2.5175[/C][C]0.015364[/C][C]0.007682[/C][/ROW]
[ROW][C]M5[/C][C]-1421.37817130003[/C][C]245.656024[/C][C]-5.7861[/C][C]1e-06[/C][C]0[/C][/ROW]
[ROW][C]M6[/C][C]-134.800925868524[/C][C]245.106779[/C][C]-0.55[/C][C]0.585002[/C][C]0.292501[/C][/ROW]
[ROW][C]M7[/C][C]-396.771399633361[/C][C]245.924652[/C][C]-1.6134[/C][C]0.113501[/C][C]0.05675[/C][/ROW]
[ROW][C]M8[/C][C]-445.014237636709[/C][C]259.358745[/C][C]-1.7158[/C][C]0.092923[/C][C]0.046462[/C][/ROW]
[ROW][C]M9[/C][C]-244.492657519431[/C][C]245.536367[/C][C]-0.9957[/C][C]0.324581[/C][C]0.162291[/C][/ROW]
[ROW][C]M10[/C][C]-143.757487305076[/C][C]244.798122[/C][C]-0.5872[/C][C]0.559908[/C][C]0.279954[/C][/ROW]
[ROW][C]M11[/C][C]110.384926787108[/C][C]253.538425[/C][C]0.4354[/C][C]0.665325[/C][C]0.332662[/C][/ROW]
[ROW][C]t[/C][C]-1.62912632200185[/C][C]3.223713[/C][C]-0.5054[/C][C]0.615721[/C][C]0.307861[/C][/ROW]
[/TABLE]
Source: https://freestatistics.org/blog/index.php?pk=57625&T=2

Globally Unique Identifier (entire table): ba.freestatistics.org/blog/index.php?pk=57625&T=2

As an alternative you can also use a QR Code:  

The GUIDs for individual cells are displayed in the table below:

Multiple Linear Regression - Ordinary Least Squares
VariableParameterS.D.T-STATH0: parameter = 02-tail p-value1-tail p-value
(Intercept)1759.89583601506484.3607783.63340.0007020.000351
Invoer1.038093128500650.03118733.285700
M1-823.37862132792246.381189-3.34190.001660.00083
M2-91.8703965724779257.623344-0.35660.7230160.361508
M3102.518288888236253.6086160.40420.6879110.343955
M4-640.979016258622254.60532-2.51750.0153640.007682
M5-1421.37817130003245.656024-5.78611e-060
M6-134.800925868524245.106779-0.550.5850020.292501
M7-396.771399633361245.924652-1.61340.1135010.05675
M8-445.014237636709259.358745-1.71580.0929230.046462
M9-244.492657519431245.536367-0.99570.3245810.162291
M10-143.757487305076244.798122-0.58720.5599080.279954
M11110.384926787108253.5384250.43540.6653250.332662
t-1.629126322001853.223713-0.50540.6157210.307861


Multiple Linear Regression - Regression Statistics
Multiple R0.98829446174447
R-squared0.976725943114793
Adjusted R-squared0.97014849225593
F-TEST (value)148.496121684996
F-TEST (DF numerator)13
F-TEST (DF denominator)46
p-value0
Multiple Linear Regression - Residual Statistics
Residual Standard Deviation386.036671611911
Sum Squared Residuals6855118.34414332

\begin{tabular}{lllllllll}
\hline
Multiple Linear Regression - Regression Statistics \tabularnewline
Multiple R & 0.98829446174447 \tabularnewline
R-squared & 0.976725943114793 \tabularnewline
Adjusted R-squared & 0.97014849225593 \tabularnewline
F-TEST (value) & 148.496121684996 \tabularnewline
F-TEST (DF numerator) & 13 \tabularnewline
F-TEST (DF denominator) & 46 \tabularnewline
p-value & 0 \tabularnewline
Multiple Linear Regression - Residual Statistics \tabularnewline
Residual Standard Deviation & 386.036671611911 \tabularnewline
Sum Squared Residuals & 6855118.34414332 \tabularnewline
\hline
\end{tabular}
%Source: https://freestatistics.org/blog/index.php?pk=57625&T=3

[TABLE]
[ROW][C]Multiple Linear Regression - Regression Statistics[/C][/ROW]
[ROW][C]Multiple R[/C][C]0.98829446174447[/C][/ROW]
[ROW][C]R-squared[/C][C]0.976725943114793[/C][/ROW]
[ROW][C]Adjusted R-squared[/C][C]0.97014849225593[/C][/ROW]
[ROW][C]F-TEST (value)[/C][C]148.496121684996[/C][/ROW]
[ROW][C]F-TEST (DF numerator)[/C][C]13[/C][/ROW]
[ROW][C]F-TEST (DF denominator)[/C][C]46[/C][/ROW]
[ROW][C]p-value[/C][C]0[/C][/ROW]
[ROW][C]Multiple Linear Regression - Residual Statistics[/C][/ROW]
[ROW][C]Residual Standard Deviation[/C][C]386.036671611911[/C][/ROW]
[ROW][C]Sum Squared Residuals[/C][C]6855118.34414332[/C][/ROW]
[/TABLE]
Source: https://freestatistics.org/blog/index.php?pk=57625&T=3

Globally Unique Identifier (entire table): ba.freestatistics.org/blog/index.php?pk=57625&T=3

As an alternative you can also use a QR Code:  

The GUIDs for individual cells are displayed in the table below:

Multiple Linear Regression - Regression Statistics
Multiple R0.98829446174447
R-squared0.976725943114793
Adjusted R-squared0.97014849225593
F-TEST (value)148.496121684996
F-TEST (DF numerator)13
F-TEST (DF denominator)46
p-value0
Multiple Linear Regression - Residual Statistics
Residual Standard Deviation386.036671611911
Sum Squared Residuals6855118.34414332


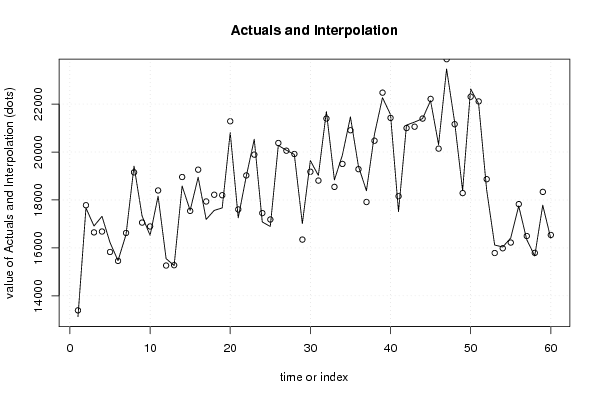
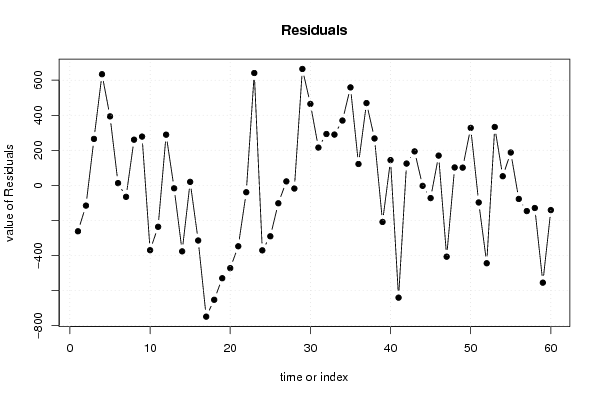
Multiple Linear Regression - Actuals, Interpolation, and Residuals
Time or IndexActualsInterpolationForecastResidualsPrediction Error
113132.113394.4970538814-262.397053881395
217665.917781.6820533354-115.782053335410
31691316648.1738315017264.826168498309
417318.816684.5239071681634.27609283188
516224.215830.5557719996393.644228000384
615469.615456.942499703612.6575002963664
716557.516623.3161841264-65.8161841264366
819414.819154.2475465665260.552453433451
91733517056.7741908055278.225809194458
1016525.216895.5264780699-370.326478069930
1118160.418397.2810366778-236.881036677792
1215553.815264.7274075703289.072592429651
1315262.215279.2255729389-17.0255729388993
141858118958.0158215041-377.015821504132
1517564.117544.326264288119.7737357119076
1618948.619263.6329198798-315.032919879771
1717187.817937.5400298692-749.740029869175
1817564.818218.2368564671-653.436856467148
1917668.418198.7967602037-530.39676020366
2020811.721284.4850905145-472.78509051452
2117257.817605.8920907342-348.092090734175
2218984.219023.6878357609-39.4878357608988
2320532.619891.5827301063641.017269893732
2417082.317453.5134039658-371.213403965755
2516894.917185.9616663207-291.061666320680
2620274.920377.4710003677-102.571000367708
2720078.620056.270651585722.3293484142507
2819900.919919.1553654797-18.2553654797174
2917012.216347.8746571479664.32534285208
3019642.919178.2320166563464.667983343667
311902418808.6431081496215.356891850418
322169121398.0191137243292.980886275718
3318835.918546.1634814818289.736518518152
3419873.419503.6687333314369.731266668611
3521468.220909.2958682401558.904131759909
3619406.819285.1953641569121.604635843060
3718385.317915.8115799213469.488420078723
3820739.320471.8003007002267.499699299790
3922268.322477.3818901396-209.081890139602
402156921425.0837019474143.916298052601
4117514.818156.095712635-641.295712634989
4221124.721000.4673293782124.232670621837
432125121057.4308873723193.569112627676
442139321396.0133717319-3.01337173191836
4522145.222218.0731305661-72.8731305661319
4620310.520140.9207398697169.579260130271
4723466.923874.2640968154-407.364096815432
4821264.621162.657231315101.942768684999
4918388.118287.1041269377100.995873062250
5022635.422307.5308240925327.869175907459
5122014.322112.1473624849-97.8473624848649
5218422.718867.604105525-444.904105524992
5316120.215787.1338283483333.066171651701
5416037.715985.821297794751.8787022052776
5516410.716223.413060148187.286939852004
5617749.817827.5348774627-77.7348774627317
5716349.816496.7971064123-146.997106412303
5815662.315791.7962129681-129.496212968053
5917782.318337.9762681604-555.676268160418
6016398.916540.3065929920-141.406592991954

\begin{tabular}{lllllllll}
\hline
Multiple Linear Regression - Actuals, Interpolation, and Residuals \tabularnewline
Time or Index & Actuals & InterpolationForecast & ResidualsPrediction Error \tabularnewline
1 & 13132.1 & 13394.4970538814 & -262.397053881395 \tabularnewline
2 & 17665.9 & 17781.6820533354 & -115.782053335410 \tabularnewline
3 & 16913 & 16648.1738315017 & 264.826168498309 \tabularnewline
4 & 17318.8 & 16684.5239071681 & 634.27609283188 \tabularnewline
5 & 16224.2 & 15830.5557719996 & 393.644228000384 \tabularnewline
6 & 15469.6 & 15456.9424997036 & 12.6575002963664 \tabularnewline
7 & 16557.5 & 16623.3161841264 & -65.8161841264366 \tabularnewline
8 & 19414.8 & 19154.2475465665 & 260.552453433451 \tabularnewline
9 & 17335 & 17056.7741908055 & 278.225809194458 \tabularnewline
10 & 16525.2 & 16895.5264780699 & -370.326478069930 \tabularnewline
11 & 18160.4 & 18397.2810366778 & -236.881036677792 \tabularnewline
12 & 15553.8 & 15264.7274075703 & 289.072592429651 \tabularnewline
13 & 15262.2 & 15279.2255729389 & -17.0255729388993 \tabularnewline
14 & 18581 & 18958.0158215041 & -377.015821504132 \tabularnewline
15 & 17564.1 & 17544.3262642881 & 19.7737357119076 \tabularnewline
16 & 18948.6 & 19263.6329198798 & -315.032919879771 \tabularnewline
17 & 17187.8 & 17937.5400298692 & -749.740029869175 \tabularnewline
18 & 17564.8 & 18218.2368564671 & -653.436856467148 \tabularnewline
19 & 17668.4 & 18198.7967602037 & -530.39676020366 \tabularnewline
20 & 20811.7 & 21284.4850905145 & -472.78509051452 \tabularnewline
21 & 17257.8 & 17605.8920907342 & -348.092090734175 \tabularnewline
22 & 18984.2 & 19023.6878357609 & -39.4878357608988 \tabularnewline
23 & 20532.6 & 19891.5827301063 & 641.017269893732 \tabularnewline
24 & 17082.3 & 17453.5134039658 & -371.213403965755 \tabularnewline
25 & 16894.9 & 17185.9616663207 & -291.061666320680 \tabularnewline
26 & 20274.9 & 20377.4710003677 & -102.571000367708 \tabularnewline
27 & 20078.6 & 20056.2706515857 & 22.3293484142507 \tabularnewline
28 & 19900.9 & 19919.1553654797 & -18.2553654797174 \tabularnewline
29 & 17012.2 & 16347.8746571479 & 664.32534285208 \tabularnewline
30 & 19642.9 & 19178.2320166563 & 464.667983343667 \tabularnewline
31 & 19024 & 18808.6431081496 & 215.356891850418 \tabularnewline
32 & 21691 & 21398.0191137243 & 292.980886275718 \tabularnewline
33 & 18835.9 & 18546.1634814818 & 289.736518518152 \tabularnewline
34 & 19873.4 & 19503.6687333314 & 369.731266668611 \tabularnewline
35 & 21468.2 & 20909.2958682401 & 558.904131759909 \tabularnewline
36 & 19406.8 & 19285.1953641569 & 121.604635843060 \tabularnewline
37 & 18385.3 & 17915.8115799213 & 469.488420078723 \tabularnewline
38 & 20739.3 & 20471.8003007002 & 267.499699299790 \tabularnewline
39 & 22268.3 & 22477.3818901396 & -209.081890139602 \tabularnewline
40 & 21569 & 21425.0837019474 & 143.916298052601 \tabularnewline
41 & 17514.8 & 18156.095712635 & -641.295712634989 \tabularnewline
42 & 21124.7 & 21000.4673293782 & 124.232670621837 \tabularnewline
43 & 21251 & 21057.4308873723 & 193.569112627676 \tabularnewline
44 & 21393 & 21396.0133717319 & -3.01337173191836 \tabularnewline
45 & 22145.2 & 22218.0731305661 & -72.8731305661319 \tabularnewline
46 & 20310.5 & 20140.9207398697 & 169.579260130271 \tabularnewline
47 & 23466.9 & 23874.2640968154 & -407.364096815432 \tabularnewline
48 & 21264.6 & 21162.657231315 & 101.942768684999 \tabularnewline
49 & 18388.1 & 18287.1041269377 & 100.995873062250 \tabularnewline
50 & 22635.4 & 22307.5308240925 & 327.869175907459 \tabularnewline
51 & 22014.3 & 22112.1473624849 & -97.8473624848649 \tabularnewline
52 & 18422.7 & 18867.604105525 & -444.904105524992 \tabularnewline
53 & 16120.2 & 15787.1338283483 & 333.066171651701 \tabularnewline
54 & 16037.7 & 15985.8212977947 & 51.8787022052776 \tabularnewline
55 & 16410.7 & 16223.413060148 & 187.286939852004 \tabularnewline
56 & 17749.8 & 17827.5348774627 & -77.7348774627317 \tabularnewline
57 & 16349.8 & 16496.7971064123 & -146.997106412303 \tabularnewline
58 & 15662.3 & 15791.7962129681 & -129.496212968053 \tabularnewline
59 & 17782.3 & 18337.9762681604 & -555.676268160418 \tabularnewline
60 & 16398.9 & 16540.3065929920 & -141.406592991954 \tabularnewline
\hline
\end{tabular}
%Source: https://freestatistics.org/blog/index.php?pk=57625&T=4

[TABLE]
[ROW][C]Multiple Linear Regression - Actuals, Interpolation, and Residuals[/C][/ROW]
[ROW][C]Time or Index[/C][C]Actuals[/C][C]InterpolationForecast[/C][C]ResidualsPrediction Error[/C][/ROW]
[ROW][C]1[/C][C]13132.1[/C][C]13394.4970538814[/C][C]-262.397053881395[/C][/ROW]
[ROW][C]2[/C][C]17665.9[/C][C]17781.6820533354[/C][C]-115.782053335410[/C][/ROW]
[ROW][C]3[/C][C]16913[/C][C]16648.1738315017[/C][C]264.826168498309[/C][/ROW]
[ROW][C]4[/C][C]17318.8[/C][C]16684.5239071681[/C][C]634.27609283188[/C][/ROW]
[ROW][C]5[/C][C]16224.2[/C][C]15830.5557719996[/C][C]393.644228000384[/C][/ROW]
[ROW][C]6[/C][C]15469.6[/C][C]15456.9424997036[/C][C]12.6575002963664[/C][/ROW]
[ROW][C]7[/C][C]16557.5[/C][C]16623.3161841264[/C][C]-65.8161841264366[/C][/ROW]
[ROW][C]8[/C][C]19414.8[/C][C]19154.2475465665[/C][C]260.552453433451[/C][/ROW]
[ROW][C]9[/C][C]17335[/C][C]17056.7741908055[/C][C]278.225809194458[/C][/ROW]
[ROW][C]10[/C][C]16525.2[/C][C]16895.5264780699[/C][C]-370.326478069930[/C][/ROW]
[ROW][C]11[/C][C]18160.4[/C][C]18397.2810366778[/C][C]-236.881036677792[/C][/ROW]
[ROW][C]12[/C][C]15553.8[/C][C]15264.7274075703[/C][C]289.072592429651[/C][/ROW]
[ROW][C]13[/C][C]15262.2[/C][C]15279.2255729389[/C][C]-17.0255729388993[/C][/ROW]
[ROW][C]14[/C][C]18581[/C][C]18958.0158215041[/C][C]-377.015821504132[/C][/ROW]
[ROW][C]15[/C][C]17564.1[/C][C]17544.3262642881[/C][C]19.7737357119076[/C][/ROW]
[ROW][C]16[/C][C]18948.6[/C][C]19263.6329198798[/C][C]-315.032919879771[/C][/ROW]
[ROW][C]17[/C][C]17187.8[/C][C]17937.5400298692[/C][C]-749.740029869175[/C][/ROW]
[ROW][C]18[/C][C]17564.8[/C][C]18218.2368564671[/C][C]-653.436856467148[/C][/ROW]
[ROW][C]19[/C][C]17668.4[/C][C]18198.7967602037[/C][C]-530.39676020366[/C][/ROW]
[ROW][C]20[/C][C]20811.7[/C][C]21284.4850905145[/C][C]-472.78509051452[/C][/ROW]
[ROW][C]21[/C][C]17257.8[/C][C]17605.8920907342[/C][C]-348.092090734175[/C][/ROW]
[ROW][C]22[/C][C]18984.2[/C][C]19023.6878357609[/C][C]-39.4878357608988[/C][/ROW]
[ROW][C]23[/C][C]20532.6[/C][C]19891.5827301063[/C][C]641.017269893732[/C][/ROW]
[ROW][C]24[/C][C]17082.3[/C][C]17453.5134039658[/C][C]-371.213403965755[/C][/ROW]
[ROW][C]25[/C][C]16894.9[/C][C]17185.9616663207[/C][C]-291.061666320680[/C][/ROW]
[ROW][C]26[/C][C]20274.9[/C][C]20377.4710003677[/C][C]-102.571000367708[/C][/ROW]
[ROW][C]27[/C][C]20078.6[/C][C]20056.2706515857[/C][C]22.3293484142507[/C][/ROW]
[ROW][C]28[/C][C]19900.9[/C][C]19919.1553654797[/C][C]-18.2553654797174[/C][/ROW]
[ROW][C]29[/C][C]17012.2[/C][C]16347.8746571479[/C][C]664.32534285208[/C][/ROW]
[ROW][C]30[/C][C]19642.9[/C][C]19178.2320166563[/C][C]464.667983343667[/C][/ROW]
[ROW][C]31[/C][C]19024[/C][C]18808.6431081496[/C][C]215.356891850418[/C][/ROW]
[ROW][C]32[/C][C]21691[/C][C]21398.0191137243[/C][C]292.980886275718[/C][/ROW]
[ROW][C]33[/C][C]18835.9[/C][C]18546.1634814818[/C][C]289.736518518152[/C][/ROW]
[ROW][C]34[/C][C]19873.4[/C][C]19503.6687333314[/C][C]369.731266668611[/C][/ROW]
[ROW][C]35[/C][C]21468.2[/C][C]20909.2958682401[/C][C]558.904131759909[/C][/ROW]
[ROW][C]36[/C][C]19406.8[/C][C]19285.1953641569[/C][C]121.604635843060[/C][/ROW]
[ROW][C]37[/C][C]18385.3[/C][C]17915.8115799213[/C][C]469.488420078723[/C][/ROW]
[ROW][C]38[/C][C]20739.3[/C][C]20471.8003007002[/C][C]267.499699299790[/C][/ROW]
[ROW][C]39[/C][C]22268.3[/C][C]22477.3818901396[/C][C]-209.081890139602[/C][/ROW]
[ROW][C]40[/C][C]21569[/C][C]21425.0837019474[/C][C]143.916298052601[/C][/ROW]
[ROW][C]41[/C][C]17514.8[/C][C]18156.095712635[/C][C]-641.295712634989[/C][/ROW]
[ROW][C]42[/C][C]21124.7[/C][C]21000.4673293782[/C][C]124.232670621837[/C][/ROW]
[ROW][C]43[/C][C]21251[/C][C]21057.4308873723[/C][C]193.569112627676[/C][/ROW]
[ROW][C]44[/C][C]21393[/C][C]21396.0133717319[/C][C]-3.01337173191836[/C][/ROW]
[ROW][C]45[/C][C]22145.2[/C][C]22218.0731305661[/C][C]-72.8731305661319[/C][/ROW]
[ROW][C]46[/C][C]20310.5[/C][C]20140.9207398697[/C][C]169.579260130271[/C][/ROW]
[ROW][C]47[/C][C]23466.9[/C][C]23874.2640968154[/C][C]-407.364096815432[/C][/ROW]
[ROW][C]48[/C][C]21264.6[/C][C]21162.657231315[/C][C]101.942768684999[/C][/ROW]
[ROW][C]49[/C][C]18388.1[/C][C]18287.1041269377[/C][C]100.995873062250[/C][/ROW]
[ROW][C]50[/C][C]22635.4[/C][C]22307.5308240925[/C][C]327.869175907459[/C][/ROW]
[ROW][C]51[/C][C]22014.3[/C][C]22112.1473624849[/C][C]-97.8473624848649[/C][/ROW]
[ROW][C]52[/C][C]18422.7[/C][C]18867.604105525[/C][C]-444.904105524992[/C][/ROW]
[ROW][C]53[/C][C]16120.2[/C][C]15787.1338283483[/C][C]333.066171651701[/C][/ROW]
[ROW][C]54[/C][C]16037.7[/C][C]15985.8212977947[/C][C]51.8787022052776[/C][/ROW]
[ROW][C]55[/C][C]16410.7[/C][C]16223.413060148[/C][C]187.286939852004[/C][/ROW]
[ROW][C]56[/C][C]17749.8[/C][C]17827.5348774627[/C][C]-77.7348774627317[/C][/ROW]
[ROW][C]57[/C][C]16349.8[/C][C]16496.7971064123[/C][C]-146.997106412303[/C][/ROW]
[ROW][C]58[/C][C]15662.3[/C][C]15791.7962129681[/C][C]-129.496212968053[/C][/ROW]
[ROW][C]59[/C][C]17782.3[/C][C]18337.9762681604[/C][C]-555.676268160418[/C][/ROW]
[ROW][C]60[/C][C]16398.9[/C][C]16540.3065929920[/C][C]-141.406592991954[/C][/ROW]
[/TABLE]
Source: https://freestatistics.org/blog/index.php?pk=57625&T=4

Globally Unique Identifier (entire table): ba.freestatistics.org/blog/index.php?pk=57625&T=4

As an alternative you can also use a QR Code:  

The GUIDs for individual cells are displayed in the table below:

Multiple Linear Regression - Actuals, Interpolation, and Residuals
Time or IndexActualsInterpolationForecastResidualsPrediction Error
113132.113394.4970538814-262.397053881395
217665.917781.6820533354-115.782053335410
31691316648.1738315017264.826168498309
417318.816684.5239071681634.27609283188
516224.215830.5557719996393.644228000384
615469.615456.942499703612.6575002963664
716557.516623.3161841264-65.8161841264366
819414.819154.2475465665260.552453433451
91733517056.7741908055278.225809194458
1016525.216895.5264780699-370.326478069930
1118160.418397.2810366778-236.881036677792
1215553.815264.7274075703289.072592429651
1315262.215279.2255729389-17.0255729388993
141858118958.0158215041-377.015821504132
1517564.117544.326264288119.7737357119076
1618948.619263.6329198798-315.032919879771
1717187.817937.5400298692-749.740029869175
1817564.818218.2368564671-653.436856467148
1917668.418198.7967602037-530.39676020366
2020811.721284.4850905145-472.78509051452
2117257.817605.8920907342-348.092090734175
2218984.219023.6878357609-39.4878357608988
2320532.619891.5827301063641.017269893732
2417082.317453.5134039658-371.213403965755
2516894.917185.9616663207-291.061666320680
2620274.920377.4710003677-102.571000367708
2720078.620056.270651585722.3293484142507
2819900.919919.1553654797-18.2553654797174
2917012.216347.8746571479664.32534285208
3019642.919178.2320166563464.667983343667
311902418808.6431081496215.356891850418
322169121398.0191137243292.980886275718
3318835.918546.1634814818289.736518518152
3419873.419503.6687333314369.731266668611
3521468.220909.2958682401558.904131759909
3619406.819285.1953641569121.604635843060
3718385.317915.8115799213469.488420078723
3820739.320471.8003007002267.499699299790
3922268.322477.3818901396-209.081890139602
402156921425.0837019474143.916298052601
4117514.818156.095712635-641.295712634989
4221124.721000.4673293782124.232670621837
432125121057.4308873723193.569112627676
442139321396.0133717319-3.01337173191836
4522145.222218.0731305661-72.8731305661319
4620310.520140.9207398697169.579260130271
4723466.923874.2640968154-407.364096815432
4821264.621162.657231315101.942768684999
4918388.118287.1041269377100.995873062250
5022635.422307.5308240925327.869175907459
5122014.322112.1473624849-97.8473624848649
5218422.718867.604105525-444.904105524992
5316120.215787.1338283483333.066171651701
5416037.715985.821297794751.8787022052776
5516410.716223.413060148187.286939852004
5617749.817827.5348774627-77.7348774627317
5716349.816496.7971064123-146.997106412303
5815662.315791.7962129681-129.496212968053
5917782.318337.9762681604-555.676268160418
6016398.916540.3065929920-141.406592991954


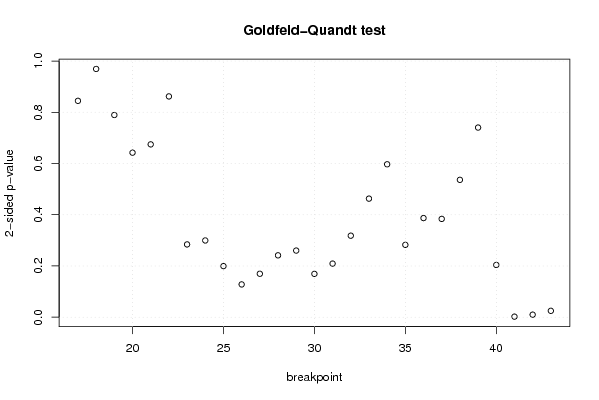
Goldfeld-Quandt test for Heteroskedasticity
p-valuesAlternative Hypothesis
breakpoint indexgreater2-sidedless
170.5776481033773160.8447037932453690.422351896622684
180.4846040862186070.9692081724372150.515395913781393
190.3947134250960260.7894268501920530.605286574903974
200.3211305819029490.6422611638058970.678869418097051
210.3373747398718090.6747494797436180.662625260128191
220.5690227442670670.8619545114658660.430977255732933
230.8579104792630680.2841790414738650.142089520736932
240.8502170063138280.2995659873723440.149782993686172
250.9003131851516120.1993736296967760.0996868148483878
260.9360207707932980.1279584584134030.0639792292067016
270.9152264643224050.1695470713551900.0847735356775951
280.8792270049896140.2415459900207730.120772995010386
290.8699439160348710.2601121679302570.130056083965129
300.9154048785742260.1691902428515470.0845951214257737
310.8954009668365760.2091980663268480.104599033163424
320.8408902823429220.3182194353141550.159109717657078
330.7685656065172410.4628687869655170.231434393482758
340.7014965068407920.5970069863184160.298503493159208
350.858747337795770.2825053244084580.141252662204229
360.8065163646061160.3869672707877680.193483635393884
370.808092689921760.3838146201564790.191907310078239
380.7318607253700660.5362785492598690.268139274629934
390.6298349217553650.740330156489270.370165078244635
400.8979784970105460.2040430059789080.102021502989454
410.9989360136303950.002127972739209600.00106398636960480
420.9950705085831370.009858982833726550.00492949141686328
430.9875329433837170.02493411323256640.0124670566162832

\begin{tabular}{lllllllll}
\hline
Goldfeld-Quandt test for Heteroskedasticity \tabularnewline
p-values & Alternative Hypothesis \tabularnewline
breakpoint index & greater & 2-sided & less \tabularnewline
17 & 0.577648103377316 & 0.844703793245369 & 0.422351896622684 \tabularnewline
18 & 0.484604086218607 & 0.969208172437215 & 0.515395913781393 \tabularnewline
19 & 0.394713425096026 & 0.789426850192053 & 0.605286574903974 \tabularnewline
20 & 0.321130581902949 & 0.642261163805897 & 0.678869418097051 \tabularnewline
21 & 0.337374739871809 & 0.674749479743618 & 0.662625260128191 \tabularnewline
22 & 0.569022744267067 & 0.861954511465866 & 0.430977255732933 \tabularnewline
23 & 0.857910479263068 & 0.284179041473865 & 0.142089520736932 \tabularnewline
24 & 0.850217006313828 & 0.299565987372344 & 0.149782993686172 \tabularnewline
25 & 0.900313185151612 & 0.199373629696776 & 0.0996868148483878 \tabularnewline
26 & 0.936020770793298 & 0.127958458413403 & 0.0639792292067016 \tabularnewline
27 & 0.915226464322405 & 0.169547071355190 & 0.0847735356775951 \tabularnewline
28 & 0.879227004989614 & 0.241545990020773 & 0.120772995010386 \tabularnewline
29 & 0.869943916034871 & 0.260112167930257 & 0.130056083965129 \tabularnewline
30 & 0.915404878574226 & 0.169190242851547 & 0.0845951214257737 \tabularnewline
31 & 0.895400966836576 & 0.209198066326848 & 0.104599033163424 \tabularnewline
32 & 0.840890282342922 & 0.318219435314155 & 0.159109717657078 \tabularnewline
33 & 0.768565606517241 & 0.462868786965517 & 0.231434393482758 \tabularnewline
34 & 0.701496506840792 & 0.597006986318416 & 0.298503493159208 \tabularnewline
35 & 0.85874733779577 & 0.282505324408458 & 0.141252662204229 \tabularnewline
36 & 0.806516364606116 & 0.386967270787768 & 0.193483635393884 \tabularnewline
37 & 0.80809268992176 & 0.383814620156479 & 0.191907310078239 \tabularnewline
38 & 0.731860725370066 & 0.536278549259869 & 0.268139274629934 \tabularnewline
39 & 0.629834921755365 & 0.74033015648927 & 0.370165078244635 \tabularnewline
40 & 0.897978497010546 & 0.204043005978908 & 0.102021502989454 \tabularnewline
41 & 0.998936013630395 & 0.00212797273920960 & 0.00106398636960480 \tabularnewline
42 & 0.995070508583137 & 0.00985898283372655 & 0.00492949141686328 \tabularnewline
43 & 0.987532943383717 & 0.0249341132325664 & 0.0124670566162832 \tabularnewline
\hline
\end{tabular}
%Source: https://freestatistics.org/blog/index.php?pk=57625&T=5

[TABLE]
[ROW][C]Goldfeld-Quandt test for Heteroskedasticity[/C][/ROW]
[ROW][C]p-values[/C][C]Alternative Hypothesis[/C][/ROW]
[ROW][C]breakpoint index[/C][C]greater[/C][C]2-sided[/C][C]less[/C][/ROW]
[ROW][C]17[/C][C]0.577648103377316[/C][C]0.844703793245369[/C][C]0.422351896622684[/C][/ROW]
[ROW][C]18[/C][C]0.484604086218607[/C][C]0.969208172437215[/C][C]0.515395913781393[/C][/ROW]
[ROW][C]19[/C][C]0.394713425096026[/C][C]0.789426850192053[/C][C]0.605286574903974[/C][/ROW]
[ROW][C]20[/C][C]0.321130581902949[/C][C]0.642261163805897[/C][C]0.678869418097051[/C][/ROW]
[ROW][C]21[/C][C]0.337374739871809[/C][C]0.674749479743618[/C][C]0.662625260128191[/C][/ROW]
[ROW][C]22[/C][C]0.569022744267067[/C][C]0.861954511465866[/C][C]0.430977255732933[/C][/ROW]
[ROW][C]23[/C][C]0.857910479263068[/C][C]0.284179041473865[/C][C]0.142089520736932[/C][/ROW]
[ROW][C]24[/C][C]0.850217006313828[/C][C]0.299565987372344[/C][C]0.149782993686172[/C][/ROW]
[ROW][C]25[/C][C]0.900313185151612[/C][C]0.199373629696776[/C][C]0.0996868148483878[/C][/ROW]
[ROW][C]26[/C][C]0.936020770793298[/C][C]0.127958458413403[/C][C]0.0639792292067016[/C][/ROW]
[ROW][C]27[/C][C]0.915226464322405[/C][C]0.169547071355190[/C][C]0.0847735356775951[/C][/ROW]
[ROW][C]28[/C][C]0.879227004989614[/C][C]0.241545990020773[/C][C]0.120772995010386[/C][/ROW]
[ROW][C]29[/C][C]0.869943916034871[/C][C]0.260112167930257[/C][C]0.130056083965129[/C][/ROW]
[ROW][C]30[/C][C]0.915404878574226[/C][C]0.169190242851547[/C][C]0.0845951214257737[/C][/ROW]
[ROW][C]31[/C][C]0.895400966836576[/C][C]0.209198066326848[/C][C]0.104599033163424[/C][/ROW]
[ROW][C]32[/C][C]0.840890282342922[/C][C]0.318219435314155[/C][C]0.159109717657078[/C][/ROW]
[ROW][C]33[/C][C]0.768565606517241[/C][C]0.462868786965517[/C][C]0.231434393482758[/C][/ROW]
[ROW][C]34[/C][C]0.701496506840792[/C][C]0.597006986318416[/C][C]0.298503493159208[/C][/ROW]
[ROW][C]35[/C][C]0.85874733779577[/C][C]0.282505324408458[/C][C]0.141252662204229[/C][/ROW]
[ROW][C]36[/C][C]0.806516364606116[/C][C]0.386967270787768[/C][C]0.193483635393884[/C][/ROW]
[ROW][C]37[/C][C]0.80809268992176[/C][C]0.383814620156479[/C][C]0.191907310078239[/C][/ROW]
[ROW][C]38[/C][C]0.731860725370066[/C][C]0.536278549259869[/C][C]0.268139274629934[/C][/ROW]
[ROW][C]39[/C][C]0.629834921755365[/C][C]0.74033015648927[/C][C]0.370165078244635[/C][/ROW]
[ROW][C]40[/C][C]0.897978497010546[/C][C]0.204043005978908[/C][C]0.102021502989454[/C][/ROW]
[ROW][C]41[/C][C]0.998936013630395[/C][C]0.00212797273920960[/C][C]0.00106398636960480[/C][/ROW]
[ROW][C]42[/C][C]0.995070508583137[/C][C]0.00985898283372655[/C][C]0.00492949141686328[/C][/ROW]
[ROW][C]43[/C][C]0.987532943383717[/C][C]0.0249341132325664[/C][C]0.0124670566162832[/C][/ROW]
[/TABLE]
Source: https://freestatistics.org/blog/index.php?pk=57625&T=5

Globally Unique Identifier (entire table): ba.freestatistics.org/blog/index.php?pk=57625&T=5

As an alternative you can also use a QR Code:  

The GUIDs for individual cells are displayed in the table below:

Goldfeld-Quandt test for Heteroskedasticity
p-valuesAlternative Hypothesis
breakpoint indexgreater2-sidedless
170.5776481033773160.8447037932453690.422351896622684
180.4846040862186070.9692081724372150.515395913781393
190.3947134250960260.7894268501920530.605286574903974
200.3211305819029490.6422611638058970.678869418097051
210.3373747398718090.6747494797436180.662625260128191
220.5690227442670670.8619545114658660.430977255732933
230.8579104792630680.2841790414738650.142089520736932
240.8502170063138280.2995659873723440.149782993686172
250.9003131851516120.1993736296967760.0996868148483878
260.9360207707932980.1279584584134030.0639792292067016
270.9152264643224050.1695470713551900.0847735356775951
280.8792270049896140.2415459900207730.120772995010386
290.8699439160348710.2601121679302570.130056083965129
300.9154048785742260.1691902428515470.0845951214257737
310.8954009668365760.2091980663268480.104599033163424
320.8408902823429220.3182194353141550.159109717657078
330.7685656065172410.4628687869655170.231434393482758
340.7014965068407920.5970069863184160.298503493159208
350.858747337795770.2825053244084580.141252662204229
360.8065163646061160.3869672707877680.193483635393884
370.808092689921760.3838146201564790.191907310078239
380.7318607253700660.5362785492598690.268139274629934
390.6298349217553650.740330156489270.370165078244635
400.8979784970105460.2040430059789080.102021502989454
410.9989360136303950.002127972739209600.00106398636960480
420.9950705085831370.009858982833726550.00492949141686328
430.9875329433837170.02493411323256640.0124670566162832


Meta Analysis of Goldfeld-Quandt test for Heteroskedasticity
Description# significant tests% significant testsOK/NOK
1% type I error level20.0740740740740741NOK
5% type I error level30.111111111111111NOK
10% type I error level30.111111111111111NOK

\begin{tabular}{lllllllll}
\hline
Meta Analysis of Goldfeld-Quandt test for Heteroskedasticity \tabularnewline
Description & # significant tests & % significant tests & OK/NOK \tabularnewline
1% type I error level & 2 & 0.0740740740740741 & NOK \tabularnewline
5% type I error level & 3 & 0.111111111111111 & NOK \tabularnewline
10% type I error level & 3 & 0.111111111111111 & NOK \tabularnewline
\hline
\end{tabular}
%Source: https://freestatistics.org/blog/index.php?pk=57625&T=6

[TABLE]
[ROW][C]Meta Analysis of Goldfeld-Quandt test for Heteroskedasticity[/C][/ROW]
[ROW][C]Description[/C][C]# significant tests[/C][C]% significant tests[/C][C]OK/NOK[/C][/ROW]
[ROW][C]1% type I error level[/C][C]2[/C][C]0.0740740740740741[/C][C]NOK[/C][/ROW]
[ROW][C]5% type I error level[/C][C]3[/C][C]0.111111111111111[/C][C]NOK[/C][/ROW]
[ROW][C]10% type I error level[/C][C]3[/C][C]0.111111111111111[/C][C]NOK[/C][/ROW]
[/TABLE]
Source: https://freestatistics.org/blog/index.php?pk=57625&T=6

Globally Unique Identifier (entire table): ba.freestatistics.org/blog/index.php?pk=57625&T=6

As an alternative you can also use a QR Code:  

The GUIDs for individual cells are displayed in the table below:

Meta Analysis of Goldfeld-Quandt test for Heteroskedasticity
Description# significant tests% significant testsOK/NOK
1% type I error level20.0740740740740741NOK
5% type I error level30.111111111111111NOK
10% type I error level30.111111111111111NOK


Parameters (Session):
par1 = 1 ; par2 = Include Monthly Dummies ; par3 = Linear Trend ;
Parameters (R input):
par1 = 1 ; par2 = Include Monthly Dummies ; par3 = Linear Trend ;
R code (references can be found in the software module):
library(lattice)
library(lmtest)
n25 <- 25 #minimum number of obs. for Goldfeld-Quandt test
par1 <- as.numeric(par1)
x <- t(y)
k <- length(x[1,])
n <- length(x[,1])
x1 <- cbind(x[,par1], x[,1:k!=par1])
mycolnames <- c(colnames(x)[par1], colnames(x)[1:k!=par1])
colnames(x1) <- mycolnames #colnames(x)[par1]
x <- x1
if (par3 == 'First Differences'){
x2 <- array(0, dim=c(n-1,k), dimnames=list(1:(n-1), paste('(1-B)',colnames(x),sep='')))
for (i in 1:n-1) {
for (j in 1:k) {
x2[i,j] <- x[i+1,j] - x[i,j]
}
}
x <- x2
}
if (par2 == 'Include Monthly Dummies'){
x2 <- array(0, dim=c(n,11), dimnames=list(1:n, paste('M', seq(1:11), sep ='')))
for (i in 1:11){
x2[seq(i,n,12),i] <- 1
}
x <- cbind(x, x2)
}
if (par2 == 'Include Quarterly Dummies'){
x2 <- array(0, dim=c(n,3), dimnames=list(1:n, paste('Q', seq(1:3), sep ='')))
for (i in 1:3){
x2[seq(i,n,4),i] <- 1
}
x <- cbind(x, x2)
}
k <- length(x[1,])
if (par3 == 'Linear Trend'){
x <- cbind(x, c(1:n))
colnames(x)[k+1] <- 't'
}
x
k <- length(x[1,])
df <- as.data.frame(x)
(mylm <- lm(df))
(mysum <- summary(mylm))
if (n > n25) {
kp3 <- k + 3
nmkm3 <- n - k - 3
gqarr <- array(NA, dim=c(nmkm3-kp3+1,3))
numgqtests <- 0
numsignificant1 <- 0
numsignificant5 <- 0
numsignificant10 <- 0
for (mypoint in kp3:nmkm3) {
j <- 0
numgqtests <- numgqtests + 1
for (myalt in c('greater', 'two.sided', 'less')) {
j <- j + 1
gqarr[mypoint-kp3+1,j] <- gqtest(mylm, point=mypoint, alternative=myalt)$p.value
}
if (gqarr[mypoint-kp3+1,2] < 0.01) numsignificant1 <- numsignificant1 + 1
if (gqarr[mypoint-kp3+1,2] < 0.05) numsignificant5 <- numsignificant5 + 1
if (gqarr[mypoint-kp3+1,2] < 0.10) numsignificant10 <- numsignificant10 + 1
}
gqarr
}
bitmap(file='test0.png')
plot(x[,1], type='l', main='Actuals and Interpolation', ylab='value of Actuals and Interpolation (dots)', xlab='time or index')
points(x[,1]-mysum$resid)
grid()
dev.off()
bitmap(file='test1.png')
plot(mysum$resid, type='b', pch=19, main='Residuals', ylab='value of Residuals', xlab='time or index')
grid()
dev.off()
bitmap(file='test2.png')
hist(mysum$resid, main='Residual Histogram', xlab='values of Residuals')
grid()
dev.off()
bitmap(file='test3.png')
densityplot(~mysum$resid,col='black',main='Residual Density Plot', xlab='values of Residuals')
dev.off()
bitmap(file='test4.png')
qqnorm(mysum$resid, main='Residual Normal Q-Q Plot')
qqline(mysum$resid)
grid()
dev.off()
(myerror <- as.ts(mysum$resid))
bitmap(file='test5.png')
dum <- cbind(lag(myerror,k=1),myerror)
dum
dum1 <- dum[2:length(myerror),]
dum1
z <- as.data.frame(dum1)
z
plot(z,main=paste('Residual Lag plot, lowess, and regression line'), ylab='values of Residuals', xlab='lagged values of Residuals')
lines(lowess(z))
abline(lm(z))
grid()
dev.off()
bitmap(file='test6.png')
acf(mysum$resid, lag.max=length(mysum$resid)/2, main='Residual Autocorrelation Function')
grid()
dev.off()
bitmap(file='test7.png')
pacf(mysum$resid, lag.max=length(mysum$resid)/2, main='Residual Partial Autocorrelation Function')
grid()
dev.off()
bitmap(file='test8.png')
opar <- par(mfrow = c(2,2), oma = c(0, 0, 1.1, 0))
plot(mylm, las = 1, sub='Residual Diagnostics')
par(opar)
dev.off()
if (n > n25) {
bitmap(file='test9.png')
plot(kp3:nmkm3,gqarr[,2], main='Goldfeld-Quandt test',ylab='2-sided p-value',xlab='breakpoint')
grid()
dev.off()
}
load(file='createtable')
a<-table.start()
a<-table.row.start(a)
a<-table.element(a, 'Multiple Linear Regression - Estimated Regression Equation', 1, TRUE)
a<-table.row.end(a)
myeq <- colnames(x)[1]
myeq <- paste(myeq, '[t] = ', sep='')
for (i in 1:k){
if (mysum$coefficients[i,1] > 0) myeq <- paste(myeq, '+', '')
myeq <- paste(myeq, mysum$coefficients[i,1], sep=' ')
if (rownames(mysum$coefficients)[i] != '(Intercept)') {
myeq <- paste(myeq, rownames(mysum$coefficients)[i], sep='')
if (rownames(mysum$coefficients)[i] != 't') myeq <- paste(myeq, '[t]', sep='')
}
}
myeq <- paste(myeq, ' + e[t]')
a<-table.row.start(a)
a<-table.element(a, myeq)
a<-table.row.end(a)
a<-table.end(a)
table.save(a,file='mytable1.tab')
a<-table.start()
a<-table.row.start(a)
a<-table.element(a,hyperlink('ols1.htm','Multiple Linear Regression - Ordinary Least Squares',''), 6, TRUE)
a<-table.row.end(a)
a<-table.row.start(a)
a<-table.element(a,'Variable',header=TRUE)
a<-table.element(a,'Parameter',header=TRUE)
a<-table.element(a,'S.D.',header=TRUE)
a<-table.element(a,'T-STAT
H0: parameter = 0',header=TRUE)
a<-table.element(a,'2-tail p-value',header=TRUE)
a<-table.element(a,'1-tail p-value',header=TRUE)
a<-table.row.end(a)
for (i in 1:k){
a<-table.row.start(a)
a<-table.element(a,rownames(mysum$coefficients)[i],header=TRUE)
a<-table.element(a,mysum$coefficients[i,1])
a<-table.element(a, round(mysum$coefficients[i,2],6))
a<-table.element(a, round(mysum$coefficients[i,3],4))
a<-table.element(a, round(mysum$coefficients[i,4],6))
a<-table.element(a, round(mysum$coefficients[i,4]/2,6))
a<-table.row.end(a)
}
a<-table.end(a)
table.save(a,file='mytable2.tab')
a<-table.start()
a<-table.row.start(a)
a<-table.element(a, 'Multiple Linear Regression - Regression Statistics', 2, TRUE)
a<-table.row.end(a)
a<-table.row.start(a)
a<-table.element(a, 'Multiple R',1,TRUE)
a<-table.element(a, sqrt(mysum$r.squared))
a<-table.row.end(a)
a<-table.row.start(a)
a<-table.element(a, 'R-squared',1,TRUE)
a<-table.element(a, mysum$r.squared)
a<-table.row.end(a)
a<-table.row.start(a)
a<-table.element(a, 'Adjusted R-squared',1,TRUE)
a<-table.element(a, mysum$adj.r.squared)
a<-table.row.end(a)
a<-table.row.start(a)
a<-table.element(a, 'F-TEST (value)',1,TRUE)
a<-table.element(a, mysum$fstatistic[1])
a<-table.row.end(a)
a<-table.row.start(a)
a<-table.element(a, 'F-TEST (DF numerator)',1,TRUE)
a<-table.element(a, mysum$fstatistic[2])
a<-table.row.end(a)
a<-table.row.start(a)
a<-table.element(a, 'F-TEST (DF denominator)',1,TRUE)
a<-table.element(a, mysum$fstatistic[3])
a<-table.row.end(a)
a<-table.row.start(a)
a<-table.element(a, 'p-value',1,TRUE)
a<-table.element(a, 1-pf(mysum$fstatistic[1],mysum$fstatistic[2],mysum$fstatistic[3]))
a<-table.row.end(a)
a<-table.row.start(a)
a<-table.element(a, 'Multiple Linear Regression - Residual Statistics', 2, TRUE)
a<-table.row.end(a)
a<-table.row.start(a)
a<-table.element(a, 'Residual Standard Deviation',1,TRUE)
a<-table.element(a, mysum$sigma)
a<-table.row.end(a)
a<-table.row.start(a)
a<-table.element(a, 'Sum Squared Residuals',1,TRUE)
a<-table.element(a, sum(myerror*myerror))
a<-table.row.end(a)
a<-table.end(a)
table.save(a,file='mytable3.tab')
a<-table.start()
a<-table.row.start(a)
a<-table.element(a, 'Multiple Linear Regression - Actuals, Interpolation, and Residuals', 4, TRUE)
a<-table.row.end(a)
a<-table.row.start(a)
a<-table.element(a, 'Time or Index', 1, TRUE)
a<-table.element(a, 'Actuals', 1, TRUE)
a<-table.element(a, 'Interpolation
Forecast', 1, TRUE)
a<-table.element(a, 'Residuals
Prediction Error', 1, TRUE)
a<-table.row.end(a)
for (i in 1:n) {
a<-table.row.start(a)
a<-table.element(a,i, 1, TRUE)
a<-table.element(a,x[i])
a<-table.element(a,x[i]-mysum$resid[i])
a<-table.element(a,mysum$resid[i])
a<-table.row.end(a)
}
a<-table.end(a)
table.save(a,file='mytable4.tab')
if (n > n25) {
a<-table.start()
a<-table.row.start(a)
a<-table.element(a,'Goldfeld-Quandt test for Heteroskedasticity',4,TRUE)
a<-table.row.end(a)
a<-table.row.start(a)
a<-table.element(a,'p-values',header=TRUE)
a<-table.element(a,'Alternative Hypothesis',3,header=TRUE)
a<-table.row.end(a)
a<-table.row.start(a)
a<-table.element(a,'breakpoint index',header=TRUE)
a<-table.element(a,'greater',header=TRUE)
a<-table.element(a,'2-sided',header=TRUE)
a<-table.element(a,'less',header=TRUE)
a<-table.row.end(a)
for (mypoint in kp3:nmkm3) {
a<-table.row.start(a)
a<-table.element(a,mypoint,header=TRUE)
a<-table.element(a,gqarr[mypoint-kp3+1,1])
a<-table.element(a,gqarr[mypoint-kp3+1,2])
a<-table.element(a,gqarr[mypoint-kp3+1,3])
a<-table.row.end(a)
}
a<-table.end(a)
table.save(a,file='mytable5.tab')
a<-table.start()
a<-table.row.start(a)
a<-table.element(a,'Meta Analysis of Goldfeld-Quandt test for Heteroskedasticity',4,TRUE)
a<-table.row.end(a)
a<-table.row.start(a)
a<-table.element(a,'Description',header=TRUE)
a<-table.element(a,'# significant tests',header=TRUE)
a<-table.element(a,'% significant tests',header=TRUE)
a<-table.element(a,'OK/NOK',header=TRUE)
a<-table.row.end(a)
a<-table.row.start(a)
a<-table.element(a,'1% type I error level',header=TRUE)
a<-table.element(a,numsignificant1)
a<-table.element(a,numsignificant1/numgqtests)
if (numsignificant1/numgqtests < 0.01) dum <- 'OK' else dum <- 'NOK'
a<-table.element(a,dum)
a<-table.row.end(a)
a<-table.row.start(a)
a<-table.element(a,'5% type I error level',header=TRUE)
a<-table.element(a,numsignificant5)
a<-table.element(a,numsignificant5/numgqtests)
if (numsignificant5/numgqtests < 0.05) dum <- 'OK' else dum <- 'NOK'
a<-table.element(a,dum)
a<-table.row.end(a)
a<-table.row.start(a)
a<-table.element(a,'10% type I error level',header=TRUE)
a<-table.element(a,numsignificant10)
a<-table.element(a,numsignificant10/numgqtests)
if (numsignificant10/numgqtests < 0.1) dum <- 'OK' else dum <- 'NOK'
a<-table.element(a,dum)
a<-table.row.end(a)
a<-table.end(a)
table.save(a,file='mytable6.tab')
}