Free Statistics

of Irreproducible Research!

Author's title

Author*The author of this computation has been verified*
R Software Modulerwasp_multipleregression.wasp
Title produced by softwareMultiple Regression
Date of computationWed, 18 Nov 2009 08:49:42 -0700
Cite this page as followsStatistical Computations at FreeStatistics.org, Office for Research Development and Education, URL https://freestatistics.org/blog/index.php?v=date/2009/Nov/18/t1258559525cxe0xg7jrhzk4mb.htm/, Retrieved Fri, 17 May 2024 21:51:02 +0000
Statistical Computations at FreeStatistics.org, Office for Research Development and Education, URL https://freestatistics.org/blog/index.php?pk=57487, Retrieved Fri, 17 May 2024 21:51:02 +0000
QR Codes:

Original text written by user:
IsPrivate?No (this computation is public)
User-defined keywords
Estimated Impact199
Family? (F = Feedback message, R = changed R code, M = changed R Module, P = changed Parameters, D = changed Data)
-     [Multiple Regression] [Q1 The Seatbeltlaw] [2007-11-14 19:27:43] [8cd6641b921d30ebe00b648d1481bba0]
- RMPD  [Multiple Regression] [Seatbelt] [2009-11-12 13:54:52] [b98453cac15ba1066b407e146608df68]
-   PD      [Multiple Regression] [Multiple regressi...] [2009-11-18 15:49:42] [fe2edc5b0acc9545190e03904e9be55e] [Current]
Feedback Forum

Post a new message
Dataseries X:
3.58	98.2
3.52	98.71
3.45	98.54
3.36	98.2
3.27	96.92
3.21	99.06
3.19	99.65
3.16	99.82
3.12	99.99
3.06	100.33
3.01	99.31
2.98	101.1
2.97	101.1
3.02	100.93
3.07	100.85
3.18	100.93
3.29	99.6
3.43	101.88
3.61	101.81
3.74	102.38
3.87	102.74
3.88	102.82
4.09	101.72
4.19	103.47
4.2	102.98
4.29	102.68
4.37	102.9
4.47	103.03
4.61	101.29
4.65	103.69
4.69	103.68
4.82	104.2
4.86	104.08
4.87	104.16
5.01	103.05
5.03	104.66
5.13	104.46
5.18	104.95
5.21	105.85
5.26	106.23
5.25	104.86
5.2	107.44
5.16	108.23
5.19	108.45
5.39	109.39
5.58	110.15
5.76	109.13
5.89	110.28
5.98	110.17
6.02	109.99
5.62	109.26
4.87	109.11
4.24	107.06
4.02	109.53
3.74	108.92
3.45	109.24
3.34	109.12
3.21	109
3.12	107.23
3.04	109.49


Summary of computational transaction
Raw Inputview raw input (R code)
Raw Outputview raw output of R engine
Computing time5 seconds
R Server'Gwilym Jenkins' @ 72.249.127.135

\begin{tabular}{lllllllll}
\hline
Summary of computational transaction \tabularnewline
Raw Input & view raw input (R code)  \tabularnewline
Raw Output & view raw output of R engine  \tabularnewline
Computing time & 5 seconds \tabularnewline
R Server & 'Gwilym Jenkins' @ 72.249.127.135 \tabularnewline
\hline
\end{tabular}
%Source: https://freestatistics.org/blog/index.php?pk=57487&T=0

[TABLE]
[ROW][C]Summary of computational transaction[/C][/ROW]
[ROW][C]Raw Input[/C][C]view raw input (R code) [/C][/ROW]
[ROW][C]Raw Output[/C][C]view raw output of R engine [/C][/ROW]
[ROW][C]Computing time[/C][C]5 seconds[/C][/ROW]
[ROW][C]R Server[/C][C]'Gwilym Jenkins' @ 72.249.127.135[/C][/ROW]
[/TABLE]
Source: https://freestatistics.org/blog/index.php?pk=57487&T=0

Globally Unique Identifier (entire table): ba.freestatistics.org/blog/index.php?pk=57487&T=0

As an alternative you can also use a QR Code:  

The GUIDs for individual cells are displayed in the table below:

Summary of computational transaction
Raw Inputview raw input (R code)
Raw Outputview raw output of R engine
Computing time5 seconds
R Server'Gwilym Jenkins' @ 72.249.127.135


Multiple Linear Regression - Estimated Regression Equation
Y[t] = -11.3899845756242 + 0.149706958152602X[t] + e[t]

\begin{tabular}{lllllllll}
\hline
Multiple Linear Regression - Estimated Regression Equation \tabularnewline
Y[t] =  -11.3899845756242 +  0.149706958152602X[t]  + e[t] \tabularnewline
\hline
\end{tabular}
%Source: https://freestatistics.org/blog/index.php?pk=57487&T=1

[TABLE]
[ROW][C]Multiple Linear Regression - Estimated Regression Equation[/C][/ROW]
[ROW][C]Y[t] =  -11.3899845756242 +  0.149706958152602X[t]  + e[t][/C][/ROW]
[/TABLE]
Source: https://freestatistics.org/blog/index.php?pk=57487&T=1

Globally Unique Identifier (entire table): ba.freestatistics.org/blog/index.php?pk=57487&T=1

As an alternative you can also use a QR Code:  

The GUIDs for individual cells are displayed in the table below:

Multiple Linear Regression - Estimated Regression Equation
Y[t] = -11.3899845756242 + 0.149706958152602X[t] + e[t]


Multiple Linear Regression - Ordinary Least Squares
VariableParameterS.D.T-STATH0: parameter = 02-tail p-value1-tail p-value
(Intercept)-11.38998457562422.629199-4.33215.9e-053e-05
X0.1497069581526020.0252315.933400

\begin{tabular}{lllllllll}
\hline
Multiple Linear Regression - Ordinary Least Squares \tabularnewline
Variable & Parameter & S.D. & T-STATH0: parameter = 0 & 2-tail p-value & 1-tail p-value \tabularnewline
(Intercept) & -11.3899845756242 & 2.629199 & -4.3321 & 5.9e-05 & 3e-05 \tabularnewline
X & 0.149706958152602 & 0.025231 & 5.9334 & 0 & 0 \tabularnewline
\hline
\end{tabular}
%Source: https://freestatistics.org/blog/index.php?pk=57487&T=2

[TABLE]
[ROW][C]Multiple Linear Regression - Ordinary Least Squares[/C][/ROW]
[ROW][C]Variable[/C][C]Parameter[/C][C]S.D.[/C][C]T-STATH0: parameter = 0[/C][C]2-tail p-value[/C][C]1-tail p-value[/C][/ROW]
[ROW][C](Intercept)[/C][C]-11.3899845756242[/C][C]2.629199[/C][C]-4.3321[/C][C]5.9e-05[/C][C]3e-05[/C][/ROW]
[ROW][C]X[/C][C]0.149706958152602[/C][C]0.025231[/C][C]5.9334[/C][C]0[/C][C]0[/C][/ROW]
[/TABLE]
Source: https://freestatistics.org/blog/index.php?pk=57487&T=2

Globally Unique Identifier (entire table): ba.freestatistics.org/blog/index.php?pk=57487&T=2

As an alternative you can also use a QR Code:  

The GUIDs for individual cells are displayed in the table below:

Multiple Linear Regression - Ordinary Least Squares
VariableParameterS.D.T-STATH0: parameter = 02-tail p-value1-tail p-value
(Intercept)-11.38998457562422.629199-4.33215.9e-053e-05
X0.1497069581526020.0252315.933400


Multiple Linear Regression - Regression Statistics
Multiple R0.614588260410374
R-squared0.377718729834249
Adjusted R-squared0.366989742417598
F-TEST (value)35.2054406595769
F-TEST (DF numerator)1
F-TEST (DF denominator)58
p-value1.75453659823077e-07
Multiple Linear Regression - Residual Statistics
Residual Standard Deviation0.752389648675282
Sum Squared Residuals32.8332306391554

\begin{tabular}{lllllllll}
\hline
Multiple Linear Regression - Regression Statistics \tabularnewline
Multiple R & 0.614588260410374 \tabularnewline
R-squared & 0.377718729834249 \tabularnewline
Adjusted R-squared & 0.366989742417598 \tabularnewline
F-TEST (value) & 35.2054406595769 \tabularnewline
F-TEST (DF numerator) & 1 \tabularnewline
F-TEST (DF denominator) & 58 \tabularnewline
p-value & 1.75453659823077e-07 \tabularnewline
Multiple Linear Regression - Residual Statistics \tabularnewline
Residual Standard Deviation & 0.752389648675282 \tabularnewline
Sum Squared Residuals & 32.8332306391554 \tabularnewline
\hline
\end{tabular}
%Source: https://freestatistics.org/blog/index.php?pk=57487&T=3

[TABLE]
[ROW][C]Multiple Linear Regression - Regression Statistics[/C][/ROW]
[ROW][C]Multiple R[/C][C]0.614588260410374[/C][/ROW]
[ROW][C]R-squared[/C][C]0.377718729834249[/C][/ROW]
[ROW][C]Adjusted R-squared[/C][C]0.366989742417598[/C][/ROW]
[ROW][C]F-TEST (value)[/C][C]35.2054406595769[/C][/ROW]
[ROW][C]F-TEST (DF numerator)[/C][C]1[/C][/ROW]
[ROW][C]F-TEST (DF denominator)[/C][C]58[/C][/ROW]
[ROW][C]p-value[/C][C]1.75453659823077e-07[/C][/ROW]
[ROW][C]Multiple Linear Regression - Residual Statistics[/C][/ROW]
[ROW][C]Residual Standard Deviation[/C][C]0.752389648675282[/C][/ROW]
[ROW][C]Sum Squared Residuals[/C][C]32.8332306391554[/C][/ROW]
[/TABLE]
Source: https://freestatistics.org/blog/index.php?pk=57487&T=3

Globally Unique Identifier (entire table): ba.freestatistics.org/blog/index.php?pk=57487&T=3

As an alternative you can also use a QR Code:  

The GUIDs for individual cells are displayed in the table below:

Multiple Linear Regression - Regression Statistics
Multiple R0.614588260410374
R-squared0.377718729834249
Adjusted R-squared0.366989742417598
F-TEST (value)35.2054406595769
F-TEST (DF numerator)1
F-TEST (DF denominator)58
p-value1.75453659823077e-07
Multiple Linear Regression - Residual Statistics
Residual Standard Deviation0.752389648675282
Sum Squared Residuals32.8332306391554


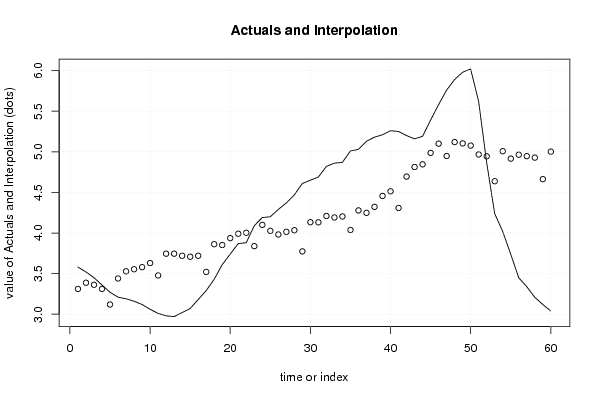
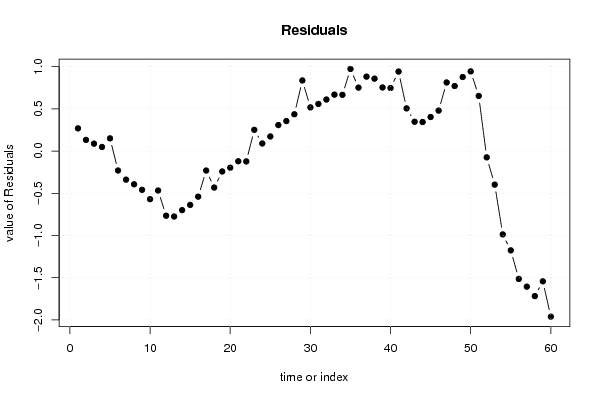
Multiple Linear Regression - Actuals, Interpolation, and Residuals
Time or IndexActualsInterpolationForecastResidualsPrediction Error
13.583.311238714961230.268761285038765
23.523.387589263619060.132410736380944
33.453.362139080733120.0878609192668842
43.363.311238714961230.048761285038769
53.273.11961380852590.150386191474099
63.213.43998669897247-0.229986698972468
73.193.52831380428250-0.338313804282504
83.163.55376398716844-0.393763987168444
93.123.57921417005439-0.459214170054387
103.063.63011453582627-0.570114535826271
113.013.47741343851062-0.467413438510619
122.983.74538889360377-0.765388893603774
132.973.74538889360377-0.775388893603774
143.023.71993871071783-0.699938710717834
153.073.70796215406562-0.637962154065624
163.183.71993871071783-0.539938710717834
173.293.52082845637487-0.230828456374872
183.433.86216032096280-0.432160320962803
193.613.85168083389212-0.241680833892123
203.743.93701380003910-0.197013800039104
213.873.99090830497404-0.120908304974041
223.884.00288486162625-0.122884861626249
234.093.838207207658390.251792792341612
244.194.100194384425440.0898056155745597
254.24.026837974930670.173162025069333
264.293.981925887484890.308074112515113
274.374.014861418278460.355138581721541
284.474.03432332283830.435676677161703
294.613.773833215652770.83616678434723
304.654.133129915219010.516870084780988
314.694.131632845637490.558367154362512
324.824.209480463876840.61051953612316
334.864.191515628898530.668484371101473
344.874.203492185550740.666507814449265
355.014.037317462001350.972682537998652
365.034.278345664627040.751654335372964
375.134.248404272996520.881595727003484
385.184.321760682491290.858239317508708
395.214.456496944828630.753503055171368
405.264.513385588926620.746614411073378
415.254.308287056257560.941712943742443
425.24.694531008291270.505468991708731
435.164.812799505231830.347200494768175
445.194.84573503602540.344264963974603
455.394.986459576688840.403540423311157
465.585.100236864884820.47976313511518
475.764.947535767569160.812464232430835
485.895.119698769444660.770301230555342
495.985.103231004047870.876768995952129
506.025.07628375158040.943716248419597
515.624.9669976721290.653002327870995
524.874.94454162840611-0.0745416284061137
534.244.63764236419328-0.397642364193281
544.025.00741855083021-0.987418550830207
553.744.91609730635712-1.17609730635712
563.454.96400353296595-1.51400353296595
573.344.94603869798764-1.60603869798764
583.214.92807386300933-1.71807386300933
593.124.66309254707922-1.54309254707922
603.045.0014302725041-1.96143027250410

\begin{tabular}{lllllllll}
\hline
Multiple Linear Regression - Actuals, Interpolation, and Residuals \tabularnewline
Time or Index & Actuals & InterpolationForecast & ResidualsPrediction Error \tabularnewline
1 & 3.58 & 3.31123871496123 & 0.268761285038765 \tabularnewline
2 & 3.52 & 3.38758926361906 & 0.132410736380944 \tabularnewline
3 & 3.45 & 3.36213908073312 & 0.0878609192668842 \tabularnewline
4 & 3.36 & 3.31123871496123 & 0.048761285038769 \tabularnewline
5 & 3.27 & 3.1196138085259 & 0.150386191474099 \tabularnewline
6 & 3.21 & 3.43998669897247 & -0.229986698972468 \tabularnewline
7 & 3.19 & 3.52831380428250 & -0.338313804282504 \tabularnewline
8 & 3.16 & 3.55376398716844 & -0.393763987168444 \tabularnewline
9 & 3.12 & 3.57921417005439 & -0.459214170054387 \tabularnewline
10 & 3.06 & 3.63011453582627 & -0.570114535826271 \tabularnewline
11 & 3.01 & 3.47741343851062 & -0.467413438510619 \tabularnewline
12 & 2.98 & 3.74538889360377 & -0.765388893603774 \tabularnewline
13 & 2.97 & 3.74538889360377 & -0.775388893603774 \tabularnewline
14 & 3.02 & 3.71993871071783 & -0.699938710717834 \tabularnewline
15 & 3.07 & 3.70796215406562 & -0.637962154065624 \tabularnewline
16 & 3.18 & 3.71993871071783 & -0.539938710717834 \tabularnewline
17 & 3.29 & 3.52082845637487 & -0.230828456374872 \tabularnewline
18 & 3.43 & 3.86216032096280 & -0.432160320962803 \tabularnewline
19 & 3.61 & 3.85168083389212 & -0.241680833892123 \tabularnewline
20 & 3.74 & 3.93701380003910 & -0.197013800039104 \tabularnewline
21 & 3.87 & 3.99090830497404 & -0.120908304974041 \tabularnewline
22 & 3.88 & 4.00288486162625 & -0.122884861626249 \tabularnewline
23 & 4.09 & 3.83820720765839 & 0.251792792341612 \tabularnewline
24 & 4.19 & 4.10019438442544 & 0.0898056155745597 \tabularnewline
25 & 4.2 & 4.02683797493067 & 0.173162025069333 \tabularnewline
26 & 4.29 & 3.98192588748489 & 0.308074112515113 \tabularnewline
27 & 4.37 & 4.01486141827846 & 0.355138581721541 \tabularnewline
28 & 4.47 & 4.0343233228383 & 0.435676677161703 \tabularnewline
29 & 4.61 & 3.77383321565277 & 0.83616678434723 \tabularnewline
30 & 4.65 & 4.13312991521901 & 0.516870084780988 \tabularnewline
31 & 4.69 & 4.13163284563749 & 0.558367154362512 \tabularnewline
32 & 4.82 & 4.20948046387684 & 0.61051953612316 \tabularnewline
33 & 4.86 & 4.19151562889853 & 0.668484371101473 \tabularnewline
34 & 4.87 & 4.20349218555074 & 0.666507814449265 \tabularnewline
35 & 5.01 & 4.03731746200135 & 0.972682537998652 \tabularnewline
36 & 5.03 & 4.27834566462704 & 0.751654335372964 \tabularnewline
37 & 5.13 & 4.24840427299652 & 0.881595727003484 \tabularnewline
38 & 5.18 & 4.32176068249129 & 0.858239317508708 \tabularnewline
39 & 5.21 & 4.45649694482863 & 0.753503055171368 \tabularnewline
40 & 5.26 & 4.51338558892662 & 0.746614411073378 \tabularnewline
41 & 5.25 & 4.30828705625756 & 0.941712943742443 \tabularnewline
42 & 5.2 & 4.69453100829127 & 0.505468991708731 \tabularnewline
43 & 5.16 & 4.81279950523183 & 0.347200494768175 \tabularnewline
44 & 5.19 & 4.8457350360254 & 0.344264963974603 \tabularnewline
45 & 5.39 & 4.98645957668884 & 0.403540423311157 \tabularnewline
46 & 5.58 & 5.10023686488482 & 0.47976313511518 \tabularnewline
47 & 5.76 & 4.94753576756916 & 0.812464232430835 \tabularnewline
48 & 5.89 & 5.11969876944466 & 0.770301230555342 \tabularnewline
49 & 5.98 & 5.10323100404787 & 0.876768995952129 \tabularnewline
50 & 6.02 & 5.0762837515804 & 0.943716248419597 \tabularnewline
51 & 5.62 & 4.966997672129 & 0.653002327870995 \tabularnewline
52 & 4.87 & 4.94454162840611 & -0.0745416284061137 \tabularnewline
53 & 4.24 & 4.63764236419328 & -0.397642364193281 \tabularnewline
54 & 4.02 & 5.00741855083021 & -0.987418550830207 \tabularnewline
55 & 3.74 & 4.91609730635712 & -1.17609730635712 \tabularnewline
56 & 3.45 & 4.96400353296595 & -1.51400353296595 \tabularnewline
57 & 3.34 & 4.94603869798764 & -1.60603869798764 \tabularnewline
58 & 3.21 & 4.92807386300933 & -1.71807386300933 \tabularnewline
59 & 3.12 & 4.66309254707922 & -1.54309254707922 \tabularnewline
60 & 3.04 & 5.0014302725041 & -1.96143027250410 \tabularnewline
\hline
\end{tabular}
%Source: https://freestatistics.org/blog/index.php?pk=57487&T=4

[TABLE]
[ROW][C]Multiple Linear Regression - Actuals, Interpolation, and Residuals[/C][/ROW]
[ROW][C]Time or Index[/C][C]Actuals[/C][C]InterpolationForecast[/C][C]ResidualsPrediction Error[/C][/ROW]
[ROW][C]1[/C][C]3.58[/C][C]3.31123871496123[/C][C]0.268761285038765[/C][/ROW]
[ROW][C]2[/C][C]3.52[/C][C]3.38758926361906[/C][C]0.132410736380944[/C][/ROW]
[ROW][C]3[/C][C]3.45[/C][C]3.36213908073312[/C][C]0.0878609192668842[/C][/ROW]
[ROW][C]4[/C][C]3.36[/C][C]3.31123871496123[/C][C]0.048761285038769[/C][/ROW]
[ROW][C]5[/C][C]3.27[/C][C]3.1196138085259[/C][C]0.150386191474099[/C][/ROW]
[ROW][C]6[/C][C]3.21[/C][C]3.43998669897247[/C][C]-0.229986698972468[/C][/ROW]
[ROW][C]7[/C][C]3.19[/C][C]3.52831380428250[/C][C]-0.338313804282504[/C][/ROW]
[ROW][C]8[/C][C]3.16[/C][C]3.55376398716844[/C][C]-0.393763987168444[/C][/ROW]
[ROW][C]9[/C][C]3.12[/C][C]3.57921417005439[/C][C]-0.459214170054387[/C][/ROW]
[ROW][C]10[/C][C]3.06[/C][C]3.63011453582627[/C][C]-0.570114535826271[/C][/ROW]
[ROW][C]11[/C][C]3.01[/C][C]3.47741343851062[/C][C]-0.467413438510619[/C][/ROW]
[ROW][C]12[/C][C]2.98[/C][C]3.74538889360377[/C][C]-0.765388893603774[/C][/ROW]
[ROW][C]13[/C][C]2.97[/C][C]3.74538889360377[/C][C]-0.775388893603774[/C][/ROW]
[ROW][C]14[/C][C]3.02[/C][C]3.71993871071783[/C][C]-0.699938710717834[/C][/ROW]
[ROW][C]15[/C][C]3.07[/C][C]3.70796215406562[/C][C]-0.637962154065624[/C][/ROW]
[ROW][C]16[/C][C]3.18[/C][C]3.71993871071783[/C][C]-0.539938710717834[/C][/ROW]
[ROW][C]17[/C][C]3.29[/C][C]3.52082845637487[/C][C]-0.230828456374872[/C][/ROW]
[ROW][C]18[/C][C]3.43[/C][C]3.86216032096280[/C][C]-0.432160320962803[/C][/ROW]
[ROW][C]19[/C][C]3.61[/C][C]3.85168083389212[/C][C]-0.241680833892123[/C][/ROW]
[ROW][C]20[/C][C]3.74[/C][C]3.93701380003910[/C][C]-0.197013800039104[/C][/ROW]
[ROW][C]21[/C][C]3.87[/C][C]3.99090830497404[/C][C]-0.120908304974041[/C][/ROW]
[ROW][C]22[/C][C]3.88[/C][C]4.00288486162625[/C][C]-0.122884861626249[/C][/ROW]
[ROW][C]23[/C][C]4.09[/C][C]3.83820720765839[/C][C]0.251792792341612[/C][/ROW]
[ROW][C]24[/C][C]4.19[/C][C]4.10019438442544[/C][C]0.0898056155745597[/C][/ROW]
[ROW][C]25[/C][C]4.2[/C][C]4.02683797493067[/C][C]0.173162025069333[/C][/ROW]
[ROW][C]26[/C][C]4.29[/C][C]3.98192588748489[/C][C]0.308074112515113[/C][/ROW]
[ROW][C]27[/C][C]4.37[/C][C]4.01486141827846[/C][C]0.355138581721541[/C][/ROW]
[ROW][C]28[/C][C]4.47[/C][C]4.0343233228383[/C][C]0.435676677161703[/C][/ROW]
[ROW][C]29[/C][C]4.61[/C][C]3.77383321565277[/C][C]0.83616678434723[/C][/ROW]
[ROW][C]30[/C][C]4.65[/C][C]4.13312991521901[/C][C]0.516870084780988[/C][/ROW]
[ROW][C]31[/C][C]4.69[/C][C]4.13163284563749[/C][C]0.558367154362512[/C][/ROW]
[ROW][C]32[/C][C]4.82[/C][C]4.20948046387684[/C][C]0.61051953612316[/C][/ROW]
[ROW][C]33[/C][C]4.86[/C][C]4.19151562889853[/C][C]0.668484371101473[/C][/ROW]
[ROW][C]34[/C][C]4.87[/C][C]4.20349218555074[/C][C]0.666507814449265[/C][/ROW]
[ROW][C]35[/C][C]5.01[/C][C]4.03731746200135[/C][C]0.972682537998652[/C][/ROW]
[ROW][C]36[/C][C]5.03[/C][C]4.27834566462704[/C][C]0.751654335372964[/C][/ROW]
[ROW][C]37[/C][C]5.13[/C][C]4.24840427299652[/C][C]0.881595727003484[/C][/ROW]
[ROW][C]38[/C][C]5.18[/C][C]4.32176068249129[/C][C]0.858239317508708[/C][/ROW]
[ROW][C]39[/C][C]5.21[/C][C]4.45649694482863[/C][C]0.753503055171368[/C][/ROW]
[ROW][C]40[/C][C]5.26[/C][C]4.51338558892662[/C][C]0.746614411073378[/C][/ROW]
[ROW][C]41[/C][C]5.25[/C][C]4.30828705625756[/C][C]0.941712943742443[/C][/ROW]
[ROW][C]42[/C][C]5.2[/C][C]4.69453100829127[/C][C]0.505468991708731[/C][/ROW]
[ROW][C]43[/C][C]5.16[/C][C]4.81279950523183[/C][C]0.347200494768175[/C][/ROW]
[ROW][C]44[/C][C]5.19[/C][C]4.8457350360254[/C][C]0.344264963974603[/C][/ROW]
[ROW][C]45[/C][C]5.39[/C][C]4.98645957668884[/C][C]0.403540423311157[/C][/ROW]
[ROW][C]46[/C][C]5.58[/C][C]5.10023686488482[/C][C]0.47976313511518[/C][/ROW]
[ROW][C]47[/C][C]5.76[/C][C]4.94753576756916[/C][C]0.812464232430835[/C][/ROW]
[ROW][C]48[/C][C]5.89[/C][C]5.11969876944466[/C][C]0.770301230555342[/C][/ROW]
[ROW][C]49[/C][C]5.98[/C][C]5.10323100404787[/C][C]0.876768995952129[/C][/ROW]
[ROW][C]50[/C][C]6.02[/C][C]5.0762837515804[/C][C]0.943716248419597[/C][/ROW]
[ROW][C]51[/C][C]5.62[/C][C]4.966997672129[/C][C]0.653002327870995[/C][/ROW]
[ROW][C]52[/C][C]4.87[/C][C]4.94454162840611[/C][C]-0.0745416284061137[/C][/ROW]
[ROW][C]53[/C][C]4.24[/C][C]4.63764236419328[/C][C]-0.397642364193281[/C][/ROW]
[ROW][C]54[/C][C]4.02[/C][C]5.00741855083021[/C][C]-0.987418550830207[/C][/ROW]
[ROW][C]55[/C][C]3.74[/C][C]4.91609730635712[/C][C]-1.17609730635712[/C][/ROW]
[ROW][C]56[/C][C]3.45[/C][C]4.96400353296595[/C][C]-1.51400353296595[/C][/ROW]
[ROW][C]57[/C][C]3.34[/C][C]4.94603869798764[/C][C]-1.60603869798764[/C][/ROW]
[ROW][C]58[/C][C]3.21[/C][C]4.92807386300933[/C][C]-1.71807386300933[/C][/ROW]
[ROW][C]59[/C][C]3.12[/C][C]4.66309254707922[/C][C]-1.54309254707922[/C][/ROW]
[ROW][C]60[/C][C]3.04[/C][C]5.0014302725041[/C][C]-1.96143027250410[/C][/ROW]
[/TABLE]
Source: https://freestatistics.org/blog/index.php?pk=57487&T=4

Globally Unique Identifier (entire table): ba.freestatistics.org/blog/index.php?pk=57487&T=4

As an alternative you can also use a QR Code:  

The GUIDs for individual cells are displayed in the table below:

Multiple Linear Regression - Actuals, Interpolation, and Residuals
Time or IndexActualsInterpolationForecastResidualsPrediction Error
13.583.311238714961230.268761285038765
23.523.387589263619060.132410736380944
33.453.362139080733120.0878609192668842
43.363.311238714961230.048761285038769
53.273.11961380852590.150386191474099
63.213.43998669897247-0.229986698972468
73.193.52831380428250-0.338313804282504
83.163.55376398716844-0.393763987168444
93.123.57921417005439-0.459214170054387
103.063.63011453582627-0.570114535826271
113.013.47741343851062-0.467413438510619
122.983.74538889360377-0.765388893603774
132.973.74538889360377-0.775388893603774
143.023.71993871071783-0.699938710717834
153.073.70796215406562-0.637962154065624
163.183.71993871071783-0.539938710717834
173.293.52082845637487-0.230828456374872
183.433.86216032096280-0.432160320962803
193.613.85168083389212-0.241680833892123
203.743.93701380003910-0.197013800039104
213.873.99090830497404-0.120908304974041
223.884.00288486162625-0.122884861626249
234.093.838207207658390.251792792341612
244.194.100194384425440.0898056155745597
254.24.026837974930670.173162025069333
264.293.981925887484890.308074112515113
274.374.014861418278460.355138581721541
284.474.03432332283830.435676677161703
294.613.773833215652770.83616678434723
304.654.133129915219010.516870084780988
314.694.131632845637490.558367154362512
324.824.209480463876840.61051953612316
334.864.191515628898530.668484371101473
344.874.203492185550740.666507814449265
355.014.037317462001350.972682537998652
365.034.278345664627040.751654335372964
375.134.248404272996520.881595727003484
385.184.321760682491290.858239317508708
395.214.456496944828630.753503055171368
405.264.513385588926620.746614411073378
415.254.308287056257560.941712943742443
425.24.694531008291270.505468991708731
435.164.812799505231830.347200494768175
445.194.84573503602540.344264963974603
455.394.986459576688840.403540423311157
465.585.100236864884820.47976313511518
475.764.947535767569160.812464232430835
485.895.119698769444660.770301230555342
495.985.103231004047870.876768995952129
506.025.07628375158040.943716248419597
515.624.9669976721290.653002327870995
524.874.94454162840611-0.0745416284061137
534.244.63764236419328-0.397642364193281
544.025.00741855083021-0.987418550830207
553.744.91609730635712-1.17609730635712
563.454.96400353296595-1.51400353296595
573.344.94603869798764-1.60603869798764
583.214.92807386300933-1.71807386300933
593.124.66309254707922-1.54309254707922
603.045.0014302725041-1.96143027250410


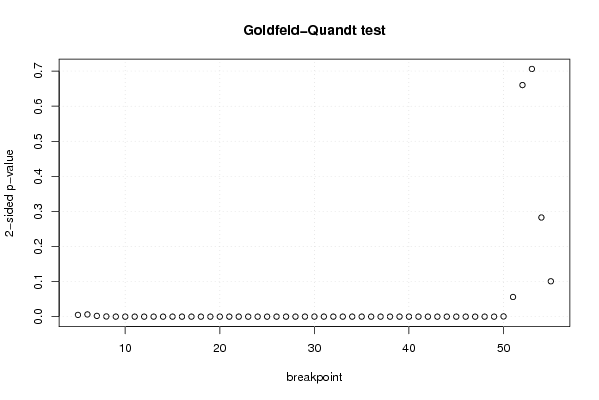
Goldfeld-Quandt test for Heteroskedasticity
p-valuesAlternative Hypothesis
breakpoint indexgreater2-sidedless
50.002452648113988950.004905296227977890.997547351886011
60.003199229612079130.006398459224158250.99680077038792
70.001081451870215250.002162903740430510.998918548129785
80.0002677920925701440.0005355841851402880.99973220790743
96.10005097000873e-050.0001220010194001750.9999389994903
101.35171005977400e-052.70342011954799e-050.999986482899402
117.37820152169173e-061.47564030433835e-050.999992621798478
121.50474025134314e-063.00948050268628e-060.999998495259749
133.05655911312344e-076.11311822624688e-070.999999694344089
145.948841386796e-081.1897682773592e-070.999999940511586
151.19244085247179e-082.38488170494358e-080.999999988075591
164.04612341420364e-098.09224682840728e-090.999999995953877
179.31911020203407e-101.86382204040681e-090.99999999906809
181.13662533408620e-082.27325066817239e-080.999999988633747
199.93316750146693e-081.98663350029339e-070.999999900668325
205.2828342363588e-071.05656684727176e-060.999999471716576
211.62191644549707e-063.24383289099414e-060.999998378083555
222.13101809415254e-064.26203618830509e-060.999997868981906
236.80422435370481e-061.36084487074096e-050.999993195775646
249.20499868458795e-061.84099973691759e-050.999990795001315
251.02308421526926e-052.04616843053852e-050.999989769157847
261.32191743338568e-052.64383486677136e-050.999986780825666
271.51241554156497e-053.02483108312994e-050.999984875844584
281.70819036375978e-053.41638072751955e-050.999982918096362
297.02890649473422e-050.0001405781298946840.999929710935053
305.73797713037114e-050.0001147595426074230.999942620228696
314.37228431317021e-058.74456862634041e-050.999956277156868
322.99174030299255e-055.9834806059851e-050.99997008259697
332.04061823048621e-054.08123646097242e-050.999979593817695
341.23560771178477e-052.47121542356954e-050.999987643922882
351.65023187277443e-053.30046374554886e-050.999983497681272
368.91016882175798e-061.78203376435160e-050.999991089831178
375.76133901855328e-061.15226780371066e-050.999994238660981
383.28011134143863e-066.56022268287726e-060.999996719888659
391.63009974931822e-063.26019949863643e-060.99999836990025
409.10091282958437e-071.82018256591687e-060.999999089908717
412.18213060906647e-064.36426121813294e-060.99999781786939
423.52044572634056e-067.04089145268112e-060.999996479554274
435.22724233460637e-061.04544846692127e-050.999994772757665
447.40575459433527e-061.48115091886705e-050.999992594245406
456.06329863160839e-061.21265972632168e-050.999993936701368
463.44918759742395e-066.8983751948479e-060.999996550812403
476.92325939860476e-061.38465187972095e-050.999993076740601
485.84976181480035e-061.16995236296007e-050.999994150238185
491.38233523040288e-052.76467046080576e-050.999986176647696
500.0003334916140705260.0006669832281410530.99966650838593
510.02802272295203010.05604544590406020.97197727704797
520.3301243025998010.6602486051996010.669875697400199
530.6469070721754680.7061858556490650.353092927824532
540.8586483460107330.2827033079785330.141351653989266
550.9495762165828940.1008475668342110.0504237834171055

\begin{tabular}{lllllllll}
\hline
Goldfeld-Quandt test for Heteroskedasticity \tabularnewline
p-values & Alternative Hypothesis \tabularnewline
breakpoint index & greater & 2-sided & less \tabularnewline
5 & 0.00245264811398895 & 0.00490529622797789 & 0.997547351886011 \tabularnewline
6 & 0.00319922961207913 & 0.00639845922415825 & 0.99680077038792 \tabularnewline
7 & 0.00108145187021525 & 0.00216290374043051 & 0.998918548129785 \tabularnewline
8 & 0.000267792092570144 & 0.000535584185140288 & 0.99973220790743 \tabularnewline
9 & 6.10005097000873e-05 & 0.000122001019400175 & 0.9999389994903 \tabularnewline
10 & 1.35171005977400e-05 & 2.70342011954799e-05 & 0.999986482899402 \tabularnewline
11 & 7.37820152169173e-06 & 1.47564030433835e-05 & 0.999992621798478 \tabularnewline
12 & 1.50474025134314e-06 & 3.00948050268628e-06 & 0.999998495259749 \tabularnewline
13 & 3.05655911312344e-07 & 6.11311822624688e-07 & 0.999999694344089 \tabularnewline
14 & 5.948841386796e-08 & 1.1897682773592e-07 & 0.999999940511586 \tabularnewline
15 & 1.19244085247179e-08 & 2.38488170494358e-08 & 0.999999988075591 \tabularnewline
16 & 4.04612341420364e-09 & 8.09224682840728e-09 & 0.999999995953877 \tabularnewline
17 & 9.31911020203407e-10 & 1.86382204040681e-09 & 0.99999999906809 \tabularnewline
18 & 1.13662533408620e-08 & 2.27325066817239e-08 & 0.999999988633747 \tabularnewline
19 & 9.93316750146693e-08 & 1.98663350029339e-07 & 0.999999900668325 \tabularnewline
20 & 5.2828342363588e-07 & 1.05656684727176e-06 & 0.999999471716576 \tabularnewline
21 & 1.62191644549707e-06 & 3.24383289099414e-06 & 0.999998378083555 \tabularnewline
22 & 2.13101809415254e-06 & 4.26203618830509e-06 & 0.999997868981906 \tabularnewline
23 & 6.80422435370481e-06 & 1.36084487074096e-05 & 0.999993195775646 \tabularnewline
24 & 9.20499868458795e-06 & 1.84099973691759e-05 & 0.999990795001315 \tabularnewline
25 & 1.02308421526926e-05 & 2.04616843053852e-05 & 0.999989769157847 \tabularnewline
26 & 1.32191743338568e-05 & 2.64383486677136e-05 & 0.999986780825666 \tabularnewline
27 & 1.51241554156497e-05 & 3.02483108312994e-05 & 0.999984875844584 \tabularnewline
28 & 1.70819036375978e-05 & 3.41638072751955e-05 & 0.999982918096362 \tabularnewline
29 & 7.02890649473422e-05 & 0.000140578129894684 & 0.999929710935053 \tabularnewline
30 & 5.73797713037114e-05 & 0.000114759542607423 & 0.999942620228696 \tabularnewline
31 & 4.37228431317021e-05 & 8.74456862634041e-05 & 0.999956277156868 \tabularnewline
32 & 2.99174030299255e-05 & 5.9834806059851e-05 & 0.99997008259697 \tabularnewline
33 & 2.04061823048621e-05 & 4.08123646097242e-05 & 0.999979593817695 \tabularnewline
34 & 1.23560771178477e-05 & 2.47121542356954e-05 & 0.999987643922882 \tabularnewline
35 & 1.65023187277443e-05 & 3.30046374554886e-05 & 0.999983497681272 \tabularnewline
36 & 8.91016882175798e-06 & 1.78203376435160e-05 & 0.999991089831178 \tabularnewline
37 & 5.76133901855328e-06 & 1.15226780371066e-05 & 0.999994238660981 \tabularnewline
38 & 3.28011134143863e-06 & 6.56022268287726e-06 & 0.999996719888659 \tabularnewline
39 & 1.63009974931822e-06 & 3.26019949863643e-06 & 0.99999836990025 \tabularnewline
40 & 9.10091282958437e-07 & 1.82018256591687e-06 & 0.999999089908717 \tabularnewline
41 & 2.18213060906647e-06 & 4.36426121813294e-06 & 0.99999781786939 \tabularnewline
42 & 3.52044572634056e-06 & 7.04089145268112e-06 & 0.999996479554274 \tabularnewline
43 & 5.22724233460637e-06 & 1.04544846692127e-05 & 0.999994772757665 \tabularnewline
44 & 7.40575459433527e-06 & 1.48115091886705e-05 & 0.999992594245406 \tabularnewline
45 & 6.06329863160839e-06 & 1.21265972632168e-05 & 0.999993936701368 \tabularnewline
46 & 3.44918759742395e-06 & 6.8983751948479e-06 & 0.999996550812403 \tabularnewline
47 & 6.92325939860476e-06 & 1.38465187972095e-05 & 0.999993076740601 \tabularnewline
48 & 5.84976181480035e-06 & 1.16995236296007e-05 & 0.999994150238185 \tabularnewline
49 & 1.38233523040288e-05 & 2.76467046080576e-05 & 0.999986176647696 \tabularnewline
50 & 0.000333491614070526 & 0.000666983228141053 & 0.99966650838593 \tabularnewline
51 & 0.0280227229520301 & 0.0560454459040602 & 0.97197727704797 \tabularnewline
52 & 0.330124302599801 & 0.660248605199601 & 0.669875697400199 \tabularnewline
53 & 0.646907072175468 & 0.706185855649065 & 0.353092927824532 \tabularnewline
54 & 0.858648346010733 & 0.282703307978533 & 0.141351653989266 \tabularnewline
55 & 0.949576216582894 & 0.100847566834211 & 0.0504237834171055 \tabularnewline
\hline
\end{tabular}
%Source: https://freestatistics.org/blog/index.php?pk=57487&T=5

[TABLE]
[ROW][C]Goldfeld-Quandt test for Heteroskedasticity[/C][/ROW]
[ROW][C]p-values[/C][C]Alternative Hypothesis[/C][/ROW]
[ROW][C]breakpoint index[/C][C]greater[/C][C]2-sided[/C][C]less[/C][/ROW]
[ROW][C]5[/C][C]0.00245264811398895[/C][C]0.00490529622797789[/C][C]0.997547351886011[/C][/ROW]
[ROW][C]6[/C][C]0.00319922961207913[/C][C]0.00639845922415825[/C][C]0.99680077038792[/C][/ROW]
[ROW][C]7[/C][C]0.00108145187021525[/C][C]0.00216290374043051[/C][C]0.998918548129785[/C][/ROW]
[ROW][C]8[/C][C]0.000267792092570144[/C][C]0.000535584185140288[/C][C]0.99973220790743[/C][/ROW]
[ROW][C]9[/C][C]6.10005097000873e-05[/C][C]0.000122001019400175[/C][C]0.9999389994903[/C][/ROW]
[ROW][C]10[/C][C]1.35171005977400e-05[/C][C]2.70342011954799e-05[/C][C]0.999986482899402[/C][/ROW]
[ROW][C]11[/C][C]7.37820152169173e-06[/C][C]1.47564030433835e-05[/C][C]0.999992621798478[/C][/ROW]
[ROW][C]12[/C][C]1.50474025134314e-06[/C][C]3.00948050268628e-06[/C][C]0.999998495259749[/C][/ROW]
[ROW][C]13[/C][C]3.05655911312344e-07[/C][C]6.11311822624688e-07[/C][C]0.999999694344089[/C][/ROW]
[ROW][C]14[/C][C]5.948841386796e-08[/C][C]1.1897682773592e-07[/C][C]0.999999940511586[/C][/ROW]
[ROW][C]15[/C][C]1.19244085247179e-08[/C][C]2.38488170494358e-08[/C][C]0.999999988075591[/C][/ROW]
[ROW][C]16[/C][C]4.04612341420364e-09[/C][C]8.09224682840728e-09[/C][C]0.999999995953877[/C][/ROW]
[ROW][C]17[/C][C]9.31911020203407e-10[/C][C]1.86382204040681e-09[/C][C]0.99999999906809[/C][/ROW]
[ROW][C]18[/C][C]1.13662533408620e-08[/C][C]2.27325066817239e-08[/C][C]0.999999988633747[/C][/ROW]
[ROW][C]19[/C][C]9.93316750146693e-08[/C][C]1.98663350029339e-07[/C][C]0.999999900668325[/C][/ROW]
[ROW][C]20[/C][C]5.2828342363588e-07[/C][C]1.05656684727176e-06[/C][C]0.999999471716576[/C][/ROW]
[ROW][C]21[/C][C]1.62191644549707e-06[/C][C]3.24383289099414e-06[/C][C]0.999998378083555[/C][/ROW]
[ROW][C]22[/C][C]2.13101809415254e-06[/C][C]4.26203618830509e-06[/C][C]0.999997868981906[/C][/ROW]
[ROW][C]23[/C][C]6.80422435370481e-06[/C][C]1.36084487074096e-05[/C][C]0.999993195775646[/C][/ROW]
[ROW][C]24[/C][C]9.20499868458795e-06[/C][C]1.84099973691759e-05[/C][C]0.999990795001315[/C][/ROW]
[ROW][C]25[/C][C]1.02308421526926e-05[/C][C]2.04616843053852e-05[/C][C]0.999989769157847[/C][/ROW]
[ROW][C]26[/C][C]1.32191743338568e-05[/C][C]2.64383486677136e-05[/C][C]0.999986780825666[/C][/ROW]
[ROW][C]27[/C][C]1.51241554156497e-05[/C][C]3.02483108312994e-05[/C][C]0.999984875844584[/C][/ROW]
[ROW][C]28[/C][C]1.70819036375978e-05[/C][C]3.41638072751955e-05[/C][C]0.999982918096362[/C][/ROW]
[ROW][C]29[/C][C]7.02890649473422e-05[/C][C]0.000140578129894684[/C][C]0.999929710935053[/C][/ROW]
[ROW][C]30[/C][C]5.73797713037114e-05[/C][C]0.000114759542607423[/C][C]0.999942620228696[/C][/ROW]
[ROW][C]31[/C][C]4.37228431317021e-05[/C][C]8.74456862634041e-05[/C][C]0.999956277156868[/C][/ROW]
[ROW][C]32[/C][C]2.99174030299255e-05[/C][C]5.9834806059851e-05[/C][C]0.99997008259697[/C][/ROW]
[ROW][C]33[/C][C]2.04061823048621e-05[/C][C]4.08123646097242e-05[/C][C]0.999979593817695[/C][/ROW]
[ROW][C]34[/C][C]1.23560771178477e-05[/C][C]2.47121542356954e-05[/C][C]0.999987643922882[/C][/ROW]
[ROW][C]35[/C][C]1.65023187277443e-05[/C][C]3.30046374554886e-05[/C][C]0.999983497681272[/C][/ROW]
[ROW][C]36[/C][C]8.91016882175798e-06[/C][C]1.78203376435160e-05[/C][C]0.999991089831178[/C][/ROW]
[ROW][C]37[/C][C]5.76133901855328e-06[/C][C]1.15226780371066e-05[/C][C]0.999994238660981[/C][/ROW]
[ROW][C]38[/C][C]3.28011134143863e-06[/C][C]6.56022268287726e-06[/C][C]0.999996719888659[/C][/ROW]
[ROW][C]39[/C][C]1.63009974931822e-06[/C][C]3.26019949863643e-06[/C][C]0.99999836990025[/C][/ROW]
[ROW][C]40[/C][C]9.10091282958437e-07[/C][C]1.82018256591687e-06[/C][C]0.999999089908717[/C][/ROW]
[ROW][C]41[/C][C]2.18213060906647e-06[/C][C]4.36426121813294e-06[/C][C]0.99999781786939[/C][/ROW]
[ROW][C]42[/C][C]3.52044572634056e-06[/C][C]7.04089145268112e-06[/C][C]0.999996479554274[/C][/ROW]
[ROW][C]43[/C][C]5.22724233460637e-06[/C][C]1.04544846692127e-05[/C][C]0.999994772757665[/C][/ROW]
[ROW][C]44[/C][C]7.40575459433527e-06[/C][C]1.48115091886705e-05[/C][C]0.999992594245406[/C][/ROW]
[ROW][C]45[/C][C]6.06329863160839e-06[/C][C]1.21265972632168e-05[/C][C]0.999993936701368[/C][/ROW]
[ROW][C]46[/C][C]3.44918759742395e-06[/C][C]6.8983751948479e-06[/C][C]0.999996550812403[/C][/ROW]
[ROW][C]47[/C][C]6.92325939860476e-06[/C][C]1.38465187972095e-05[/C][C]0.999993076740601[/C][/ROW]
[ROW][C]48[/C][C]5.84976181480035e-06[/C][C]1.16995236296007e-05[/C][C]0.999994150238185[/C][/ROW]
[ROW][C]49[/C][C]1.38233523040288e-05[/C][C]2.76467046080576e-05[/C][C]0.999986176647696[/C][/ROW]
[ROW][C]50[/C][C]0.000333491614070526[/C][C]0.000666983228141053[/C][C]0.99966650838593[/C][/ROW]
[ROW][C]51[/C][C]0.0280227229520301[/C][C]0.0560454459040602[/C][C]0.97197727704797[/C][/ROW]
[ROW][C]52[/C][C]0.330124302599801[/C][C]0.660248605199601[/C][C]0.669875697400199[/C][/ROW]
[ROW][C]53[/C][C]0.646907072175468[/C][C]0.706185855649065[/C][C]0.353092927824532[/C][/ROW]
[ROW][C]54[/C][C]0.858648346010733[/C][C]0.282703307978533[/C][C]0.141351653989266[/C][/ROW]
[ROW][C]55[/C][C]0.949576216582894[/C][C]0.100847566834211[/C][C]0.0504237834171055[/C][/ROW]
[/TABLE]
Source: https://freestatistics.org/blog/index.php?pk=57487&T=5

Globally Unique Identifier (entire table): ba.freestatistics.org/blog/index.php?pk=57487&T=5

As an alternative you can also use a QR Code:  

The GUIDs for individual cells are displayed in the table below:

Goldfeld-Quandt test for Heteroskedasticity
p-valuesAlternative Hypothesis
breakpoint indexgreater2-sidedless
50.002452648113988950.004905296227977890.997547351886011
60.003199229612079130.006398459224158250.99680077038792
70.001081451870215250.002162903740430510.998918548129785
80.0002677920925701440.0005355841851402880.99973220790743
96.10005097000873e-050.0001220010194001750.9999389994903
101.35171005977400e-052.70342011954799e-050.999986482899402
117.37820152169173e-061.47564030433835e-050.999992621798478
121.50474025134314e-063.00948050268628e-060.999998495259749
133.05655911312344e-076.11311822624688e-070.999999694344089
145.948841386796e-081.1897682773592e-070.999999940511586
151.19244085247179e-082.38488170494358e-080.999999988075591
164.04612341420364e-098.09224682840728e-090.999999995953877
179.31911020203407e-101.86382204040681e-090.99999999906809
181.13662533408620e-082.27325066817239e-080.999999988633747
199.93316750146693e-081.98663350029339e-070.999999900668325
205.2828342363588e-071.05656684727176e-060.999999471716576
211.62191644549707e-063.24383289099414e-060.999998378083555
222.13101809415254e-064.26203618830509e-060.999997868981906
236.80422435370481e-061.36084487074096e-050.999993195775646
249.20499868458795e-061.84099973691759e-050.999990795001315
251.02308421526926e-052.04616843053852e-050.999989769157847
261.32191743338568e-052.64383486677136e-050.999986780825666
271.51241554156497e-053.02483108312994e-050.999984875844584
281.70819036375978e-053.41638072751955e-050.999982918096362
297.02890649473422e-050.0001405781298946840.999929710935053
305.73797713037114e-050.0001147595426074230.999942620228696
314.37228431317021e-058.74456862634041e-050.999956277156868
322.99174030299255e-055.9834806059851e-050.99997008259697
332.04061823048621e-054.08123646097242e-050.999979593817695
341.23560771178477e-052.47121542356954e-050.999987643922882
351.65023187277443e-053.30046374554886e-050.999983497681272
368.91016882175798e-061.78203376435160e-050.999991089831178
375.76133901855328e-061.15226780371066e-050.999994238660981
383.28011134143863e-066.56022268287726e-060.999996719888659
391.63009974931822e-063.26019949863643e-060.99999836990025
409.10091282958437e-071.82018256591687e-060.999999089908717
412.18213060906647e-064.36426121813294e-060.99999781786939
423.52044572634056e-067.04089145268112e-060.999996479554274
435.22724233460637e-061.04544846692127e-050.999994772757665
447.40575459433527e-061.48115091886705e-050.999992594245406
456.06329863160839e-061.21265972632168e-050.999993936701368
463.44918759742395e-066.8983751948479e-060.999996550812403
476.92325939860476e-061.38465187972095e-050.999993076740601
485.84976181480035e-061.16995236296007e-050.999994150238185
491.38233523040288e-052.76467046080576e-050.999986176647696
500.0003334916140705260.0006669832281410530.99966650838593
510.02802272295203010.05604544590406020.97197727704797
520.3301243025998010.6602486051996010.669875697400199
530.6469070721754680.7061858556490650.353092927824532
540.8586483460107330.2827033079785330.141351653989266
550.9495762165828940.1008475668342110.0504237834171055


Meta Analysis of Goldfeld-Quandt test for Heteroskedasticity
Description# significant tests% significant testsOK/NOK
1% type I error level460.901960784313726NOK
5% type I error level460.901960784313726NOK
10% type I error level470.92156862745098NOK

\begin{tabular}{lllllllll}
\hline
Meta Analysis of Goldfeld-Quandt test for Heteroskedasticity \tabularnewline
Description & # significant tests & % significant tests & OK/NOK \tabularnewline
1% type I error level & 46 & 0.901960784313726 & NOK \tabularnewline
5% type I error level & 46 & 0.901960784313726 & NOK \tabularnewline
10% type I error level & 47 & 0.92156862745098 & NOK \tabularnewline
\hline
\end{tabular}
%Source: https://freestatistics.org/blog/index.php?pk=57487&T=6

[TABLE]
[ROW][C]Meta Analysis of Goldfeld-Quandt test for Heteroskedasticity[/C][/ROW]
[ROW][C]Description[/C][C]# significant tests[/C][C]% significant tests[/C][C]OK/NOK[/C][/ROW]
[ROW][C]1% type I error level[/C][C]46[/C][C]0.901960784313726[/C][C]NOK[/C][/ROW]
[ROW][C]5% type I error level[/C][C]46[/C][C]0.901960784313726[/C][C]NOK[/C][/ROW]
[ROW][C]10% type I error level[/C][C]47[/C][C]0.92156862745098[/C][C]NOK[/C][/ROW]
[/TABLE]
Source: https://freestatistics.org/blog/index.php?pk=57487&T=6

Globally Unique Identifier (entire table): ba.freestatistics.org/blog/index.php?pk=57487&T=6

As an alternative you can also use a QR Code:  

The GUIDs for individual cells are displayed in the table below:

Meta Analysis of Goldfeld-Quandt test for Heteroskedasticity
Description# significant tests% significant testsOK/NOK
1% type I error level460.901960784313726NOK
5% type I error level460.901960784313726NOK
10% type I error level470.92156862745098NOK


Parameters (Session):
Parameters (R input):
par1 = 1 ; par2 = Do not include Seasonal Dummies ; par3 = No Linear Trend ;
R code (references can be found in the software module):
library(lattice)
library(lmtest)
n25 <- 25 #minimum number of obs. for Goldfeld-Quandt test
par1 <- as.numeric(par1)
x <- t(y)
k <- length(x[1,])
n <- length(x[,1])
x1 <- cbind(x[,par1], x[,1:k!=par1])
mycolnames <- c(colnames(x)[par1], colnames(x)[1:k!=par1])
colnames(x1) <- mycolnames #colnames(x)[par1]
x <- x1
if (par3 == 'First Differences'){
x2 <- array(0, dim=c(n-1,k), dimnames=list(1:(n-1), paste('(1-B)',colnames(x),sep='')))
for (i in 1:n-1) {
for (j in 1:k) {
x2[i,j] <- x[i+1,j] - x[i,j]
}
}
x <- x2
}
if (par2 == 'Include Monthly Dummies'){
x2 <- array(0, dim=c(n,11), dimnames=list(1:n, paste('M', seq(1:11), sep ='')))
for (i in 1:11){
x2[seq(i,n,12),i] <- 1
}
x <- cbind(x, x2)
}
if (par2 == 'Include Quarterly Dummies'){
x2 <- array(0, dim=c(n,3), dimnames=list(1:n, paste('Q', seq(1:3), sep ='')))
for (i in 1:3){
x2[seq(i,n,4),i] <- 1
}
x <- cbind(x, x2)
}
k <- length(x[1,])
if (par3 == 'Linear Trend'){
x <- cbind(x, c(1:n))
colnames(x)[k+1] <- 't'
}
x
k <- length(x[1,])
df <- as.data.frame(x)
(mylm <- lm(df))
(mysum <- summary(mylm))
if (n > n25) {
kp3 <- k + 3
nmkm3 <- n - k - 3
gqarr <- array(NA, dim=c(nmkm3-kp3+1,3))
numgqtests <- 0
numsignificant1 <- 0
numsignificant5 <- 0
numsignificant10 <- 0
for (mypoint in kp3:nmkm3) {
j <- 0
numgqtests <- numgqtests + 1
for (myalt in c('greater', 'two.sided', 'less')) {
j <- j + 1
gqarr[mypoint-kp3+1,j] <- gqtest(mylm, point=mypoint, alternative=myalt)$p.value
}
if (gqarr[mypoint-kp3+1,2] < 0.01) numsignificant1 <- numsignificant1 + 1
if (gqarr[mypoint-kp3+1,2] < 0.05) numsignificant5 <- numsignificant5 + 1
if (gqarr[mypoint-kp3+1,2] < 0.10) numsignificant10 <- numsignificant10 + 1
}
gqarr
}
bitmap(file='test0.png')
plot(x[,1], type='l', main='Actuals and Interpolation', ylab='value of Actuals and Interpolation (dots)', xlab='time or index')
points(x[,1]-mysum$resid)
grid()
dev.off()
bitmap(file='test1.png')
plot(mysum$resid, type='b', pch=19, main='Residuals', ylab='value of Residuals', xlab='time or index')
grid()
dev.off()
bitmap(file='test2.png')
hist(mysum$resid, main='Residual Histogram', xlab='values of Residuals')
grid()
dev.off()
bitmap(file='test3.png')
densityplot(~mysum$resid,col='black',main='Residual Density Plot', xlab='values of Residuals')
dev.off()
bitmap(file='test4.png')
qqnorm(mysum$resid, main='Residual Normal Q-Q Plot')
qqline(mysum$resid)
grid()
dev.off()
(myerror <- as.ts(mysum$resid))
bitmap(file='test5.png')
dum <- cbind(lag(myerror,k=1),myerror)
dum
dum1 <- dum[2:length(myerror),]
dum1
z <- as.data.frame(dum1)
z
plot(z,main=paste('Residual Lag plot, lowess, and regression line'), ylab='values of Residuals', xlab='lagged values of Residuals')
lines(lowess(z))
abline(lm(z))
grid()
dev.off()
bitmap(file='test6.png')
acf(mysum$resid, lag.max=length(mysum$resid)/2, main='Residual Autocorrelation Function')
grid()
dev.off()
bitmap(file='test7.png')
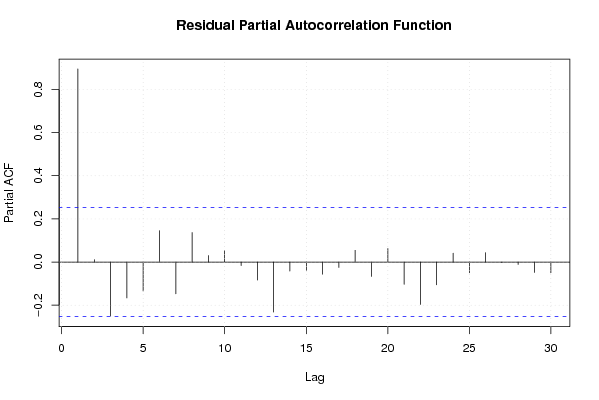
pacf(mysum$resid, lag.max=length(mysum$resid)/2, main='Residual Partial Autocorrelation Function')
grid()
dev.off()
bitmap(file='test8.png')
opar <- par(mfrow = c(2,2), oma = c(0, 0, 1.1, 0))
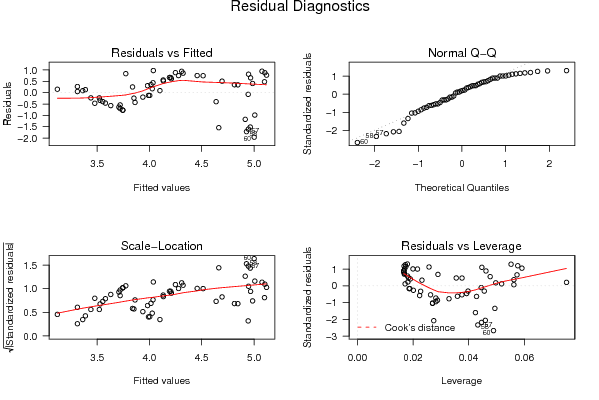
plot(mylm, las = 1, sub='Residual Diagnostics')
par(opar)
dev.off()
if (n > n25) {
bitmap(file='test9.png')
plot(kp3:nmkm3,gqarr[,2], main='Goldfeld-Quandt test',ylab='2-sided p-value',xlab='breakpoint')
grid()
dev.off()
}
load(file='createtable')
a<-table.start()
a<-table.row.start(a)
a<-table.element(a, 'Multiple Linear Regression - Estimated Regression Equation', 1, TRUE)
a<-table.row.end(a)
myeq <- colnames(x)[1]
myeq <- paste(myeq, '[t] = ', sep='')
for (i in 1:k){
if (mysum$coefficients[i,1] > 0) myeq <- paste(myeq, '+', '')
myeq <- paste(myeq, mysum$coefficients[i,1], sep=' ')
if (rownames(mysum$coefficients)[i] != '(Intercept)') {
myeq <- paste(myeq, rownames(mysum$coefficients)[i], sep='')
if (rownames(mysum$coefficients)[i] != 't') myeq <- paste(myeq, '[t]', sep='')
}
}
myeq <- paste(myeq, ' + e[t]')
a<-table.row.start(a)
a<-table.element(a, myeq)
a<-table.row.end(a)
a<-table.end(a)
table.save(a,file='mytable1.tab')
a<-table.start()
a<-table.row.start(a)
a<-table.element(a,hyperlink('ols1.htm','Multiple Linear Regression - Ordinary Least Squares',''), 6, TRUE)
a<-table.row.end(a)
a<-table.row.start(a)
a<-table.element(a,'Variable',header=TRUE)
a<-table.element(a,'Parameter',header=TRUE)
a<-table.element(a,'S.D.',header=TRUE)
a<-table.element(a,'T-STAT
H0: parameter = 0',header=TRUE)
a<-table.element(a,'2-tail p-value',header=TRUE)
a<-table.element(a,'1-tail p-value',header=TRUE)
a<-table.row.end(a)
for (i in 1:k){
a<-table.row.start(a)
a<-table.element(a,rownames(mysum$coefficients)[i],header=TRUE)
a<-table.element(a,mysum$coefficients[i,1])
a<-table.element(a, round(mysum$coefficients[i,2],6))
a<-table.element(a, round(mysum$coefficients[i,3],4))
a<-table.element(a, round(mysum$coefficients[i,4],6))
a<-table.element(a, round(mysum$coefficients[i,4]/2,6))
a<-table.row.end(a)
}
a<-table.end(a)
table.save(a,file='mytable2.tab')
a<-table.start()
a<-table.row.start(a)
a<-table.element(a, 'Multiple Linear Regression - Regression Statistics', 2, TRUE)
a<-table.row.end(a)
a<-table.row.start(a)
a<-table.element(a, 'Multiple R',1,TRUE)
a<-table.element(a, sqrt(mysum$r.squared))
a<-table.row.end(a)
a<-table.row.start(a)
a<-table.element(a, 'R-squared',1,TRUE)
a<-table.element(a, mysum$r.squared)
a<-table.row.end(a)
a<-table.row.start(a)
a<-table.element(a, 'Adjusted R-squared',1,TRUE)
a<-table.element(a, mysum$adj.r.squared)
a<-table.row.end(a)
a<-table.row.start(a)
a<-table.element(a, 'F-TEST (value)',1,TRUE)
a<-table.element(a, mysum$fstatistic[1])
a<-table.row.end(a)
a<-table.row.start(a)
a<-table.element(a, 'F-TEST (DF numerator)',1,TRUE)
a<-table.element(a, mysum$fstatistic[2])
a<-table.row.end(a)
a<-table.row.start(a)
a<-table.element(a, 'F-TEST (DF denominator)',1,TRUE)
a<-table.element(a, mysum$fstatistic[3])
a<-table.row.end(a)
a<-table.row.start(a)
a<-table.element(a, 'p-value',1,TRUE)
a<-table.element(a, 1-pf(mysum$fstatistic[1],mysum$fstatistic[2],mysum$fstatistic[3]))
a<-table.row.end(a)
a<-table.row.start(a)
a<-table.element(a, 'Multiple Linear Regression - Residual Statistics', 2, TRUE)
a<-table.row.end(a)
a<-table.row.start(a)
a<-table.element(a, 'Residual Standard Deviation',1,TRUE)
a<-table.element(a, mysum$sigma)
a<-table.row.end(a)
a<-table.row.start(a)
a<-table.element(a, 'Sum Squared Residuals',1,TRUE)
a<-table.element(a, sum(myerror*myerror))
a<-table.row.end(a)
a<-table.end(a)
table.save(a,file='mytable3.tab')
a<-table.start()
a<-table.row.start(a)
a<-table.element(a, 'Multiple Linear Regression - Actuals, Interpolation, and Residuals', 4, TRUE)
a<-table.row.end(a)
a<-table.row.start(a)
a<-table.element(a, 'Time or Index', 1, TRUE)
a<-table.element(a, 'Actuals', 1, TRUE)
a<-table.element(a, 'Interpolation
Forecast', 1, TRUE)
a<-table.element(a, 'Residuals
Prediction Error', 1, TRUE)
a<-table.row.end(a)
for (i in 1:n) {
a<-table.row.start(a)
a<-table.element(a,i, 1, TRUE)
a<-table.element(a,x[i])
a<-table.element(a,x[i]-mysum$resid[i])
a<-table.element(a,mysum$resid[i])
a<-table.row.end(a)
}
a<-table.end(a)
table.save(a,file='mytable4.tab')
if (n > n25) {
a<-table.start()
a<-table.row.start(a)
a<-table.element(a,'Goldfeld-Quandt test for Heteroskedasticity',4,TRUE)
a<-table.row.end(a)
a<-table.row.start(a)
a<-table.element(a,'p-values',header=TRUE)
a<-table.element(a,'Alternative Hypothesis',3,header=TRUE)
a<-table.row.end(a)
a<-table.row.start(a)
a<-table.element(a,'breakpoint index',header=TRUE)
a<-table.element(a,'greater',header=TRUE)
a<-table.element(a,'2-sided',header=TRUE)
a<-table.element(a,'less',header=TRUE)
a<-table.row.end(a)
for (mypoint in kp3:nmkm3) {
a<-table.row.start(a)
a<-table.element(a,mypoint,header=TRUE)
a<-table.element(a,gqarr[mypoint-kp3+1,1])
a<-table.element(a,gqarr[mypoint-kp3+1,2])
a<-table.element(a,gqarr[mypoint-kp3+1,3])
a<-table.row.end(a)
}
a<-table.end(a)
table.save(a,file='mytable5.tab')
a<-table.start()
a<-table.row.start(a)
a<-table.element(a,'Meta Analysis of Goldfeld-Quandt test for Heteroskedasticity',4,TRUE)
a<-table.row.end(a)
a<-table.row.start(a)
a<-table.element(a,'Description',header=TRUE)
a<-table.element(a,'# significant tests',header=TRUE)
a<-table.element(a,'% significant tests',header=TRUE)
a<-table.element(a,'OK/NOK',header=TRUE)
a<-table.row.end(a)
a<-table.row.start(a)
a<-table.element(a,'1% type I error level',header=TRUE)
a<-table.element(a,numsignificant1)
a<-table.element(a,numsignificant1/numgqtests)
if (numsignificant1/numgqtests < 0.01) dum <- 'OK' else dum <- 'NOK'
a<-table.element(a,dum)
a<-table.row.end(a)
a<-table.row.start(a)
a<-table.element(a,'5% type I error level',header=TRUE)
a<-table.element(a,numsignificant5)
a<-table.element(a,numsignificant5/numgqtests)
if (numsignificant5/numgqtests < 0.05) dum <- 'OK' else dum <- 'NOK'
a<-table.element(a,dum)
a<-table.row.end(a)
a<-table.row.start(a)
a<-table.element(a,'10% type I error level',header=TRUE)
a<-table.element(a,numsignificant10)
a<-table.element(a,numsignificant10/numgqtests)
if (numsignificant10/numgqtests < 0.1) dum <- 'OK' else dum <- 'NOK'
a<-table.element(a,dum)
a<-table.row.end(a)
a<-table.end(a)
table.save(a,file='mytable6.tab')
}