Free Statistics
of Irreproducible Research!
Description of Statistical Computation | |
|---|---|
| Author's title | |
| Author | *Unverified author* |
| R Software Module | Rscript (source code is shown below) |
| Title produced by software | R console |
| Date of computation | Thu, 18 Jun 2009 14:47:10 -0600 |
| Cite this page as follows | Statistical Computations at FreeStatistics.org, Office for Research Development and Education, URL https://freestatistics.org/blog/index.php?v=date/2009/Jun/18/t1245358031vkyoybapdcii0ve.htm/, Retrieved Sat, 05 Jul 2025 22:57:04 +0000 |
| Statistical Computations at FreeStatistics.org, Office for Research Development and Education, URL https://freestatistics.org/blog/index.php?pk=42283, Retrieved Sat, 05 Jul 2025 22:57:04 +0000 | |
| QR Codes: | |
|
| |
| Original text written by user: | |
| IsPrivate? | No (this computation is public) |
| User-defined keywords | |
| Estimated Impact | 309 |
Tree of Dependent Computations | |
| Family? (F = Feedback message, R = changed R code, M = changed R Module, P = changed Parameters, D = changed Data) | |
| - [R console] [test] [2009-06-18 20:47:10] [b768c7adc2675864c15627b87ad9ef22] [Current] | |
| Feedback Forum | |
Post a new message | |
Dataset | |
| Dataseries X: | |
-2.21686131272054 0.436924873832822 0.536221046852058 -1.12446156224984 -0.146346740524691 0.133353732604088 -1.05311405291439 0.136620324977649 -0.615921498582138 -0.307179548084307 -1.36557785453441 0.435983166369721 -0.251343481384201 -1.65459669154371 -0.396140494095178 0.62653305861636 -0.523688818676502 0.58874830522352 1.11111015672525 -1.21324308310744 -1.32201833003829 -0.486563551285418 1.41644296444173 -1.58326250304738 0.796553362103775 -0.87679324208547 0.0704013155103761 0.227416671060435 0.218988310084183 -0.757775361046955 1.32448731116851 -1.76323755122455 0.594856778140861 -0.583553183442127 -1.06411564052119 0.775328690865952 -1.10159013439544 1.39694303396182 0.239977244169336 -0.981463154491592 0.671822226396758 -1.54851726215511 -0.409903104832446 0.410741969611259 -1.14690954192442 0.259987542729689 0.221639340801693 -0.947086902245827 0.519881738499452 1.41272977645389 -1.74056256017052 -1.20384575283084 -1.26226993964613 -0.912930039250442 -1.2641470959937 0.377129726201078 1.02700764179978 1.72156803195665 -0.245336520240731 -0.906965934859977 0.953796119982406 0.363813227496903 -0.520855005275589 -1.41176001015545 -0.62569054456302 1.14425221647535 0.572012458804576 -0.387370930387689 -1.16534141592379 1.70140297126214 1.24256198344018 0.795206354229561 0.0937012942583232 -0.0533326383867486 -1.20678669347458 -0.266469472454353 -1.03584051550042 0.149144715601390 1.51398465401839 -0.171702525994035 -0.895617701248178 -0.485371143412611 -0.696121213499916 -0.627574764327205 0.0613399614131843 -0.0638447426287305 1.97634782169744 1.76216606955591 -0.71807078893805 2.26753426526638 -0.469801403769391 0.114170189336529 -1.91697121070736 -1.48630992436598 -0.245940157319954 -0.721704485621234 -0.342697632485391 0.857027297381981 2.06143247532333 0.617209983076268 | |
Tables (Output of Computation) | |
> first_number = 5
> second_number = 7
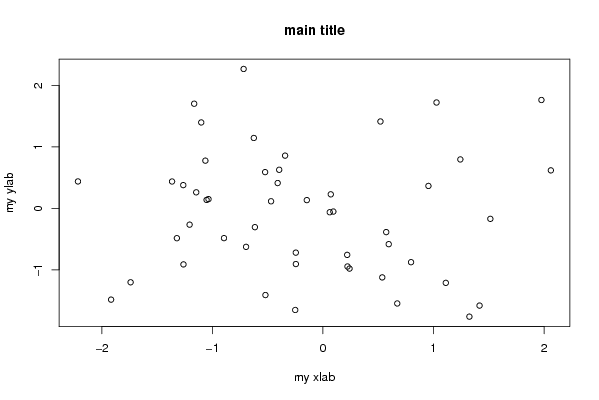
> strpar = 'main title'
> {
+ myfun <- function(x, y) {
+ x + y
+ }
+
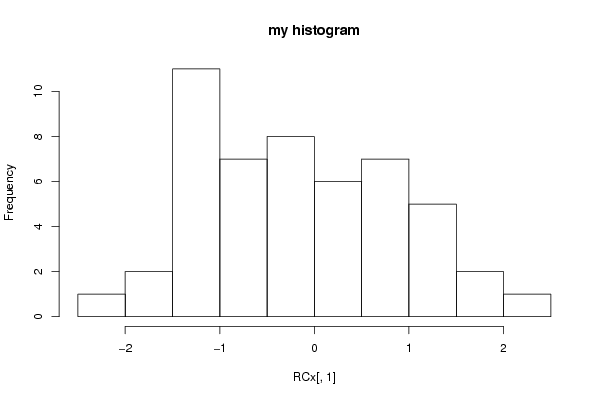
+ plot(RCx, main = strpar, xlab = 'my xlab', ylab = 'my ylab')
+ hist(R .... [TRUNCATED]
[1] 12
| |
Figures (Output of Computation) | |
Input Parameters & R Code | |
| Parameters (Session): | |
| par1 = 5 ; par2 = 7 ; par3 = maintitle ; | |
| Parameters (R input): | |
| R code (body of R function): | |
{ | |