| Multiple Linear Regression - Estimated Regression Equation |
| Enrol[t] = + 58.7578561581236 -0.0536291396091595Irr[t] -0.0378072341617618Mach[t] -0.00677597264230691Val[t] -0.570464946780196Exp[t] + 0.128149474300660San[t] + 0.633378330948962Lit[t] -0.0426406763956305Road[t] + e[t] |
| Multiple Linear Regression - Ordinary Least Squares | |||||
| Variable | Parameter | S.D. | T-STAT H0: parameter = 0 | 2-tail p-value | 1-tail p-value |
| (Intercept) | 58.7578561581236 | 11.65004 | 5.0436 | 2.1e-05 | 1e-05 |
| Irr | -0.0536291396091595 | 0.170869 | -0.3139 | 0.755799 | 0.3779 |
| Mach | -0.0378072341617618 | 0.072728 | -0.5198 | 0.606986 | 0.303493 |
| Val | -0.00677597264230691 | 0.01062 | -0.638 | 0.5283 | 0.26415 |
| Exp | -0.570464946780196 | 0.326293 | -1.7483 | 0.090637 | 0.045318 |
| San | 0.128149474300660 | 0.209944 | 0.6104 | 0.546195 | 0.273097 |
| Lit | 0.633378330948962 | 0.184593 | 3.4312 | 0.001772 | 0.000886 |
| Road | -0.0426406763956305 | 0.238806 | -0.1786 | 0.859485 | 0.429743 |
| Multiple Linear Regression - Regression Statistics | |
| Multiple R | 0.673547174765554 |
| R-squared | 0.45366579663466 |
| Adjusted R-squared | 0.326187815849414 |
| F-TEST (value) | 3.55877771078695 |
| F-TEST (DF numerator) | 7 |
| F-TEST (DF denominator) | 30 |
| p-value | 0.00666327090111318 |
| Multiple Linear Regression - Residual Statistics | |
| Residual Standard Deviation | 19.8100601062949 |
| Sum Squared Residuals | 11773.1544424505 |
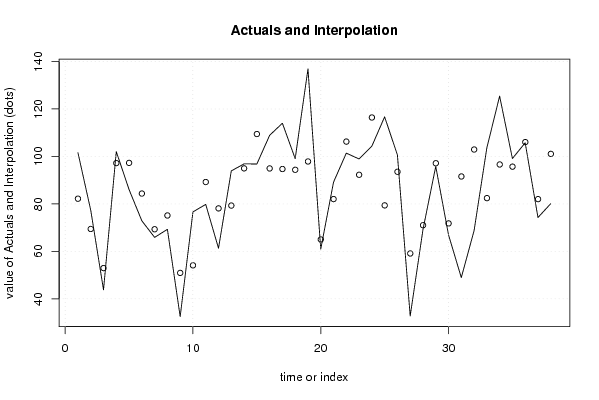
| Multiple Linear Regression - Actuals, Interpolation, and Residuals | |||
| Time or Index | Actuals | Interpolation Forecast | Residuals Prediction Error |
| 1 | 101.553223 | 82.1909838631884 | 19.3622391368116 |
| 2 | 77.35 | 69.4366875585058 | 7.91331244149423 |
| 3 | 43.81 | 52.954188965516 | -9.14418896551604 |
| 4 | 102.03 | 97.1976716164252 | 4.83232838357485 |
| 5 | 86.03 | 97.2757907318844 | -11.2457907318844 |
| 6 | 72.87 | 84.3614974500704 | -11.4914974500704 |
| 7 | 65.89 | 69.3155218017974 | -3.42552180179738 |
| 8 | 69.28 | 75.1227156020918 | -5.84271560209179 |
| 9 | 32.49 | 50.9242430524503 | -18.4342430524503 |
| 10 | 76.64 | 54.1145516493648 | 22.5254483506352 |
| 11 | 79.78 | 89.2209766934394 | -9.44097669343944 |
| 12 | 61.32 | 78.1086985123142 | -16.7886985123142 |
| 13 | 93.89 | 79.295526725884 | 14.5944732741160 |
| 14 | 96.87 | 94.9671940185574 | 1.90280598144265 |
| 15 | 96.81 | 109.440573528911 | -12.6305735289109 |
| 16 | 108.89 | 94.9400564817826 | 13.9499435182174 |
| 17 | 113.99 | 94.6965186472472 | 19.2934813527528 |
| 18 | 99.07 | 94.365935715656 | 4.70406428434405 |
| 19 | 136.86 | 97.8732293881342 | 38.9867706118658 |
| 20 | 60.91 | 65.0147129632899 | -4.10471296328989 |
| 21 | 89.14 | 82.033226165436 | 7.10677383456389 |
| 22 | 101.38 | 106.256712774102 | -4.87671277410237 |
| 23 | 98.94 | 92.2690409389571 | 6.67095906104285 |
| 24 | 104.32 | 116.403990535543 | -12.0839905355428 |
| 25 | 116.68 | 79.3753869527669 | 37.3046130472331 |
| 26 | 100.62 | 93.5353552575079 | 7.0846447424921 |
| 27 | 32.76 | 59.1125702690078 | -26.3525702690078 |
| 28 | 69.18 | 71.0242819917336 | -1.84428199173359 |
| 29 | 95.81 | 97.1356694559238 | -1.32566945592375 |
| 30 | 66.95 | 71.77903552601 | -4.82903552600995 |
| 31 | 48.95 | 91.5571006948781 | -42.6071006948781 |
| 32 | 68.73 | 102.911961302673 | -34.1819613026725 |
| 33 | 103.63 | 82.4327307669483 | 21.1972692330517 |
| 34 | 125.42 | 96.6128423727664 | 28.8071576272336 |
| 35 | 99.12 | 95.6910338586147 | 3.42896614138525 |
| 36 | 105.75 | 106.038307159421 | -0.288307159420816 |
| 37 | 74.26 | 82.0220278152853 | -7.76202781528534 |
| 38 | 80.11 | 101.074674195916 | -20.9646741959155 |
| Goldfeld-Quandt test for Heteroskedasticity | |||
| p-values | Alternative Hypothesis | ||
| breakpoint index | greater | 2-sided | less |
| 11 | 0.102544542692506 | 0.205089085385012 | 0.897455457307494 |
| 12 | 0.0727917281111342 | 0.145583456222268 | 0.927208271888866 |
| 13 | 0.0704695942600996 | 0.140939188520199 | 0.9295304057399 |
| 14 | 0.0646381259484203 | 0.129276251896841 | 0.93536187405158 |
| 15 | 0.143561901477979 | 0.287123802955958 | 0.856438098522021 |
| 16 | 0.111362004601392 | 0.222724009202783 | 0.888637995398608 |
| 17 | 0.148450487678625 | 0.296900975357249 | 0.851549512321375 |
| 18 | 0.089833347583056 | 0.179666695166112 | 0.910166652416944 |
| 19 | 0.208888732167372 | 0.417777464334745 | 0.791111267832628 |
| 20 | 0.260226596097727 | 0.520453192195453 | 0.739773403902273 |
| 21 | 0.184046408882169 | 0.368092817764338 | 0.815953591117831 |
| 22 | 0.118135959072772 | 0.236271918145545 | 0.881864040927228 |
| 23 | 0.363299060994133 | 0.726598121988265 | 0.636700939005867 |
| 24 | 0.4997694444462 | 0.9995388888924 | 0.5002305555538 |
| 25 | 0.534248267837791 | 0.931503464324418 | 0.465751732162209 |
| 26 | 0.797667470988761 | 0.404665058022478 | 0.202332529011239 |
| 27 | 0.683738261118427 | 0.632523477763146 | 0.316261738881573 |
| Meta Analysis of Goldfeld-Quandt test for Heteroskedasticity | |||
| Description | # significant tests | % significant tests | OK/NOK |
| 1% type I error level | 0 | 0 | OK |
| 5% type I error level | 0 | 0 | OK |
| 10% type I error level | 0 | 0 | OK |