Free Statistics

of Irreproducible Research!

Author's title

Author*Unverified author*
R Software Modulerwasp_exponentialsmoothing.wasp
Title produced by softwareExponential Smoothing
Date of computationSun, 07 Jun 2009 14:58:04 -0600
Cite this page as followsStatistical Computations at FreeStatistics.org, Office for Research Development and Education, URL https://freestatistics.org/blog/index.php?v=date/2009/Jun/07/t1244408319eqif0m8hy1v2lvq.htm/, Retrieved Sun, 12 May 2024 20:29:27 +0000
Statistical Computations at FreeStatistics.org, Office for Research Development and Education, URL https://freestatistics.org/blog/index.php?pk=42268, Retrieved Sun, 12 May 2024 20:29:27 +0000
QR Codes:

Original text written by user:
IsPrivate?No (this computation is public)
User-defined keywords
Estimated Impact100
Family? (F = Feedback message, R = changed R code, M = changed R Module, P = changed Parameters, D = changed Data)
-       [Exponential Smoothing] [exponential smoot...] [2009-06-07 20:58:04] [d41d8cd98f00b204e9800998ecf8427e] [Current]
Feedback Forum

Post a new message
Dataseries X:
517
540
454
292
445
483
545
355
370
372
422
445
471
413
307
308
389
377
521
420
413
384
466
434
263
334
334
416
309
334
350
337
277
439
433
455
372
409
471
382
417
405
410
357
360
329
359
393
448
593
535
449
742
631
513
526
677
631
547
533
433
427
470
418
485
464
439
452
423
537
384
380


Summary of computational transaction
Raw Inputview raw input (R code)
Raw Outputview raw output of R engine
Computing time2 seconds
R Server'George Udny Yule' @ 72.249.76.132

\begin{tabular}{lllllllll}
\hline
Summary of computational transaction \tabularnewline
Raw Input & view raw input (R code)  \tabularnewline
Raw Output & view raw output of R engine  \tabularnewline
Computing time & 2 seconds \tabularnewline
R Server & 'George Udny Yule' @ 72.249.76.132 \tabularnewline
\hline
\end{tabular}
%Source: https://freestatistics.org/blog/index.php?pk=42268&T=0

[TABLE]
[ROW][C]Summary of computational transaction[/C][/ROW]
[ROW][C]Raw Input[/C][C]view raw input (R code) [/C][/ROW]
[ROW][C]Raw Output[/C][C]view raw output of R engine [/C][/ROW]
[ROW][C]Computing time[/C][C]2 seconds[/C][/ROW]
[ROW][C]R Server[/C][C]'George Udny Yule' @ 72.249.76.132[/C][/ROW]
[/TABLE]
Source: https://freestatistics.org/blog/index.php?pk=42268&T=0

Globally Unique Identifier (entire table): ba.freestatistics.org/blog/index.php?pk=42268&T=0

As an alternative you can also use a QR Code:  

The GUIDs for individual cells are displayed in the table below:

Summary of computational transaction
Raw Inputview raw input (R code)
Raw Outputview raw output of R engine
Computing time2 seconds
R Server'George Udny Yule' @ 72.249.76.132


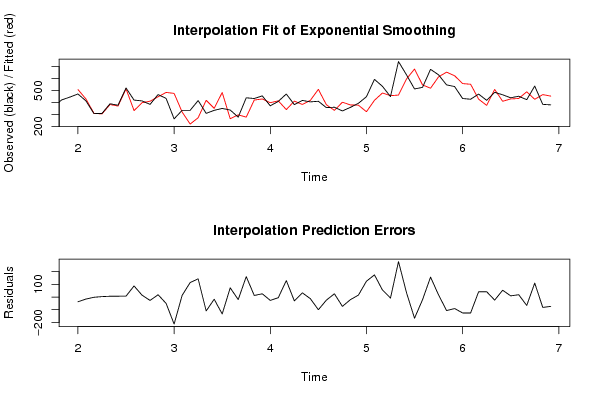
Estimated Parameters of Exponential Smoothing
ParameterValue
alpha0.475951406937993
beta0
gamma0.691257448858544

\begin{tabular}{lllllllll}
\hline
Estimated Parameters of Exponential Smoothing \tabularnewline
Parameter & Value \tabularnewline
alpha & 0.475951406937993 \tabularnewline
beta & 0 \tabularnewline
gamma & 0.691257448858544 \tabularnewline
\hline
\end{tabular}
%Source: https://freestatistics.org/blog/index.php?pk=42268&T=1

[TABLE]
[ROW][C]Estimated Parameters of Exponential Smoothing[/C][/ROW]
[ROW][C]Parameter[/C][C]Value[/C][/ROW]
[ROW][C]alpha[/C][C]0.475951406937993[/C][/ROW]
[ROW][C]beta[/C][C]0[/C][/ROW]
[ROW][C]gamma[/C][C]0.691257448858544[/C][/ROW]
[/TABLE]
Source: https://freestatistics.org/blog/index.php?pk=42268&T=1

Globally Unique Identifier (entire table): ba.freestatistics.org/blog/index.php?pk=42268&T=1

As an alternative you can also use a QR Code:  

The GUIDs for individual cells are displayed in the table below:

Estimated Parameters of Exponential Smoothing
ParameterValue
alpha0.475951406937993
beta0
gamma0.691257448858544


Interpolation Forecasts of Exponential Smoothing
tObservedFittedResiduals
13471508.236912393163-37.2369123931626
14413428.665321013479-15.6653210134794
15307308.569092234181-1.56909223418131
16308304.3903167082433.60968329175660
17389382.6347200134256.36527998657505
18377370.1489867757926.85101322420769
19521513.5611056226747.43889437732582
20420332.16969399816287.8303060018383
21413398.249021175414.7509788245996
22384410.587806431217-26.5878064312172
23466447.45967201675418.5403279832462
24434483.893670002675-49.8936700026745
25263475.933912666138-212.933912666138
26334320.55344957818813.4465504218119
27334219.419450991615114.580549008385
28416272.398284978060143.601715021940
29309418.270314519158-109.270314519158
30334350.923615460928-16.9236154609276
31350483.2331277493-133.233127749300
32337264.01065859521572.9893414047847
33277296.553239297600-19.5532392976005
34439277.589805636326161.410194363674
35433420.28736342117312.7126365788266
36455429.15727707215825.8427229278421
37372398.182628058698-26.1826280586980
38409413.693588864495-4.69358886449515
39471340.56180862998130.438191370020
40382411.601099562374-29.6010995623738
41417383.4334825742433.5665174257604
42405417.522996644755-12.5229966447546
43410509.793578803763-99.7935788037627
44357381.191313688174-24.1913136881745
45360333.95684425588526.0431557441154
46329402.249534045382-73.2495340453822
47359379.394402854661-20.3944028546613
48393377.26338102776215.7366189722375
49448322.63240449695125.367595503050
50593418.058365460134174.941634539866
51535479.37604688401855.6239531159819
52449456.832763659304-7.83276365930368
53742461.908443534473280.091556465527
54631596.63585538433434.3641446156662
55513679.608452395675-166.608452395675
56526546.592663243359-20.5926632433593
57677519.268538365756157.731461634244
58631614.26943815659116.7305618434092
59547653.387363269613-106.387363269613
60533623.4164236966-90.4164236966004
61433557.975851771901-124.975851771901
62427552.208816041707-125.208816041707
63470427.44634060163742.5536593983634
64418375.69487881061942.3051211893809
65485508.935058430096-23.9350584300960
66464409.94520750546554.0547924945351
67439429.4867716821389.51322831786217
68452433.19092797113218.8090720288681
69423489.218473323462-66.2184733234618
70537426.55215895110.447841050000
71384465.675179586851-81.6751795868508
72380453.251551290307-73.2515512903074

\begin{tabular}{lllllllll}
\hline
Interpolation Forecasts of Exponential Smoothing \tabularnewline
t & Observed & Fitted & Residuals \tabularnewline
13 & 471 & 508.236912393163 & -37.2369123931626 \tabularnewline
14 & 413 & 428.665321013479 & -15.6653210134794 \tabularnewline
15 & 307 & 308.569092234181 & -1.56909223418131 \tabularnewline
16 & 308 & 304.390316708243 & 3.60968329175660 \tabularnewline
17 & 389 & 382.634720013425 & 6.36527998657505 \tabularnewline
18 & 377 & 370.148986775792 & 6.85101322420769 \tabularnewline
19 & 521 & 513.561105622674 & 7.43889437732582 \tabularnewline
20 & 420 & 332.169693998162 & 87.8303060018383 \tabularnewline
21 & 413 & 398.2490211754 & 14.7509788245996 \tabularnewline
22 & 384 & 410.587806431217 & -26.5878064312172 \tabularnewline
23 & 466 & 447.459672016754 & 18.5403279832462 \tabularnewline
24 & 434 & 483.893670002675 & -49.8936700026745 \tabularnewline
25 & 263 & 475.933912666138 & -212.933912666138 \tabularnewline
26 & 334 & 320.553449578188 & 13.4465504218119 \tabularnewline
27 & 334 & 219.419450991615 & 114.580549008385 \tabularnewline
28 & 416 & 272.398284978060 & 143.601715021940 \tabularnewline
29 & 309 & 418.270314519158 & -109.270314519158 \tabularnewline
30 & 334 & 350.923615460928 & -16.9236154609276 \tabularnewline
31 & 350 & 483.2331277493 & -133.233127749300 \tabularnewline
32 & 337 & 264.010658595215 & 72.9893414047847 \tabularnewline
33 & 277 & 296.553239297600 & -19.5532392976005 \tabularnewline
34 & 439 & 277.589805636326 & 161.410194363674 \tabularnewline
35 & 433 & 420.287363421173 & 12.7126365788266 \tabularnewline
36 & 455 & 429.157277072158 & 25.8427229278421 \tabularnewline
37 & 372 & 398.182628058698 & -26.1826280586980 \tabularnewline
38 & 409 & 413.693588864495 & -4.69358886449515 \tabularnewline
39 & 471 & 340.56180862998 & 130.438191370020 \tabularnewline
40 & 382 & 411.601099562374 & -29.6010995623738 \tabularnewline
41 & 417 & 383.43348257424 & 33.5665174257604 \tabularnewline
42 & 405 & 417.522996644755 & -12.5229966447546 \tabularnewline
43 & 410 & 509.793578803763 & -99.7935788037627 \tabularnewline
44 & 357 & 381.191313688174 & -24.1913136881745 \tabularnewline
45 & 360 & 333.956844255885 & 26.0431557441154 \tabularnewline
46 & 329 & 402.249534045382 & -73.2495340453822 \tabularnewline
47 & 359 & 379.394402854661 & -20.3944028546613 \tabularnewline
48 & 393 & 377.263381027762 & 15.7366189722375 \tabularnewline
49 & 448 & 322.63240449695 & 125.367595503050 \tabularnewline
50 & 593 & 418.058365460134 & 174.941634539866 \tabularnewline
51 & 535 & 479.376046884018 & 55.6239531159819 \tabularnewline
52 & 449 & 456.832763659304 & -7.83276365930368 \tabularnewline
53 & 742 & 461.908443534473 & 280.091556465527 \tabularnewline
54 & 631 & 596.635855384334 & 34.3641446156662 \tabularnewline
55 & 513 & 679.608452395675 & -166.608452395675 \tabularnewline
56 & 526 & 546.592663243359 & -20.5926632433593 \tabularnewline
57 & 677 & 519.268538365756 & 157.731461634244 \tabularnewline
58 & 631 & 614.269438156591 & 16.7305618434092 \tabularnewline
59 & 547 & 653.387363269613 & -106.387363269613 \tabularnewline
60 & 533 & 623.4164236966 & -90.4164236966004 \tabularnewline
61 & 433 & 557.975851771901 & -124.975851771901 \tabularnewline
62 & 427 & 552.208816041707 & -125.208816041707 \tabularnewline
63 & 470 & 427.446340601637 & 42.5536593983634 \tabularnewline
64 & 418 & 375.694878810619 & 42.3051211893809 \tabularnewline
65 & 485 & 508.935058430096 & -23.9350584300960 \tabularnewline
66 & 464 & 409.945207505465 & 54.0547924945351 \tabularnewline
67 & 439 & 429.486771682138 & 9.51322831786217 \tabularnewline
68 & 452 & 433.190927971132 & 18.8090720288681 \tabularnewline
69 & 423 & 489.218473323462 & -66.2184733234618 \tabularnewline
70 & 537 & 426.55215895 & 110.447841050000 \tabularnewline
71 & 384 & 465.675179586851 & -81.6751795868508 \tabularnewline
72 & 380 & 453.251551290307 & -73.2515512903074 \tabularnewline
\hline
\end{tabular}
%Source: https://freestatistics.org/blog/index.php?pk=42268&T=2

[TABLE]
[ROW][C]Interpolation Forecasts of Exponential Smoothing[/C][/ROW]
[ROW][C]t[/C][C]Observed[/C][C]Fitted[/C][C]Residuals[/C][/ROW]
[ROW][C]13[/C][C]471[/C][C]508.236912393163[/C][C]-37.2369123931626[/C][/ROW]
[ROW][C]14[/C][C]413[/C][C]428.665321013479[/C][C]-15.6653210134794[/C][/ROW]
[ROW][C]15[/C][C]307[/C][C]308.569092234181[/C][C]-1.56909223418131[/C][/ROW]
[ROW][C]16[/C][C]308[/C][C]304.390316708243[/C][C]3.60968329175660[/C][/ROW]
[ROW][C]17[/C][C]389[/C][C]382.634720013425[/C][C]6.36527998657505[/C][/ROW]
[ROW][C]18[/C][C]377[/C][C]370.148986775792[/C][C]6.85101322420769[/C][/ROW]
[ROW][C]19[/C][C]521[/C][C]513.561105622674[/C][C]7.43889437732582[/C][/ROW]
[ROW][C]20[/C][C]420[/C][C]332.169693998162[/C][C]87.8303060018383[/C][/ROW]
[ROW][C]21[/C][C]413[/C][C]398.2490211754[/C][C]14.7509788245996[/C][/ROW]
[ROW][C]22[/C][C]384[/C][C]410.587806431217[/C][C]-26.5878064312172[/C][/ROW]
[ROW][C]23[/C][C]466[/C][C]447.459672016754[/C][C]18.5403279832462[/C][/ROW]
[ROW][C]24[/C][C]434[/C][C]483.893670002675[/C][C]-49.8936700026745[/C][/ROW]
[ROW][C]25[/C][C]263[/C][C]475.933912666138[/C][C]-212.933912666138[/C][/ROW]
[ROW][C]26[/C][C]334[/C][C]320.553449578188[/C][C]13.4465504218119[/C][/ROW]
[ROW][C]27[/C][C]334[/C][C]219.419450991615[/C][C]114.580549008385[/C][/ROW]
[ROW][C]28[/C][C]416[/C][C]272.398284978060[/C][C]143.601715021940[/C][/ROW]
[ROW][C]29[/C][C]309[/C][C]418.270314519158[/C][C]-109.270314519158[/C][/ROW]
[ROW][C]30[/C][C]334[/C][C]350.923615460928[/C][C]-16.9236154609276[/C][/ROW]
[ROW][C]31[/C][C]350[/C][C]483.2331277493[/C][C]-133.233127749300[/C][/ROW]
[ROW][C]32[/C][C]337[/C][C]264.010658595215[/C][C]72.9893414047847[/C][/ROW]
[ROW][C]33[/C][C]277[/C][C]296.553239297600[/C][C]-19.5532392976005[/C][/ROW]
[ROW][C]34[/C][C]439[/C][C]277.589805636326[/C][C]161.410194363674[/C][/ROW]
[ROW][C]35[/C][C]433[/C][C]420.287363421173[/C][C]12.7126365788266[/C][/ROW]
[ROW][C]36[/C][C]455[/C][C]429.157277072158[/C][C]25.8427229278421[/C][/ROW]
[ROW][C]37[/C][C]372[/C][C]398.182628058698[/C][C]-26.1826280586980[/C][/ROW]
[ROW][C]38[/C][C]409[/C][C]413.693588864495[/C][C]-4.69358886449515[/C][/ROW]
[ROW][C]39[/C][C]471[/C][C]340.56180862998[/C][C]130.438191370020[/C][/ROW]
[ROW][C]40[/C][C]382[/C][C]411.601099562374[/C][C]-29.6010995623738[/C][/ROW]
[ROW][C]41[/C][C]417[/C][C]383.43348257424[/C][C]33.5665174257604[/C][/ROW]
[ROW][C]42[/C][C]405[/C][C]417.522996644755[/C][C]-12.5229966447546[/C][/ROW]
[ROW][C]43[/C][C]410[/C][C]509.793578803763[/C][C]-99.7935788037627[/C][/ROW]
[ROW][C]44[/C][C]357[/C][C]381.191313688174[/C][C]-24.1913136881745[/C][/ROW]
[ROW][C]45[/C][C]360[/C][C]333.956844255885[/C][C]26.0431557441154[/C][/ROW]
[ROW][C]46[/C][C]329[/C][C]402.249534045382[/C][C]-73.2495340453822[/C][/ROW]
[ROW][C]47[/C][C]359[/C][C]379.394402854661[/C][C]-20.3944028546613[/C][/ROW]
[ROW][C]48[/C][C]393[/C][C]377.263381027762[/C][C]15.7366189722375[/C][/ROW]
[ROW][C]49[/C][C]448[/C][C]322.63240449695[/C][C]125.367595503050[/C][/ROW]
[ROW][C]50[/C][C]593[/C][C]418.058365460134[/C][C]174.941634539866[/C][/ROW]
[ROW][C]51[/C][C]535[/C][C]479.376046884018[/C][C]55.6239531159819[/C][/ROW]
[ROW][C]52[/C][C]449[/C][C]456.832763659304[/C][C]-7.83276365930368[/C][/ROW]
[ROW][C]53[/C][C]742[/C][C]461.908443534473[/C][C]280.091556465527[/C][/ROW]
[ROW][C]54[/C][C]631[/C][C]596.635855384334[/C][C]34.3641446156662[/C][/ROW]
[ROW][C]55[/C][C]513[/C][C]679.608452395675[/C][C]-166.608452395675[/C][/ROW]
[ROW][C]56[/C][C]526[/C][C]546.592663243359[/C][C]-20.5926632433593[/C][/ROW]
[ROW][C]57[/C][C]677[/C][C]519.268538365756[/C][C]157.731461634244[/C][/ROW]
[ROW][C]58[/C][C]631[/C][C]614.269438156591[/C][C]16.7305618434092[/C][/ROW]
[ROW][C]59[/C][C]547[/C][C]653.387363269613[/C][C]-106.387363269613[/C][/ROW]
[ROW][C]60[/C][C]533[/C][C]623.4164236966[/C][C]-90.4164236966004[/C][/ROW]
[ROW][C]61[/C][C]433[/C][C]557.975851771901[/C][C]-124.975851771901[/C][/ROW]
[ROW][C]62[/C][C]427[/C][C]552.208816041707[/C][C]-125.208816041707[/C][/ROW]
[ROW][C]63[/C][C]470[/C][C]427.446340601637[/C][C]42.5536593983634[/C][/ROW]
[ROW][C]64[/C][C]418[/C][C]375.694878810619[/C][C]42.3051211893809[/C][/ROW]
[ROW][C]65[/C][C]485[/C][C]508.935058430096[/C][C]-23.9350584300960[/C][/ROW]
[ROW][C]66[/C][C]464[/C][C]409.945207505465[/C][C]54.0547924945351[/C][/ROW]
[ROW][C]67[/C][C]439[/C][C]429.486771682138[/C][C]9.51322831786217[/C][/ROW]
[ROW][C]68[/C][C]452[/C][C]433.190927971132[/C][C]18.8090720288681[/C][/ROW]
[ROW][C]69[/C][C]423[/C][C]489.218473323462[/C][C]-66.2184733234618[/C][/ROW]
[ROW][C]70[/C][C]537[/C][C]426.55215895[/C][C]110.447841050000[/C][/ROW]
[ROW][C]71[/C][C]384[/C][C]465.675179586851[/C][C]-81.6751795868508[/C][/ROW]
[ROW][C]72[/C][C]380[/C][C]453.251551290307[/C][C]-73.2515512903074[/C][/ROW]
[/TABLE]
Source: https://freestatistics.org/blog/index.php?pk=42268&T=2

Globally Unique Identifier (entire table): ba.freestatistics.org/blog/index.php?pk=42268&T=2

As an alternative you can also use a QR Code:  

The GUIDs for individual cells are displayed in the table below:

Interpolation Forecasts of Exponential Smoothing
tObservedFittedResiduals
13471508.236912393163-37.2369123931626
14413428.665321013479-15.6653210134794
15307308.569092234181-1.56909223418131
16308304.3903167082433.60968329175660
17389382.6347200134256.36527998657505
18377370.1489867757926.85101322420769
19521513.5611056226747.43889437732582
20420332.16969399816287.8303060018383
21413398.249021175414.7509788245996
22384410.587806431217-26.5878064312172
23466447.45967201675418.5403279832462
24434483.893670002675-49.8936700026745
25263475.933912666138-212.933912666138
26334320.55344957818813.4465504218119
27334219.419450991615114.580549008385
28416272.398284978060143.601715021940
29309418.270314519158-109.270314519158
30334350.923615460928-16.9236154609276
31350483.2331277493-133.233127749300
32337264.01065859521572.9893414047847
33277296.553239297600-19.5532392976005
34439277.589805636326161.410194363674
35433420.28736342117312.7126365788266
36455429.15727707215825.8427229278421
37372398.182628058698-26.1826280586980
38409413.693588864495-4.69358886449515
39471340.56180862998130.438191370020
40382411.601099562374-29.6010995623738
41417383.4334825742433.5665174257604
42405417.522996644755-12.5229966447546
43410509.793578803763-99.7935788037627
44357381.191313688174-24.1913136881745
45360333.95684425588526.0431557441154
46329402.249534045382-73.2495340453822
47359379.394402854661-20.3944028546613
48393377.26338102776215.7366189722375
49448322.63240449695125.367595503050
50593418.058365460134174.941634539866
51535479.37604688401855.6239531159819
52449456.832763659304-7.83276365930368
53742461.908443534473280.091556465527
54631596.63585538433434.3641446156662
55513679.608452395675-166.608452395675
56526546.592663243359-20.5926632433593
57677519.268538365756157.731461634244
58631614.26943815659116.7305618434092
59547653.387363269613-106.387363269613
60533623.4164236966-90.4164236966004
61433557.975851771901-124.975851771901
62427552.208816041707-125.208816041707
63470427.44634060163742.5536593983634
64418375.69487881061942.3051211893809
65485508.935058430096-23.9350584300960
66464409.94520750546554.0547924945351
67439429.4867716821389.51322831786217
68452433.19092797113218.8090720288681
69423489.218473323462-66.2184733234618
70537426.55215895110.447841050000
71384465.675179586851-81.6751795868508
72380453.251551290307-73.2515512903074


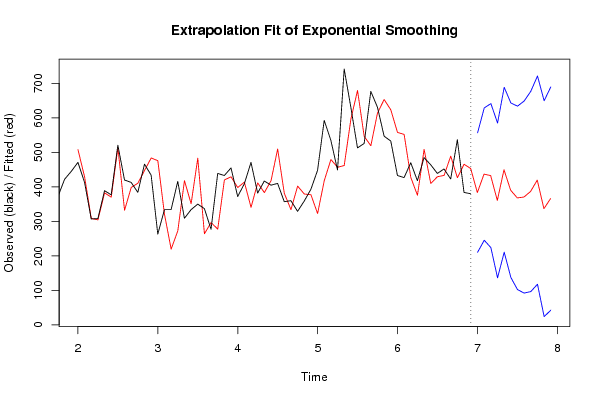
Extrapolation Forecasts of Exponential Smoothing
tForecast95% Lower Bound95% Upper Bound
73383.461385542462210.240425497985556.682345586939
74437.092390408741245.252250209825628.932530607657
75432.695602171671223.890004104116641.501200239226
76360.600632733704136.108057851685585.093207615722
77449.70996016418210.557175171054688.862745157306
78390.364051941037137.399246162096643.328857719979
79368.042868890005101.982102606085634.103635173926
80370.58663334025692.0449492992551649.128317381256
81386.86053407565696.3736873145569677.347380836754
82419.708808148194117.748965563099721.66865073329
83336.66698015613423.6543846798093649.679575632458
84366.16824885075642.4800913293010689.856406372212

\begin{tabular}{lllllllll}
\hline
Extrapolation Forecasts of Exponential Smoothing \tabularnewline
t & Forecast & 95% Lower Bound & 95% Upper Bound \tabularnewline
73 & 383.461385542462 & 210.240425497985 & 556.682345586939 \tabularnewline
74 & 437.092390408741 & 245.252250209825 & 628.932530607657 \tabularnewline
75 & 432.695602171671 & 223.890004104116 & 641.501200239226 \tabularnewline
76 & 360.600632733704 & 136.108057851685 & 585.093207615722 \tabularnewline
77 & 449.70996016418 & 210.557175171054 & 688.862745157306 \tabularnewline
78 & 390.364051941037 & 137.399246162096 & 643.328857719979 \tabularnewline
79 & 368.042868890005 & 101.982102606085 & 634.103635173926 \tabularnewline
80 & 370.586633340256 & 92.0449492992551 & 649.128317381256 \tabularnewline
81 & 386.860534075656 & 96.3736873145569 & 677.347380836754 \tabularnewline
82 & 419.708808148194 & 117.748965563099 & 721.66865073329 \tabularnewline
83 & 336.666980156134 & 23.6543846798093 & 649.679575632458 \tabularnewline
84 & 366.168248850756 & 42.4800913293010 & 689.856406372212 \tabularnewline
\hline
\end{tabular}
%Source: https://freestatistics.org/blog/index.php?pk=42268&T=3

[TABLE]
[ROW][C]Extrapolation Forecasts of Exponential Smoothing[/C][/ROW]
[ROW][C]t[/C][C]Forecast[/C][C]95% Lower Bound[/C][C]95% Upper Bound[/C][/ROW]
[ROW][C]73[/C][C]383.461385542462[/C][C]210.240425497985[/C][C]556.682345586939[/C][/ROW]
[ROW][C]74[/C][C]437.092390408741[/C][C]245.252250209825[/C][C]628.932530607657[/C][/ROW]
[ROW][C]75[/C][C]432.695602171671[/C][C]223.890004104116[/C][C]641.501200239226[/C][/ROW]
[ROW][C]76[/C][C]360.600632733704[/C][C]136.108057851685[/C][C]585.093207615722[/C][/ROW]
[ROW][C]77[/C][C]449.70996016418[/C][C]210.557175171054[/C][C]688.862745157306[/C][/ROW]
[ROW][C]78[/C][C]390.364051941037[/C][C]137.399246162096[/C][C]643.328857719979[/C][/ROW]
[ROW][C]79[/C][C]368.042868890005[/C][C]101.982102606085[/C][C]634.103635173926[/C][/ROW]
[ROW][C]80[/C][C]370.586633340256[/C][C]92.0449492992551[/C][C]649.128317381256[/C][/ROW]
[ROW][C]81[/C][C]386.860534075656[/C][C]96.3736873145569[/C][C]677.347380836754[/C][/ROW]
[ROW][C]82[/C][C]419.708808148194[/C][C]117.748965563099[/C][C]721.66865073329[/C][/ROW]
[ROW][C]83[/C][C]336.666980156134[/C][C]23.6543846798093[/C][C]649.679575632458[/C][/ROW]
[ROW][C]84[/C][C]366.168248850756[/C][C]42.4800913293010[/C][C]689.856406372212[/C][/ROW]
[/TABLE]
Source: https://freestatistics.org/blog/index.php?pk=42268&T=3

Globally Unique Identifier (entire table): ba.freestatistics.org/blog/index.php?pk=42268&T=3

As an alternative you can also use a QR Code:  

The GUIDs for individual cells are displayed in the table below:

Extrapolation Forecasts of Exponential Smoothing
tForecast95% Lower Bound95% Upper Bound
73383.461385542462210.240425497985556.682345586939
74437.092390408741245.252250209825628.932530607657
75432.695602171671223.890004104116641.501200239226
76360.600632733704136.108057851685585.093207615722
77449.70996016418210.557175171054688.862745157306
78390.364051941037137.399246162096643.328857719979
79368.042868890005101.982102606085634.103635173926
80370.58663334025692.0449492992551649.128317381256
81386.86053407565696.3736873145569677.347380836754
82419.708808148194117.748965563099721.66865073329
83336.66698015613423.6543846798093649.679575632458
84366.16824885075642.4800913293010689.856406372212


Parameters (Session):
par1 = 12 ; par2 = Triple ; par3 = additive ;
Parameters (R input):
par1 = 12 ; par2 = Triple ; par3 = additive ;
R code (references can be found in the software module):
par1 <- as.numeric(par1)
if (par2 == 'Single') K <- 1
if (par2 == 'Double') K <- 2
if (par2 == 'Triple') K <- par1
nx <- length(x)
nxmK <- nx - K
x <- ts(x, frequency = par1)
if (par2 == 'Single') fit <- HoltWinters(x, gamma=0, beta=0)
if (par2 == 'Double') fit <- HoltWinters(x, gamma=0)
if (par2 == 'Triple') fit <- HoltWinters(x, seasonal=par3)
fit
myresid <- x - fit$fitted[,'xhat']
bitmap(file='test1.png')
op <- par(mfrow=c(2,1))
plot(fit,ylab='Observed (black) / Fitted (red)',main='Interpolation Fit of Exponential Smoothing')
plot(myresid,ylab='Residuals',main='Interpolation Prediction Errors')
par(op)
dev.off()
bitmap(file='test2.png')
p <- predict(fit, par1, prediction.interval=TRUE)
np <- length(p[,1])
plot(fit,p,ylab='Observed (black) / Fitted (red)',main='Extrapolation Fit of Exponential Smoothing')
dev.off()
bitmap(file='test3.png')
op <- par(mfrow = c(2,2))
acf(as.numeric(myresid),lag.max = nx/2,main='Residual ACF')
spectrum(myresid,main='Residals Periodogram')
cpgram(myresid,main='Residal Cumulative Periodogram')
qqnorm(myresid,main='Residual Normal QQ Plot')
qqline(myresid)
par(op)
dev.off()
load(file='createtable')
a<-table.start()
a<-table.row.start(a)
a<-table.element(a,'Estimated Parameters of Exponential Smoothing',2,TRUE)
a<-table.row.end(a)
a<-table.row.start(a)
a<-table.element(a,'Parameter',header=TRUE)
a<-table.element(a,'Value',header=TRUE)
a<-table.row.end(a)
a<-table.row.start(a)
a<-table.element(a,'alpha',header=TRUE)
a<-table.element(a,fit$alpha)
a<-table.row.end(a)
a<-table.row.start(a)
a<-table.element(a,'beta',header=TRUE)
a<-table.element(a,fit$beta)
a<-table.row.end(a)
a<-table.row.start(a)
a<-table.element(a,'gamma',header=TRUE)
a<-table.element(a,fit$gamma)
a<-table.row.end(a)
a<-table.end(a)
table.save(a,file='mytable.tab')
a<-table.start()
a<-table.row.start(a)
a<-table.element(a,'Interpolation Forecasts of Exponential Smoothing',4,TRUE)
a<-table.row.end(a)
a<-table.row.start(a)
a<-table.element(a,'t',header=TRUE)
a<-table.element(a,'Observed',header=TRUE)
a<-table.element(a,'Fitted',header=TRUE)
a<-table.element(a,'Residuals',header=TRUE)
a<-table.row.end(a)
for (i in 1:nxmK) {
a<-table.row.start(a)
a<-table.element(a,i+K,header=TRUE)
a<-table.element(a,x[i+K])
a<-table.element(a,fit$fitted[i,'xhat'])
a<-table.element(a,myresid[i])
a<-table.row.end(a)
}
a<-table.end(a)
table.save(a,file='mytable1.tab')
a<-table.start()
a<-table.row.start(a)
a<-table.element(a,'Extrapolation Forecasts of Exponential Smoothing',4,TRUE)
a<-table.row.end(a)
a<-table.row.start(a)
a<-table.element(a,'t',header=TRUE)
a<-table.element(a,'Forecast',header=TRUE)
a<-table.element(a,'95% Lower Bound',header=TRUE)
a<-table.element(a,'95% Upper Bound',header=TRUE)
a<-table.row.end(a)
for (i in 1:np) {
a<-table.row.start(a)
a<-table.element(a,nx+i,header=TRUE)
a<-table.element(a,p[i,'fit'])
a<-table.element(a,p[i,'lwr'])
a<-table.element(a,p[i,'upr'])
a<-table.row.end(a)
}
a<-table.end(a)
table.save(a,file='mytable2.tab')