Free Statistics

of Irreproducible Research!

Author's title

Author*Unverified author*
R Software Modulerwasp_sdplot.wasp
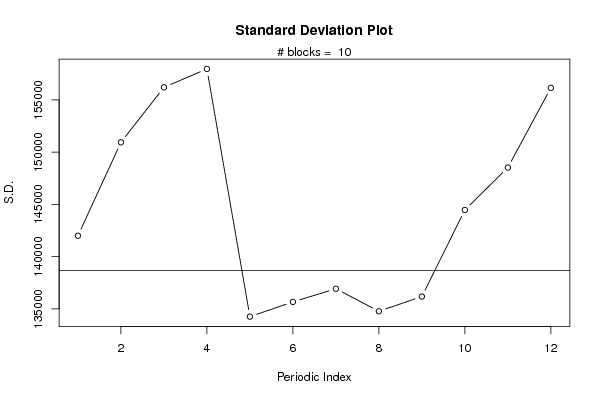
Title produced by softwareStandard Deviation Plot
Date of computationSun, 07 Jun 2009 14:25:03 -0600
Cite this page as followsStatistical Computations at FreeStatistics.org, Office for Research Development and Education, URL https://freestatistics.org/blog/index.php?v=date/2009/Jun/07/t1244406349vk5k1tlqappnv56.htm/, Retrieved Mon, 13 May 2024 07:17:57 +0000
Statistical Computations at FreeStatistics.org, Office for Research Development and Education, URL https://freestatistics.org/blog/index.php?pk=42258, Retrieved Mon, 13 May 2024 07:17:57 +0000
QR Codes:

Original text written by user:
IsPrivate?No (this computation is public)
User-defined keywords
Estimated Impact89
Family? (F = Feedback message, R = changed R code, M = changed R Module, P = changed Parameters, D = changed Data)
-       [Standard Deviation Plot] [Annelies Reul ban...] [2009-06-07 20:25:03] [9202dc9f5562cf74198e3e368d8190ce] [Current]
Feedback Forum

Post a new message
Dataseries X:
334053
326018
326894
330958
333913
337042
342103
344795
342060
342535
343083
354261
363049
347562
347577
349715
353818
354073
357040
359177
354845
354481
352747
360446
368285
354819
353017
354551
352682
351146
350760
347555
335363
325165
311274
297987
344276
306152
283323
285869
293660
300831
313351
322765
323613
329199
334038
350683
353929
340715
347752
358474
366179
373163
382739
391636
391693
395453
399368
416075
427623
418000
425316
436397
442533
449148
460852
462789
465097
469728
475434
495992
487101
489496
498649
505533
512839
522584
532603
531520
531623
535608
539804
559182
548414
550774
556397
569125
571988
578807
588234
588724
588550
592764
598593
619494
604560
606210
614823
620033
625236
631307
639704
639223
637312
640124
644649
668209
651667
653170
662102
667617
671420
677156
686086
684954
684331
722145
731098
753123
740228
741472
747315
757533


Summary of computational transaction
Raw Inputview raw input (R code)
Raw Outputview raw output of R engine
Computing time1 seconds
R Server'Gwilym Jenkins' @ 72.249.127.135

\begin{tabular}{lllllllll}
\hline
Summary of computational transaction \tabularnewline
Raw Input & view raw input (R code)  \tabularnewline
Raw Output & view raw output of R engine  \tabularnewline
Computing time & 1 seconds \tabularnewline
R Server & 'Gwilym Jenkins' @ 72.249.127.135 \tabularnewline
\hline
\end{tabular}
%Source: https://freestatistics.org/blog/index.php?pk=42258&T=0

[TABLE]
[ROW][C]Summary of computational transaction[/C][/ROW]
[ROW][C]Raw Input[/C][C]view raw input (R code) [/C][/ROW]
[ROW][C]Raw Output[/C][C]view raw output of R engine [/C][/ROW]
[ROW][C]Computing time[/C][C]1 seconds[/C][/ROW]
[ROW][C]R Server[/C][C]'Gwilym Jenkins' @ 72.249.127.135[/C][/ROW]
[/TABLE]
Source: https://freestatistics.org/blog/index.php?pk=42258&T=0

Globally Unique Identifier (entire table): ba.freestatistics.org/blog/index.php?pk=42258&T=0

As an alternative you can also use a QR Code:  

The GUIDs for individual cells are displayed in the table below:

Summary of computational transaction
Raw Inputview raw input (R code)
Raw Outputview raw output of R engine
Computing time1 seconds
R Server'Gwilym Jenkins' @ 72.249.127.135


Parameters (Session):
par1 = 12 ;
Parameters (R input):
par1 = 12 ;
R code (references can be found in the software module):
par1 <- as.numeric(par1)
(n <- length(x))
(np <- floor(n / par1))
arr <- array(NA,dim=c(par1,np+1))
ari <- array(0,dim=par1)
j <- 0
for (i in 1:n)
{
j = j + 1
ari[j] = ari[j] + 1
arr[j,ari[j]] <- x[i]
if (j == par1) j = 0
}
ari
arr
arr.sd <- array(NA,dim=par1)
arr.range <- array(NA,dim=par1)
arr.iqr <- array(NA,dim=par1)
for (j in 1:par1)
{
arr.sd[j] <- sqrt(var(arr[j,],na.rm=TRUE))
arr.range[j] <- max(arr[j,],na.rm=TRUE) - min(arr[j,],na.rm=TRUE)
arr.iqr[j] <- quantile(arr[j,],0.75,na.rm=TRUE) - quantile(arr[j,],0.25,na.rm=TRUE)
}
overall.sd <- sqrt(var(x))
overall.range <- max(x) - min(x)
overall.iqr <- quantile(x,0.75) - quantile(x,0.25)
bitmap(file='plot1.png')
plot(arr.sd,type='b',ylab='S.D.',main='Standard Deviation Plot',xlab='Periodic Index')
mtext(paste('# blocks = ',np))
abline(overall.sd,0)
dev.off()
bitmap(file='plot2.png')
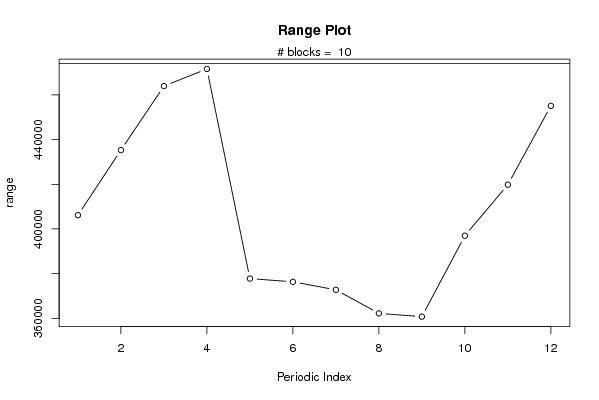
plot(arr.range,type='b',ylab='range',main='Range Plot',xlab='Periodic Index')
mtext(paste('# blocks = ',np))
abline(overall.range,0)
dev.off()
bitmap(file='plot3.png')
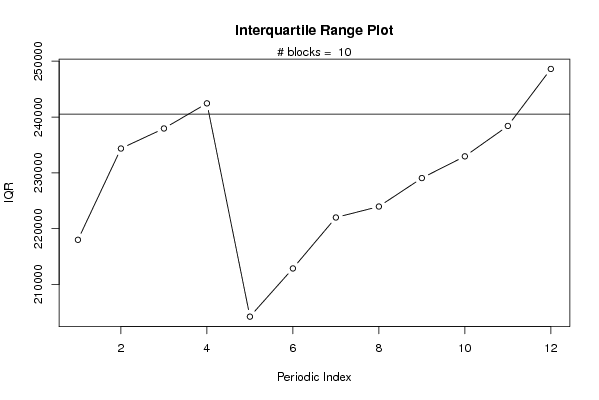
plot(arr.iqr,type='b',ylab='IQR',main='Interquartile Range Plot',xlab='Periodic Index')
mtext(paste('# blocks = ',np))
abline(overall.iqr,0)
dev.off()
bitmap(file='plot4.png')
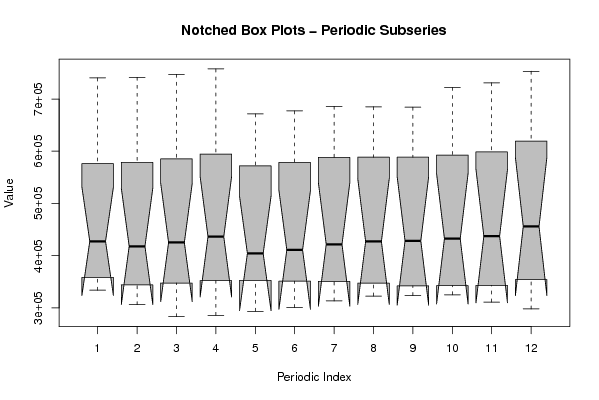
z <- data.frame(t(arr))
names(z) <- c(1:par1)
(boxplot(z,notch=TRUE,col='grey',xlab='Periodic Index',ylab='Value',main='Notched Box Plots - Periodic Subseries'))
dev.off()
bitmap(file='plot5.png')
z <- data.frame(arr)
names(z) <- c(1:np)
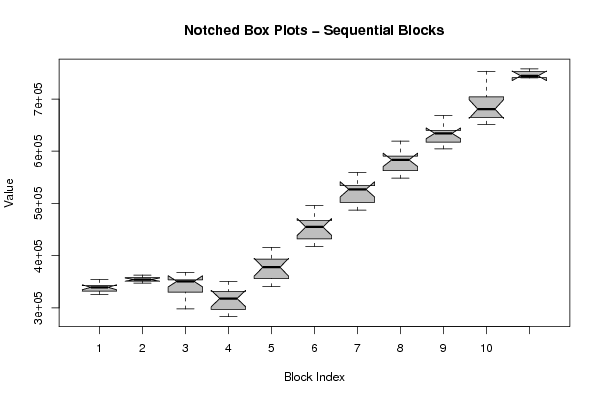
(boxplot(z,notch=TRUE,col='grey',xlab='Block Index',ylab='Value',main='Notched Box Plots - Sequential Blocks'))
dev.off()
bitmap(file='plot6.png')
z <- data.frame(cbind(arr.sd,arr.range,arr.iqr))
names(z) <- list('S.D.','Range','IQR')
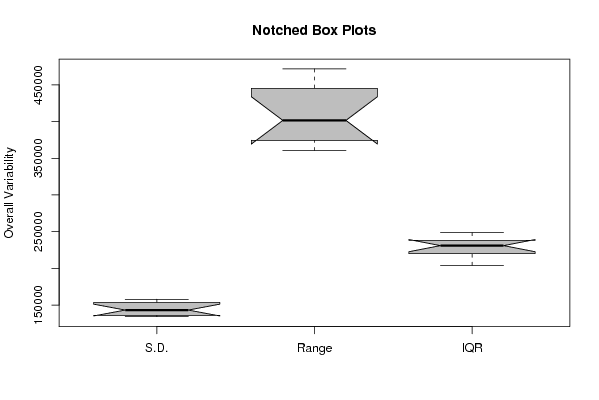
(boxplot(z,notch=TRUE,col='grey',ylab='Overall Variability',main='Notched Box Plots'))
dev.off()