Free Statistics

of Irreproducible Research!

Author's title

Author*Unverified author*
R Software Modulerwasp_exponentialsmoothing.wasp
Title produced by softwareExponential Smoothing
Date of computationSun, 07 Jun 2009 12:44:53 -0600
Cite this page as followsStatistical Computations at FreeStatistics.org, Office for Research Development and Education, URL https://freestatistics.org/blog/index.php?v=date/2009/Jun/07/t1244400366fbq1mz6op51g5rl.htm/, Retrieved Mon, 13 May 2024 00:52:21 +0000
Statistical Computations at FreeStatistics.org, Office for Research Development and Education, URL https://freestatistics.org/blog/index.php?pk=42231, Retrieved Mon, 13 May 2024 00:52:21 +0000
QR Codes:

Original text written by user:Wesley De Bondt
IsPrivate?No (this computation is public)
User-defined keywordsWesley De Bondt
Estimated Impact108
Family? (F = Feedback message, R = changed R code, M = changed R Module, P = changed Parameters, D = changed Data)
-       [Exponential Smoothing] [Koers € t.o.v. £] [2009-06-07 18:44:53] [52abb83916effba29fe89a1e0cad1e5e] [Current]
Feedback Forum

Post a new message
Dataseries X:
0.63709
0.64218
0.65711
0.66977
0.68255
0.68902
0.71322
0.70224
0.70045
0.69919
0.69693
0.69763
0.69278
0.70196
0.69215
0.6769
0.67124
0.66533
0.67157
0.66428
0.66576
0.66942
0.68130
0.69144
0.69862
0.695
0.69867
0.68968
0.69233
0.68293
0.68399
0.66895
0.68756
0.68527
0.6776
0.68137
0.67933
0.67922
0.68598
0.68297
0.68935
0.69463
0.6833
0.68666
0.68782
0.67669
0.67511
0.67254
0.67397
0.67286
0.66341
0.668
0.68021
0.67934
0.68136
0.67562
0.6744
0.67766
0.68887
0.69614
0.70896
0.72064
0.74725
0.75094
0.77494
0.79487
0.79209
0.79152
0.79308
0.79279
0.79924
0.78668


Summary of computational transaction
Raw Inputview raw input (R code)
Raw Outputview raw output of R engine
Computing time2 seconds
R Server'George Udny Yule' @ 72.249.76.132

\begin{tabular}{lllllllll}
\hline
Summary of computational transaction \tabularnewline
Raw Input & view raw input (R code)  \tabularnewline
Raw Output & view raw output of R engine  \tabularnewline
Computing time & 2 seconds \tabularnewline
R Server & 'George Udny Yule' @ 72.249.76.132 \tabularnewline
\hline
\end{tabular}
%Source: https://freestatistics.org/blog/index.php?pk=42231&T=0

[TABLE]
[ROW][C]Summary of computational transaction[/C][/ROW]
[ROW][C]Raw Input[/C][C]view raw input (R code) [/C][/ROW]
[ROW][C]Raw Output[/C][C]view raw output of R engine [/C][/ROW]
[ROW][C]Computing time[/C][C]2 seconds[/C][/ROW]
[ROW][C]R Server[/C][C]'George Udny Yule' @ 72.249.76.132[/C][/ROW]
[/TABLE]
Source: https://freestatistics.org/blog/index.php?pk=42231&T=0

Globally Unique Identifier (entire table): ba.freestatistics.org/blog/index.php?pk=42231&T=0

As an alternative you can also use a QR Code:  

The GUIDs for individual cells are displayed in the table below:

Summary of computational transaction
Raw Inputview raw input (R code)
Raw Outputview raw output of R engine
Computing time2 seconds
R Server'George Udny Yule' @ 72.249.76.132


Estimated Parameters of Exponential Smoothing
ParameterValue
alpha0.72935033359918
beta0.0377512556596677
gamma1

\begin{tabular}{lllllllll}
\hline
Estimated Parameters of Exponential Smoothing \tabularnewline
Parameter & Value \tabularnewline
alpha & 0.72935033359918 \tabularnewline
beta & 0.0377512556596677 \tabularnewline
gamma & 1 \tabularnewline
\hline
\end{tabular}
%Source: https://freestatistics.org/blog/index.php?pk=42231&T=1

[TABLE]
[ROW][C]Estimated Parameters of Exponential Smoothing[/C][/ROW]
[ROW][C]Parameter[/C][C]Value[/C][/ROW]
[ROW][C]alpha[/C][C]0.72935033359918[/C][/ROW]
[ROW][C]beta[/C][C]0.0377512556596677[/C][/ROW]
[ROW][C]gamma[/C][C]1[/C][/ROW]
[/TABLE]
Source: https://freestatistics.org/blog/index.php?pk=42231&T=1

Globally Unique Identifier (entire table): ba.freestatistics.org/blog/index.php?pk=42231&T=1

As an alternative you can also use a QR Code:  

The GUIDs for individual cells are displayed in the table below:

Estimated Parameters of Exponential Smoothing
ParameterValue
alpha0.72935033359918
beta0.0377512556596677
gamma1


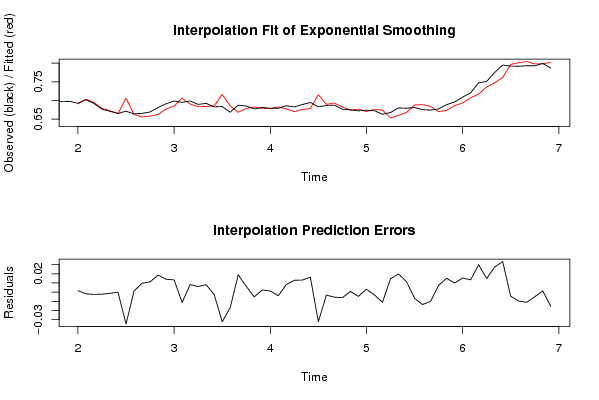
Interpolation Forecasts of Exponential Smoothing
tObservedFittedResiduals
130.692780.691127657585470.00165234241453005
140.701960.703796493163842-0.00183649316384238
150.692150.694590179546828-0.00244017954682751
160.67690.679095129427552-0.00219512942755229
170.671240.672514199573662-0.00127419957366226
180.665330.665337366543871-7.36654387079039e-06
190.671570.706308462444023-0.0347384624440232
200.664280.6629773535945150.00130264640548461
210.665760.6560191230983690.00974087690163095
220.669420.6582072730715430.0112127269284572
230.68130.6627088973528330.0185911026471672
240.691440.6773479944848190.0140920055151814
250.698620.6852550539551810.0133649460448186
260.6950.706232946549341-0.0112329465493407
270.698670.6904619359164830.00820806408351704
280.689680.6835446930664550.00613530693354469
290.692330.6842633729274610.00806662707253869
300.682930.685473885985115-0.00254388598511468
310.683990.716356913935967-0.0323669139359671
320.668950.685737209697161-0.0167872096971613
330.687560.6685980575904610.0189619424095386
340.685270.6788929590023580.00637704099764214
350.67760.682714492330424-0.00511449233042383
360.681370.6790433827201580.00232661727984240
370.679330.6780457830375670.00128421696243308
380.679220.683095760028459-0.00387576002845902
390.685980.6776955704601640.00828442953983555
400.682970.670018287967080.0129517120329192
410.689350.6761641626840660.0131858373159340
420.694630.6783105297689630.0163194702310372
430.68330.715473230042995-0.0321732300429954
440.686660.689810033582268-0.00315003358226784
450.687820.693266743646834-0.00544674364683362
460.676690.682655083403595-0.00596508340359514
470.675110.6743268988453850.000783101154615329
480.672540.677095712864942-0.00455571286494183
490.673970.670731438790150.00323856120985
500.672860.67579916275295-0.0029391627529497
510.663410.674387911531543-0.0109779115315426
520.6680.6534091449657020.0145908550342980
530.680210.660343339455690.0198666605443096
540.679340.6679238773003560.0114161226996443
550.681360.687964171434894-0.00660417143489378
560.675620.68908729568047-0.0134672956804704
570.67440.684395829850682-0.0099958298506816
580.677660.6701990760131660.00746092398683396
590.688870.6737322909747150.0151377090252846
600.696140.6861636756583710.00997632434162932
610.708960.6935459698316890.015414030168311
620.720640.7071952196309340.0134447803690663
630.747250.717382374238130.0298676257618705
640.750940.7360635847546620.0148764152453376
650.774940.7475909029548740.0273490970451258
660.794870.7615045989730850.0333654010269148
670.792090.796443744881027-0.00435374488102658
680.791520.801180004095212-0.00966000409521206
690.793080.8041390561715-0.0110590561715009
700.792790.797796345156746-0.00500634515674592
710.799240.7978758427824840.00136415721751582
720.786680.802046886608035-0.0153668866080353

\begin{tabular}{lllllllll}
\hline
Interpolation Forecasts of Exponential Smoothing \tabularnewline
t & Observed & Fitted & Residuals \tabularnewline
13 & 0.69278 & 0.69112765758547 & 0.00165234241453005 \tabularnewline
14 & 0.70196 & 0.703796493163842 & -0.00183649316384238 \tabularnewline
15 & 0.69215 & 0.694590179546828 & -0.00244017954682751 \tabularnewline
16 & 0.6769 & 0.679095129427552 & -0.00219512942755229 \tabularnewline
17 & 0.67124 & 0.672514199573662 & -0.00127419957366226 \tabularnewline
18 & 0.66533 & 0.665337366543871 & -7.36654387079039e-06 \tabularnewline
19 & 0.67157 & 0.706308462444023 & -0.0347384624440232 \tabularnewline
20 & 0.66428 & 0.662977353594515 & 0.00130264640548461 \tabularnewline
21 & 0.66576 & 0.656019123098369 & 0.00974087690163095 \tabularnewline
22 & 0.66942 & 0.658207273071543 & 0.0112127269284572 \tabularnewline
23 & 0.6813 & 0.662708897352833 & 0.0185911026471672 \tabularnewline
24 & 0.69144 & 0.677347994484819 & 0.0140920055151814 \tabularnewline
25 & 0.69862 & 0.685255053955181 & 0.0133649460448186 \tabularnewline
26 & 0.695 & 0.706232946549341 & -0.0112329465493407 \tabularnewline
27 & 0.69867 & 0.690461935916483 & 0.00820806408351704 \tabularnewline
28 & 0.68968 & 0.683544693066455 & 0.00613530693354469 \tabularnewline
29 & 0.69233 & 0.684263372927461 & 0.00806662707253869 \tabularnewline
30 & 0.68293 & 0.685473885985115 & -0.00254388598511468 \tabularnewline
31 & 0.68399 & 0.716356913935967 & -0.0323669139359671 \tabularnewline
32 & 0.66895 & 0.685737209697161 & -0.0167872096971613 \tabularnewline
33 & 0.68756 & 0.668598057590461 & 0.0189619424095386 \tabularnewline
34 & 0.68527 & 0.678892959002358 & 0.00637704099764214 \tabularnewline
35 & 0.6776 & 0.682714492330424 & -0.00511449233042383 \tabularnewline
36 & 0.68137 & 0.679043382720158 & 0.00232661727984240 \tabularnewline
37 & 0.67933 & 0.678045783037567 & 0.00128421696243308 \tabularnewline
38 & 0.67922 & 0.683095760028459 & -0.00387576002845902 \tabularnewline
39 & 0.68598 & 0.677695570460164 & 0.00828442953983555 \tabularnewline
40 & 0.68297 & 0.67001828796708 & 0.0129517120329192 \tabularnewline
41 & 0.68935 & 0.676164162684066 & 0.0131858373159340 \tabularnewline
42 & 0.69463 & 0.678310529768963 & 0.0163194702310372 \tabularnewline
43 & 0.6833 & 0.715473230042995 & -0.0321732300429954 \tabularnewline
44 & 0.68666 & 0.689810033582268 & -0.00315003358226784 \tabularnewline
45 & 0.68782 & 0.693266743646834 & -0.00544674364683362 \tabularnewline
46 & 0.67669 & 0.682655083403595 & -0.00596508340359514 \tabularnewline
47 & 0.67511 & 0.674326898845385 & 0.000783101154615329 \tabularnewline
48 & 0.67254 & 0.677095712864942 & -0.00455571286494183 \tabularnewline
49 & 0.67397 & 0.67073143879015 & 0.00323856120985 \tabularnewline
50 & 0.67286 & 0.67579916275295 & -0.0029391627529497 \tabularnewline
51 & 0.66341 & 0.674387911531543 & -0.0109779115315426 \tabularnewline
52 & 0.668 & 0.653409144965702 & 0.0145908550342980 \tabularnewline
53 & 0.68021 & 0.66034333945569 & 0.0198666605443096 \tabularnewline
54 & 0.67934 & 0.667923877300356 & 0.0114161226996443 \tabularnewline
55 & 0.68136 & 0.687964171434894 & -0.00660417143489378 \tabularnewline
56 & 0.67562 & 0.68908729568047 & -0.0134672956804704 \tabularnewline
57 & 0.6744 & 0.684395829850682 & -0.0099958298506816 \tabularnewline
58 & 0.67766 & 0.670199076013166 & 0.00746092398683396 \tabularnewline
59 & 0.68887 & 0.673732290974715 & 0.0151377090252846 \tabularnewline
60 & 0.69614 & 0.686163675658371 & 0.00997632434162932 \tabularnewline
61 & 0.70896 & 0.693545969831689 & 0.015414030168311 \tabularnewline
62 & 0.72064 & 0.707195219630934 & 0.0134447803690663 \tabularnewline
63 & 0.74725 & 0.71738237423813 & 0.0298676257618705 \tabularnewline
64 & 0.75094 & 0.736063584754662 & 0.0148764152453376 \tabularnewline
65 & 0.77494 & 0.747590902954874 & 0.0273490970451258 \tabularnewline
66 & 0.79487 & 0.761504598973085 & 0.0333654010269148 \tabularnewline
67 & 0.79209 & 0.796443744881027 & -0.00435374488102658 \tabularnewline
68 & 0.79152 & 0.801180004095212 & -0.00966000409521206 \tabularnewline
69 & 0.79308 & 0.8041390561715 & -0.0110590561715009 \tabularnewline
70 & 0.79279 & 0.797796345156746 & -0.00500634515674592 \tabularnewline
71 & 0.79924 & 0.797875842782484 & 0.00136415721751582 \tabularnewline
72 & 0.78668 & 0.802046886608035 & -0.0153668866080353 \tabularnewline
\hline
\end{tabular}
%Source: https://freestatistics.org/blog/index.php?pk=42231&T=2

[TABLE]
[ROW][C]Interpolation Forecasts of Exponential Smoothing[/C][/ROW]
[ROW][C]t[/C][C]Observed[/C][C]Fitted[/C][C]Residuals[/C][/ROW]
[ROW][C]13[/C][C]0.69278[/C][C]0.69112765758547[/C][C]0.00165234241453005[/C][/ROW]
[ROW][C]14[/C][C]0.70196[/C][C]0.703796493163842[/C][C]-0.00183649316384238[/C][/ROW]
[ROW][C]15[/C][C]0.69215[/C][C]0.694590179546828[/C][C]-0.00244017954682751[/C][/ROW]
[ROW][C]16[/C][C]0.6769[/C][C]0.679095129427552[/C][C]-0.00219512942755229[/C][/ROW]
[ROW][C]17[/C][C]0.67124[/C][C]0.672514199573662[/C][C]-0.00127419957366226[/C][/ROW]
[ROW][C]18[/C][C]0.66533[/C][C]0.665337366543871[/C][C]-7.36654387079039e-06[/C][/ROW]
[ROW][C]19[/C][C]0.67157[/C][C]0.706308462444023[/C][C]-0.0347384624440232[/C][/ROW]
[ROW][C]20[/C][C]0.66428[/C][C]0.662977353594515[/C][C]0.00130264640548461[/C][/ROW]
[ROW][C]21[/C][C]0.66576[/C][C]0.656019123098369[/C][C]0.00974087690163095[/C][/ROW]
[ROW][C]22[/C][C]0.66942[/C][C]0.658207273071543[/C][C]0.0112127269284572[/C][/ROW]
[ROW][C]23[/C][C]0.6813[/C][C]0.662708897352833[/C][C]0.0185911026471672[/C][/ROW]
[ROW][C]24[/C][C]0.69144[/C][C]0.677347994484819[/C][C]0.0140920055151814[/C][/ROW]
[ROW][C]25[/C][C]0.69862[/C][C]0.685255053955181[/C][C]0.0133649460448186[/C][/ROW]
[ROW][C]26[/C][C]0.695[/C][C]0.706232946549341[/C][C]-0.0112329465493407[/C][/ROW]
[ROW][C]27[/C][C]0.69867[/C][C]0.690461935916483[/C][C]0.00820806408351704[/C][/ROW]
[ROW][C]28[/C][C]0.68968[/C][C]0.683544693066455[/C][C]0.00613530693354469[/C][/ROW]
[ROW][C]29[/C][C]0.69233[/C][C]0.684263372927461[/C][C]0.00806662707253869[/C][/ROW]
[ROW][C]30[/C][C]0.68293[/C][C]0.685473885985115[/C][C]-0.00254388598511468[/C][/ROW]
[ROW][C]31[/C][C]0.68399[/C][C]0.716356913935967[/C][C]-0.0323669139359671[/C][/ROW]
[ROW][C]32[/C][C]0.66895[/C][C]0.685737209697161[/C][C]-0.0167872096971613[/C][/ROW]
[ROW][C]33[/C][C]0.68756[/C][C]0.668598057590461[/C][C]0.0189619424095386[/C][/ROW]
[ROW][C]34[/C][C]0.68527[/C][C]0.678892959002358[/C][C]0.00637704099764214[/C][/ROW]
[ROW][C]35[/C][C]0.6776[/C][C]0.682714492330424[/C][C]-0.00511449233042383[/C][/ROW]
[ROW][C]36[/C][C]0.68137[/C][C]0.679043382720158[/C][C]0.00232661727984240[/C][/ROW]
[ROW][C]37[/C][C]0.67933[/C][C]0.678045783037567[/C][C]0.00128421696243308[/C][/ROW]
[ROW][C]38[/C][C]0.67922[/C][C]0.683095760028459[/C][C]-0.00387576002845902[/C][/ROW]
[ROW][C]39[/C][C]0.68598[/C][C]0.677695570460164[/C][C]0.00828442953983555[/C][/ROW]
[ROW][C]40[/C][C]0.68297[/C][C]0.67001828796708[/C][C]0.0129517120329192[/C][/ROW]
[ROW][C]41[/C][C]0.68935[/C][C]0.676164162684066[/C][C]0.0131858373159340[/C][/ROW]
[ROW][C]42[/C][C]0.69463[/C][C]0.678310529768963[/C][C]0.0163194702310372[/C][/ROW]
[ROW][C]43[/C][C]0.6833[/C][C]0.715473230042995[/C][C]-0.0321732300429954[/C][/ROW]
[ROW][C]44[/C][C]0.68666[/C][C]0.689810033582268[/C][C]-0.00315003358226784[/C][/ROW]
[ROW][C]45[/C][C]0.68782[/C][C]0.693266743646834[/C][C]-0.00544674364683362[/C][/ROW]
[ROW][C]46[/C][C]0.67669[/C][C]0.682655083403595[/C][C]-0.00596508340359514[/C][/ROW]
[ROW][C]47[/C][C]0.67511[/C][C]0.674326898845385[/C][C]0.000783101154615329[/C][/ROW]
[ROW][C]48[/C][C]0.67254[/C][C]0.677095712864942[/C][C]-0.00455571286494183[/C][/ROW]
[ROW][C]49[/C][C]0.67397[/C][C]0.67073143879015[/C][C]0.00323856120985[/C][/ROW]
[ROW][C]50[/C][C]0.67286[/C][C]0.67579916275295[/C][C]-0.0029391627529497[/C][/ROW]
[ROW][C]51[/C][C]0.66341[/C][C]0.674387911531543[/C][C]-0.0109779115315426[/C][/ROW]
[ROW][C]52[/C][C]0.668[/C][C]0.653409144965702[/C][C]0.0145908550342980[/C][/ROW]
[ROW][C]53[/C][C]0.68021[/C][C]0.66034333945569[/C][C]0.0198666605443096[/C][/ROW]
[ROW][C]54[/C][C]0.67934[/C][C]0.667923877300356[/C][C]0.0114161226996443[/C][/ROW]
[ROW][C]55[/C][C]0.68136[/C][C]0.687964171434894[/C][C]-0.00660417143489378[/C][/ROW]
[ROW][C]56[/C][C]0.67562[/C][C]0.68908729568047[/C][C]-0.0134672956804704[/C][/ROW]
[ROW][C]57[/C][C]0.6744[/C][C]0.684395829850682[/C][C]-0.0099958298506816[/C][/ROW]
[ROW][C]58[/C][C]0.67766[/C][C]0.670199076013166[/C][C]0.00746092398683396[/C][/ROW]
[ROW][C]59[/C][C]0.68887[/C][C]0.673732290974715[/C][C]0.0151377090252846[/C][/ROW]
[ROW][C]60[/C][C]0.69614[/C][C]0.686163675658371[/C][C]0.00997632434162932[/C][/ROW]
[ROW][C]61[/C][C]0.70896[/C][C]0.693545969831689[/C][C]0.015414030168311[/C][/ROW]
[ROW][C]62[/C][C]0.72064[/C][C]0.707195219630934[/C][C]0.0134447803690663[/C][/ROW]
[ROW][C]63[/C][C]0.74725[/C][C]0.71738237423813[/C][C]0.0298676257618705[/C][/ROW]
[ROW][C]64[/C][C]0.75094[/C][C]0.736063584754662[/C][C]0.0148764152453376[/C][/ROW]
[ROW][C]65[/C][C]0.77494[/C][C]0.747590902954874[/C][C]0.0273490970451258[/C][/ROW]
[ROW][C]66[/C][C]0.79487[/C][C]0.761504598973085[/C][C]0.0333654010269148[/C][/ROW]
[ROW][C]67[/C][C]0.79209[/C][C]0.796443744881027[/C][C]-0.00435374488102658[/C][/ROW]
[ROW][C]68[/C][C]0.79152[/C][C]0.801180004095212[/C][C]-0.00966000409521206[/C][/ROW]
[ROW][C]69[/C][C]0.79308[/C][C]0.8041390561715[/C][C]-0.0110590561715009[/C][/ROW]
[ROW][C]70[/C][C]0.79279[/C][C]0.797796345156746[/C][C]-0.00500634515674592[/C][/ROW]
[ROW][C]71[/C][C]0.79924[/C][C]0.797875842782484[/C][C]0.00136415721751582[/C][/ROW]
[ROW][C]72[/C][C]0.78668[/C][C]0.802046886608035[/C][C]-0.0153668866080353[/C][/ROW]
[/TABLE]
Source: https://freestatistics.org/blog/index.php?pk=42231&T=2

Globally Unique Identifier (entire table): ba.freestatistics.org/blog/index.php?pk=42231&T=2

As an alternative you can also use a QR Code:  

The GUIDs for individual cells are displayed in the table below:

Interpolation Forecasts of Exponential Smoothing
tObservedFittedResiduals
130.692780.691127657585470.00165234241453005
140.701960.703796493163842-0.00183649316384238
150.692150.694590179546828-0.00244017954682751
160.67690.679095129427552-0.00219512942755229
170.671240.672514199573662-0.00127419957366226
180.665330.665337366543871-7.36654387079039e-06
190.671570.706308462444023-0.0347384624440232
200.664280.6629773535945150.00130264640548461
210.665760.6560191230983690.00974087690163095
220.669420.6582072730715430.0112127269284572
230.68130.6627088973528330.0185911026471672
240.691440.6773479944848190.0140920055151814
250.698620.6852550539551810.0133649460448186
260.6950.706232946549341-0.0112329465493407
270.698670.6904619359164830.00820806408351704
280.689680.6835446930664550.00613530693354469
290.692330.6842633729274610.00806662707253869
300.682930.685473885985115-0.00254388598511468
310.683990.716356913935967-0.0323669139359671
320.668950.685737209697161-0.0167872096971613
330.687560.6685980575904610.0189619424095386
340.685270.6788929590023580.00637704099764214
350.67760.682714492330424-0.00511449233042383
360.681370.6790433827201580.00232661727984240
370.679330.6780457830375670.00128421696243308
380.679220.683095760028459-0.00387576002845902
390.685980.6776955704601640.00828442953983555
400.682970.670018287967080.0129517120329192
410.689350.6761641626840660.0131858373159340
420.694630.6783105297689630.0163194702310372
430.68330.715473230042995-0.0321732300429954
440.686660.689810033582268-0.00315003358226784
450.687820.693266743646834-0.00544674364683362
460.676690.682655083403595-0.00596508340359514
470.675110.6743268988453850.000783101154615329
480.672540.677095712864942-0.00455571286494183
490.673970.670731438790150.00323856120985
500.672860.67579916275295-0.0029391627529497
510.663410.674387911531543-0.0109779115315426
520.6680.6534091449657020.0145908550342980
530.680210.660343339455690.0198666605443096
540.679340.6679238773003560.0114161226996443
550.681360.687964171434894-0.00660417143489378
560.675620.68908729568047-0.0134672956804704
570.67440.684395829850682-0.0099958298506816
580.677660.6701990760131660.00746092398683396
590.688870.6737322909747150.0151377090252846
600.696140.6861636756583710.00997632434162932
610.708960.6935459698316890.015414030168311
620.720640.7071952196309340.0134447803690663
630.747250.717382374238130.0298676257618705
640.750940.7360635847546620.0148764152453376
650.774940.7475909029548740.0273490970451258
660.794870.7615045989730850.0333654010269148
670.792090.796443744881027-0.00435374488102658
680.791520.801180004095212-0.00966000409521206
690.793080.8041390561715-0.0110590561715009
700.792790.797796345156746-0.00500634515674592
710.799240.7978758427824840.00136415721751582
720.786680.802046886608035-0.0153668866080353


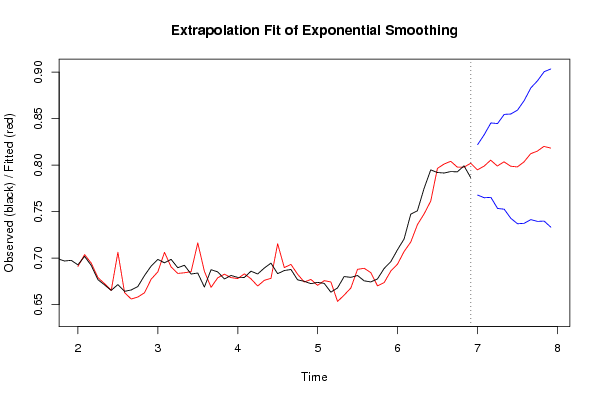
Extrapolation Forecasts of Exponential Smoothing
tForecast95% Lower Bound95% Upper Bound
730.7949013482736780.7678579441906260.82194475235673
740.7988355185861660.764919232741560.832751804430771
750.8053514940167850.765347493310450.84535549472312
760.799058941889250.7534248376033950.844693046175105
770.8035698295356780.7526004510973710.854539207973985
780.798869696811450.7427658007411030.854973592881797
790.7980513564262390.7369539816042240.859148731248254
800.8034330135056590.7374427672982780.86942325971304
810.8122310471825820.7414198461202230.88304224824494
820.8150690329078990.7394876932610940.890650372554703
830.8201385347627520.739821913794480.900455155731024
840.8183632684572250.7333338783190220.903392658595428

\begin{tabular}{lllllllll}
\hline
Extrapolation Forecasts of Exponential Smoothing \tabularnewline
t & Forecast & 95% Lower Bound & 95% Upper Bound \tabularnewline
73 & 0.794901348273678 & 0.767857944190626 & 0.82194475235673 \tabularnewline
74 & 0.798835518586166 & 0.76491923274156 & 0.832751804430771 \tabularnewline
75 & 0.805351494016785 & 0.76534749331045 & 0.84535549472312 \tabularnewline
76 & 0.79905894188925 & 0.753424837603395 & 0.844693046175105 \tabularnewline
77 & 0.803569829535678 & 0.752600451097371 & 0.854539207973985 \tabularnewline
78 & 0.79886969681145 & 0.742765800741103 & 0.854973592881797 \tabularnewline
79 & 0.798051356426239 & 0.736953981604224 & 0.859148731248254 \tabularnewline
80 & 0.803433013505659 & 0.737442767298278 & 0.86942325971304 \tabularnewline
81 & 0.812231047182582 & 0.741419846120223 & 0.88304224824494 \tabularnewline
82 & 0.815069032907899 & 0.739487693261094 & 0.890650372554703 \tabularnewline
83 & 0.820138534762752 & 0.73982191379448 & 0.900455155731024 \tabularnewline
84 & 0.818363268457225 & 0.733333878319022 & 0.903392658595428 \tabularnewline
\hline
\end{tabular}
%Source: https://freestatistics.org/blog/index.php?pk=42231&T=3

[TABLE]
[ROW][C]Extrapolation Forecasts of Exponential Smoothing[/C][/ROW]
[ROW][C]t[/C][C]Forecast[/C][C]95% Lower Bound[/C][C]95% Upper Bound[/C][/ROW]
[ROW][C]73[/C][C]0.794901348273678[/C][C]0.767857944190626[/C][C]0.82194475235673[/C][/ROW]
[ROW][C]74[/C][C]0.798835518586166[/C][C]0.76491923274156[/C][C]0.832751804430771[/C][/ROW]
[ROW][C]75[/C][C]0.805351494016785[/C][C]0.76534749331045[/C][C]0.84535549472312[/C][/ROW]
[ROW][C]76[/C][C]0.79905894188925[/C][C]0.753424837603395[/C][C]0.844693046175105[/C][/ROW]
[ROW][C]77[/C][C]0.803569829535678[/C][C]0.752600451097371[/C][C]0.854539207973985[/C][/ROW]
[ROW][C]78[/C][C]0.79886969681145[/C][C]0.742765800741103[/C][C]0.854973592881797[/C][/ROW]
[ROW][C]79[/C][C]0.798051356426239[/C][C]0.736953981604224[/C][C]0.859148731248254[/C][/ROW]
[ROW][C]80[/C][C]0.803433013505659[/C][C]0.737442767298278[/C][C]0.86942325971304[/C][/ROW]
[ROW][C]81[/C][C]0.812231047182582[/C][C]0.741419846120223[/C][C]0.88304224824494[/C][/ROW]
[ROW][C]82[/C][C]0.815069032907899[/C][C]0.739487693261094[/C][C]0.890650372554703[/C][/ROW]
[ROW][C]83[/C][C]0.820138534762752[/C][C]0.73982191379448[/C][C]0.900455155731024[/C][/ROW]
[ROW][C]84[/C][C]0.818363268457225[/C][C]0.733333878319022[/C][C]0.903392658595428[/C][/ROW]
[/TABLE]
Source: https://freestatistics.org/blog/index.php?pk=42231&T=3

Globally Unique Identifier (entire table): ba.freestatistics.org/blog/index.php?pk=42231&T=3

As an alternative you can also use a QR Code:  

The GUIDs for individual cells are displayed in the table below:

Extrapolation Forecasts of Exponential Smoothing
tForecast95% Lower Bound95% Upper Bound
730.7949013482736780.7678579441906260.82194475235673
740.7988355185861660.764919232741560.832751804430771
750.8053514940167850.765347493310450.84535549472312
760.799058941889250.7534248376033950.844693046175105
770.8035698295356780.7526004510973710.854539207973985
780.798869696811450.7427658007411030.854973592881797
790.7980513564262390.7369539816042240.859148731248254
800.8034330135056590.7374427672982780.86942325971304
810.8122310471825820.7414198461202230.88304224824494
820.8150690329078990.7394876932610940.890650372554703
830.8201385347627520.739821913794480.900455155731024
840.8183632684572250.7333338783190220.903392658595428


Parameters (Session):
par1 = 12 ; par2 = Triple ; par3 = additive ;
Parameters (R input):
par1 = 12 ; par2 = Triple ; par3 = additive ;
R code (references can be found in the software module):
par1 <- as.numeric(par1)
if (par2 == 'Single') K <- 1
if (par2 == 'Double') K <- 2
if (par2 == 'Triple') K <- par1
nx <- length(x)
nxmK <- nx - K
x <- ts(x, frequency = par1)
if (par2 == 'Single') fit <- HoltWinters(x, gamma=0, beta=0)
if (par2 == 'Double') fit <- HoltWinters(x, gamma=0)
if (par2 == 'Triple') fit <- HoltWinters(x, seasonal=par3)
fit
myresid <- x - fit$fitted[,'xhat']
bitmap(file='test1.png')
op <- par(mfrow=c(2,1))
plot(fit,ylab='Observed (black) / Fitted (red)',main='Interpolation Fit of Exponential Smoothing')
plot(myresid,ylab='Residuals',main='Interpolation Prediction Errors')
par(op)
dev.off()
bitmap(file='test2.png')
p <- predict(fit, par1, prediction.interval=TRUE)
np <- length(p[,1])
plot(fit,p,ylab='Observed (black) / Fitted (red)',main='Extrapolation Fit of Exponential Smoothing')
dev.off()
bitmap(file='test3.png')
op <- par(mfrow = c(2,2))
acf(as.numeric(myresid),lag.max = nx/2,main='Residual ACF')
spectrum(myresid,main='Residals Periodogram')
cpgram(myresid,main='Residal Cumulative Periodogram')
qqnorm(myresid,main='Residual Normal QQ Plot')
qqline(myresid)
par(op)
dev.off()
load(file='createtable')
a<-table.start()
a<-table.row.start(a)
a<-table.element(a,'Estimated Parameters of Exponential Smoothing',2,TRUE)
a<-table.row.end(a)
a<-table.row.start(a)
a<-table.element(a,'Parameter',header=TRUE)
a<-table.element(a,'Value',header=TRUE)
a<-table.row.end(a)
a<-table.row.start(a)
a<-table.element(a,'alpha',header=TRUE)
a<-table.element(a,fit$alpha)
a<-table.row.end(a)
a<-table.row.start(a)
a<-table.element(a,'beta',header=TRUE)
a<-table.element(a,fit$beta)
a<-table.row.end(a)
a<-table.row.start(a)
a<-table.element(a,'gamma',header=TRUE)
a<-table.element(a,fit$gamma)
a<-table.row.end(a)
a<-table.end(a)
table.save(a,file='mytable.tab')
a<-table.start()
a<-table.row.start(a)
a<-table.element(a,'Interpolation Forecasts of Exponential Smoothing',4,TRUE)
a<-table.row.end(a)
a<-table.row.start(a)
a<-table.element(a,'t',header=TRUE)
a<-table.element(a,'Observed',header=TRUE)
a<-table.element(a,'Fitted',header=TRUE)
a<-table.element(a,'Residuals',header=TRUE)
a<-table.row.end(a)
for (i in 1:nxmK) {
a<-table.row.start(a)
a<-table.element(a,i+K,header=TRUE)
a<-table.element(a,x[i+K])
a<-table.element(a,fit$fitted[i,'xhat'])
a<-table.element(a,myresid[i])
a<-table.row.end(a)
}
a<-table.end(a)
table.save(a,file='mytable1.tab')
a<-table.start()
a<-table.row.start(a)
a<-table.element(a,'Extrapolation Forecasts of Exponential Smoothing',4,TRUE)
a<-table.row.end(a)
a<-table.row.start(a)
a<-table.element(a,'t',header=TRUE)
a<-table.element(a,'Forecast',header=TRUE)
a<-table.element(a,'95% Lower Bound',header=TRUE)
a<-table.element(a,'95% Upper Bound',header=TRUE)
a<-table.row.end(a)
for (i in 1:np) {
a<-table.row.start(a)
a<-table.element(a,nx+i,header=TRUE)
a<-table.element(a,p[i,'fit'])
a<-table.element(a,p[i,'lwr'])
a<-table.element(a,p[i,'upr'])
a<-table.row.end(a)
}
a<-table.end(a)
table.save(a,file='mytable2.tab')