Free Statistics

of Irreproducible Research!

Author's title

Author*Unverified author*
R Software Modulerwasp_exponentialsmoothing.wasp
Title produced by softwareExponential Smoothing
Date of computationSun, 07 Jun 2009 11:49:36 -0600
Cite this page as followsStatistical Computations at FreeStatistics.org, Office for Research Development and Education, URL https://freestatistics.org/blog/index.php?v=date/2009/Jun/07/t1244397007o982fbhv17fsyza.htm/, Retrieved Mon, 13 May 2024 20:11:07 +0000
Statistical Computations at FreeStatistics.org, Office for Research Development and Education, URL https://freestatistics.org/blog/index.php?pk=42216, Retrieved Mon, 13 May 2024 20:11:07 +0000
QR Codes:

Original text written by user:
IsPrivate?No (this computation is public)
User-defined keywords
Estimated Impact128
Family? (F = Feedback message, R = changed R code, M = changed R Module, P = changed Parameters, D = changed Data)
-     [Exponential Smoothing] [Opgave 10 Oefenin...] [2009-06-02 12:23:00] [74be16979710d4c4e7c6647856088456]
-   PD  [Exponential Smoothing] [Opgave 10 Oefenin...] [2009-06-02 19:12:36] [74be16979710d4c4e7c6647856088456]
-   P       [Exponential Smoothing] [Opgave 10 Oefenin...] [2009-06-07 17:49:36] [d41d8cd98f00b204e9800998ecf8427e] [Current]
Feedback Forum

Post a new message
Dataseries X:
3779.7
3795.5
3813.1
3826.9
3833.3
3844.8
3851.3
3851.8
3854.1
3858.4
3861.6
3856.3
3855.8
3860.4
3855.1
3839.5
3833
3833.6
3826.8
3818.2
3811.4
3806.8
3810.3
3818.2
3858.9
3867.8
3872.3
3873.3
3876.7
3882.6
3883.5
3882.2
3888.1
3893.7
3901.9
3914.3
3930.3
3948.3
3971.5
3990.1
3993
3998
4015.8
4041.2
4060.7
4076.7
4103
4125.3
4139.7
4146.7
4158
4155.1
4144.8
4148.2
4142.5
4142.1
4145.4
4146.3
4143.5
4149.2
4158.9
4166.1
4179.1
4194.4
4211.7
4226.3
4235.8
4243.6
4258.7
4278.2
4298
4315.1
4334.3
4356
4374
4395.5


Summary of computational transaction
Raw Inputview raw input (R code)
Raw Outputview raw output of R engine
Computing time2 seconds
R Server'Sir Ronald Aylmer Fisher' @ 193.190.124.24

\begin{tabular}{lllllllll}
\hline
Summary of computational transaction \tabularnewline
Raw Input & view raw input (R code)  \tabularnewline
Raw Output & view raw output of R engine  \tabularnewline
Computing time & 2 seconds \tabularnewline
R Server & 'Sir Ronald Aylmer Fisher' @ 193.190.124.24 \tabularnewline
\hline
\end{tabular}
%Source: https://freestatistics.org/blog/index.php?pk=42216&T=0

[TABLE]
[ROW][C]Summary of computational transaction[/C][/ROW]
[ROW][C]Raw Input[/C][C]view raw input (R code) [/C][/ROW]
[ROW][C]Raw Output[/C][C]view raw output of R engine [/C][/ROW]
[ROW][C]Computing time[/C][C]2 seconds[/C][/ROW]
[ROW][C]R Server[/C][C]'Sir Ronald Aylmer Fisher' @ 193.190.124.24[/C][/ROW]
[/TABLE]
Source: https://freestatistics.org/blog/index.php?pk=42216&T=0

Globally Unique Identifier (entire table): ba.freestatistics.org/blog/index.php?pk=42216&T=0

As an alternative you can also use a QR Code:  

The GUIDs for individual cells are displayed in the table below:

Summary of computational transaction
Raw Inputview raw input (R code)
Raw Outputview raw output of R engine
Computing time2 seconds
R Server'Sir Ronald Aylmer Fisher' @ 193.190.124.24


Estimated Parameters of Exponential Smoothing
ParameterValue
alpha0.953285713274383
beta0.626443540081187
gamma1

\begin{tabular}{lllllllll}
\hline
Estimated Parameters of Exponential Smoothing \tabularnewline
Parameter & Value \tabularnewline
alpha & 0.953285713274383 \tabularnewline
beta & 0.626443540081187 \tabularnewline
gamma & 1 \tabularnewline
\hline
\end{tabular}
%Source: https://freestatistics.org/blog/index.php?pk=42216&T=1

[TABLE]
[ROW][C]Estimated Parameters of Exponential Smoothing[/C][/ROW]
[ROW][C]Parameter[/C][C]Value[/C][/ROW]
[ROW][C]alpha[/C][C]0.953285713274383[/C][/ROW]
[ROW][C]beta[/C][C]0.626443540081187[/C][/ROW]
[ROW][C]gamma[/C][C]1[/C][/ROW]
[/TABLE]
Source: https://freestatistics.org/blog/index.php?pk=42216&T=1

Globally Unique Identifier (entire table): ba.freestatistics.org/blog/index.php?pk=42216&T=1

As an alternative you can also use a QR Code:  

The GUIDs for individual cells are displayed in the table below:

Estimated Parameters of Exponential Smoothing
ParameterValue
alpha0.953285713274383
beta0.626443540081187
gamma1


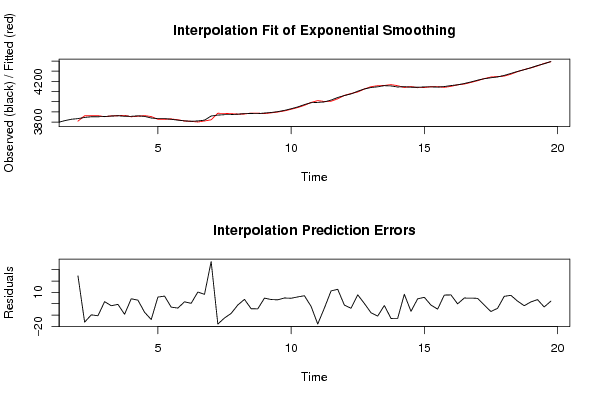
Interpolation Forecasts of Exponential Smoothing
tObservedFittedResiduals
53833.33808.7524.5500000000002
63844.83861.02642532958-16.2264253295775
73851.33861.11617551798-9.81617551798354
83851.83862.40470474576-10.6047047457605
93854.13852.280461911281.81953808872413
103858.43860.18498607354-1.78498607354140
113861.63862.16670331421-0.56670331421401
123856.33865.58508257386-9.28508257386284
133855.83851.43655379234.36344620769842
143860.43857.254284121093.14571587890759
153855.13862.59431297464-7.49431297464389
163839.53853.46543302548-13.9654330254793
1738333827.161769117675.83823088233294
183833.63826.878211444266.7217885557402
193826.83829.81548209852-3.01548209852126
203818.23822.01384482077-3.81384482077237
213811.43809.734912056521.66508794347692
223806.83806.444568561490.355431438508731
233810.33799.9862901454710.3137098545340
243818.23809.942086593678.25791340632577
253858.93821.7241420083237.17585799168
263867.83885.72804787394-17.9280478739352
273872.33884.89058072043-12.5905807204313
283873.33881.82302928699-8.52302928698646
293876.73877.84471515636-1.14471515636251
303882.63878.745541189413.85445881059331
313883.53887.93194746546-4.43194746546169
323882.23886.71367232607-4.51367232606708
333888.13883.178155090494.92184490950831
343893.73889.99456689233.70543310769926
353901.93898.461708298233.43829170177150
363914.33909.252041643765.04795835623554
373930.33925.492114957914.8078850420884
383948.33942.294863286866.00513671314275
393971.53964.466932870857.03306712915264
403990.13992.43116843819-2.33116843819334
4139934010.89080592883-17.8908059288269
4239984001.8211434419-3.82114344190131
434015.84004.5159230060911.2840769939053
444041.24028.4757020873612.7242979126399
454060.74061.93202184942-1.23202184942102
464076.74080.71986042767-4.01986042766794
4741034095.131831735687.86816826431914
484125.34125.063637657410.236362342592656
494139.74147.66697093726-7.96697093725743
504146.74157.58581576732-10.8858157673249
5141584159.58927061899-1.58927061898885
524155.14168.08249039810-12.9824903980953
534144.84157.74080674139-12.9408067413915
544148.24139.851078936248.348921063759
554142.54149.18087474119-6.68087474118784
564142.14137.80337207074.29662792929685
574145.44139.769567729445.63043227056005
584146.34147.50243316825-1.20243316824599
594143.54148.24544058326-4.7454405832641
604149.24141.602055129477.59794487053114
614158.94151.12542544387.77457455619697
624166.14166.211285515-0.11128551499678
634179.14174.108777397264.99122260274453
644194.44189.41818173934.98181826069685
654211.74206.987944856874.71205514312805
664226.34227.48915003755-1.18915003755046
674235.84242.65699375052-6.85699375052172
684243.64247.65521403769-4.05521403769308
694258.74252.184760194416.51523980558704
704278.24270.793328806787.40667119322461
7142984295.688010407552.31198959245285
724315.14316.8306387632-1.73063876319702
734334.34332.731013743131.56898625686881
7443564352.373283211413.62671678859078
7543744376.87653303087-2.87653303086518
764395.54393.235627299152.2643727008508

\begin{tabular}{lllllllll}
\hline
Interpolation Forecasts of Exponential Smoothing \tabularnewline
t & Observed & Fitted & Residuals \tabularnewline
5 & 3833.3 & 3808.75 & 24.5500000000002 \tabularnewline
6 & 3844.8 & 3861.02642532958 & -16.2264253295775 \tabularnewline
7 & 3851.3 & 3861.11617551798 & -9.81617551798354 \tabularnewline
8 & 3851.8 & 3862.40470474576 & -10.6047047457605 \tabularnewline
9 & 3854.1 & 3852.28046191128 & 1.81953808872413 \tabularnewline
10 & 3858.4 & 3860.18498607354 & -1.78498607354140 \tabularnewline
11 & 3861.6 & 3862.16670331421 & -0.56670331421401 \tabularnewline
12 & 3856.3 & 3865.58508257386 & -9.28508257386284 \tabularnewline
13 & 3855.8 & 3851.4365537923 & 4.36344620769842 \tabularnewline
14 & 3860.4 & 3857.25428412109 & 3.14571587890759 \tabularnewline
15 & 3855.1 & 3862.59431297464 & -7.49431297464389 \tabularnewline
16 & 3839.5 & 3853.46543302548 & -13.9654330254793 \tabularnewline
17 & 3833 & 3827.16176911767 & 5.83823088233294 \tabularnewline
18 & 3833.6 & 3826.87821144426 & 6.7217885557402 \tabularnewline
19 & 3826.8 & 3829.81548209852 & -3.01548209852126 \tabularnewline
20 & 3818.2 & 3822.01384482077 & -3.81384482077237 \tabularnewline
21 & 3811.4 & 3809.73491205652 & 1.66508794347692 \tabularnewline
22 & 3806.8 & 3806.44456856149 & 0.355431438508731 \tabularnewline
23 & 3810.3 & 3799.98629014547 & 10.3137098545340 \tabularnewline
24 & 3818.2 & 3809.94208659367 & 8.25791340632577 \tabularnewline
25 & 3858.9 & 3821.72414200832 & 37.17585799168 \tabularnewline
26 & 3867.8 & 3885.72804787394 & -17.9280478739352 \tabularnewline
27 & 3872.3 & 3884.89058072043 & -12.5905807204313 \tabularnewline
28 & 3873.3 & 3881.82302928699 & -8.52302928698646 \tabularnewline
29 & 3876.7 & 3877.84471515636 & -1.14471515636251 \tabularnewline
30 & 3882.6 & 3878.74554118941 & 3.85445881059331 \tabularnewline
31 & 3883.5 & 3887.93194746546 & -4.43194746546169 \tabularnewline
32 & 3882.2 & 3886.71367232607 & -4.51367232606708 \tabularnewline
33 & 3888.1 & 3883.17815509049 & 4.92184490950831 \tabularnewline
34 & 3893.7 & 3889.9945668923 & 3.70543310769926 \tabularnewline
35 & 3901.9 & 3898.46170829823 & 3.43829170177150 \tabularnewline
36 & 3914.3 & 3909.25204164376 & 5.04795835623554 \tabularnewline
37 & 3930.3 & 3925.49211495791 & 4.8078850420884 \tabularnewline
38 & 3948.3 & 3942.29486328686 & 6.00513671314275 \tabularnewline
39 & 3971.5 & 3964.46693287085 & 7.03306712915264 \tabularnewline
40 & 3990.1 & 3992.43116843819 & -2.33116843819334 \tabularnewline
41 & 3993 & 4010.89080592883 & -17.8908059288269 \tabularnewline
42 & 3998 & 4001.8211434419 & -3.82114344190131 \tabularnewline
43 & 4015.8 & 4004.51592300609 & 11.2840769939053 \tabularnewline
44 & 4041.2 & 4028.47570208736 & 12.7242979126399 \tabularnewline
45 & 4060.7 & 4061.93202184942 & -1.23202184942102 \tabularnewline
46 & 4076.7 & 4080.71986042767 & -4.01986042766794 \tabularnewline
47 & 4103 & 4095.13183173568 & 7.86816826431914 \tabularnewline
48 & 4125.3 & 4125.06363765741 & 0.236362342592656 \tabularnewline
49 & 4139.7 & 4147.66697093726 & -7.96697093725743 \tabularnewline
50 & 4146.7 & 4157.58581576732 & -10.8858157673249 \tabularnewline
51 & 4158 & 4159.58927061899 & -1.58927061898885 \tabularnewline
52 & 4155.1 & 4168.08249039810 & -12.9824903980953 \tabularnewline
53 & 4144.8 & 4157.74080674139 & -12.9408067413915 \tabularnewline
54 & 4148.2 & 4139.85107893624 & 8.348921063759 \tabularnewline
55 & 4142.5 & 4149.18087474119 & -6.68087474118784 \tabularnewline
56 & 4142.1 & 4137.8033720707 & 4.29662792929685 \tabularnewline
57 & 4145.4 & 4139.76956772944 & 5.63043227056005 \tabularnewline
58 & 4146.3 & 4147.50243316825 & -1.20243316824599 \tabularnewline
59 & 4143.5 & 4148.24544058326 & -4.7454405832641 \tabularnewline
60 & 4149.2 & 4141.60205512947 & 7.59794487053114 \tabularnewline
61 & 4158.9 & 4151.1254254438 & 7.77457455619697 \tabularnewline
62 & 4166.1 & 4166.211285515 & -0.11128551499678 \tabularnewline
63 & 4179.1 & 4174.10877739726 & 4.99122260274453 \tabularnewline
64 & 4194.4 & 4189.4181817393 & 4.98181826069685 \tabularnewline
65 & 4211.7 & 4206.98794485687 & 4.71205514312805 \tabularnewline
66 & 4226.3 & 4227.48915003755 & -1.18915003755046 \tabularnewline
67 & 4235.8 & 4242.65699375052 & -6.85699375052172 \tabularnewline
68 & 4243.6 & 4247.65521403769 & -4.05521403769308 \tabularnewline
69 & 4258.7 & 4252.18476019441 & 6.51523980558704 \tabularnewline
70 & 4278.2 & 4270.79332880678 & 7.40667119322461 \tabularnewline
71 & 4298 & 4295.68801040755 & 2.31198959245285 \tabularnewline
72 & 4315.1 & 4316.8306387632 & -1.73063876319702 \tabularnewline
73 & 4334.3 & 4332.73101374313 & 1.56898625686881 \tabularnewline
74 & 4356 & 4352.37328321141 & 3.62671678859078 \tabularnewline
75 & 4374 & 4376.87653303087 & -2.87653303086518 \tabularnewline
76 & 4395.5 & 4393.23562729915 & 2.2643727008508 \tabularnewline
\hline
\end{tabular}
%Source: https://freestatistics.org/blog/index.php?pk=42216&T=2

[TABLE]
[ROW][C]Interpolation Forecasts of Exponential Smoothing[/C][/ROW]
[ROW][C]t[/C][C]Observed[/C][C]Fitted[/C][C]Residuals[/C][/ROW]
[ROW][C]5[/C][C]3833.3[/C][C]3808.75[/C][C]24.5500000000002[/C][/ROW]
[ROW][C]6[/C][C]3844.8[/C][C]3861.02642532958[/C][C]-16.2264253295775[/C][/ROW]
[ROW][C]7[/C][C]3851.3[/C][C]3861.11617551798[/C][C]-9.81617551798354[/C][/ROW]
[ROW][C]8[/C][C]3851.8[/C][C]3862.40470474576[/C][C]-10.6047047457605[/C][/ROW]
[ROW][C]9[/C][C]3854.1[/C][C]3852.28046191128[/C][C]1.81953808872413[/C][/ROW]
[ROW][C]10[/C][C]3858.4[/C][C]3860.18498607354[/C][C]-1.78498607354140[/C][/ROW]
[ROW][C]11[/C][C]3861.6[/C][C]3862.16670331421[/C][C]-0.56670331421401[/C][/ROW]
[ROW][C]12[/C][C]3856.3[/C][C]3865.58508257386[/C][C]-9.28508257386284[/C][/ROW]
[ROW][C]13[/C][C]3855.8[/C][C]3851.4365537923[/C][C]4.36344620769842[/C][/ROW]
[ROW][C]14[/C][C]3860.4[/C][C]3857.25428412109[/C][C]3.14571587890759[/C][/ROW]
[ROW][C]15[/C][C]3855.1[/C][C]3862.59431297464[/C][C]-7.49431297464389[/C][/ROW]
[ROW][C]16[/C][C]3839.5[/C][C]3853.46543302548[/C][C]-13.9654330254793[/C][/ROW]
[ROW][C]17[/C][C]3833[/C][C]3827.16176911767[/C][C]5.83823088233294[/C][/ROW]
[ROW][C]18[/C][C]3833.6[/C][C]3826.87821144426[/C][C]6.7217885557402[/C][/ROW]
[ROW][C]19[/C][C]3826.8[/C][C]3829.81548209852[/C][C]-3.01548209852126[/C][/ROW]
[ROW][C]20[/C][C]3818.2[/C][C]3822.01384482077[/C][C]-3.81384482077237[/C][/ROW]
[ROW][C]21[/C][C]3811.4[/C][C]3809.73491205652[/C][C]1.66508794347692[/C][/ROW]
[ROW][C]22[/C][C]3806.8[/C][C]3806.44456856149[/C][C]0.355431438508731[/C][/ROW]
[ROW][C]23[/C][C]3810.3[/C][C]3799.98629014547[/C][C]10.3137098545340[/C][/ROW]
[ROW][C]24[/C][C]3818.2[/C][C]3809.94208659367[/C][C]8.25791340632577[/C][/ROW]
[ROW][C]25[/C][C]3858.9[/C][C]3821.72414200832[/C][C]37.17585799168[/C][/ROW]
[ROW][C]26[/C][C]3867.8[/C][C]3885.72804787394[/C][C]-17.9280478739352[/C][/ROW]
[ROW][C]27[/C][C]3872.3[/C][C]3884.89058072043[/C][C]-12.5905807204313[/C][/ROW]
[ROW][C]28[/C][C]3873.3[/C][C]3881.82302928699[/C][C]-8.52302928698646[/C][/ROW]
[ROW][C]29[/C][C]3876.7[/C][C]3877.84471515636[/C][C]-1.14471515636251[/C][/ROW]
[ROW][C]30[/C][C]3882.6[/C][C]3878.74554118941[/C][C]3.85445881059331[/C][/ROW]
[ROW][C]31[/C][C]3883.5[/C][C]3887.93194746546[/C][C]-4.43194746546169[/C][/ROW]
[ROW][C]32[/C][C]3882.2[/C][C]3886.71367232607[/C][C]-4.51367232606708[/C][/ROW]
[ROW][C]33[/C][C]3888.1[/C][C]3883.17815509049[/C][C]4.92184490950831[/C][/ROW]
[ROW][C]34[/C][C]3893.7[/C][C]3889.9945668923[/C][C]3.70543310769926[/C][/ROW]
[ROW][C]35[/C][C]3901.9[/C][C]3898.46170829823[/C][C]3.43829170177150[/C][/ROW]
[ROW][C]36[/C][C]3914.3[/C][C]3909.25204164376[/C][C]5.04795835623554[/C][/ROW]
[ROW][C]37[/C][C]3930.3[/C][C]3925.49211495791[/C][C]4.8078850420884[/C][/ROW]
[ROW][C]38[/C][C]3948.3[/C][C]3942.29486328686[/C][C]6.00513671314275[/C][/ROW]
[ROW][C]39[/C][C]3971.5[/C][C]3964.46693287085[/C][C]7.03306712915264[/C][/ROW]
[ROW][C]40[/C][C]3990.1[/C][C]3992.43116843819[/C][C]-2.33116843819334[/C][/ROW]
[ROW][C]41[/C][C]3993[/C][C]4010.89080592883[/C][C]-17.8908059288269[/C][/ROW]
[ROW][C]42[/C][C]3998[/C][C]4001.8211434419[/C][C]-3.82114344190131[/C][/ROW]
[ROW][C]43[/C][C]4015.8[/C][C]4004.51592300609[/C][C]11.2840769939053[/C][/ROW]
[ROW][C]44[/C][C]4041.2[/C][C]4028.47570208736[/C][C]12.7242979126399[/C][/ROW]
[ROW][C]45[/C][C]4060.7[/C][C]4061.93202184942[/C][C]-1.23202184942102[/C][/ROW]
[ROW][C]46[/C][C]4076.7[/C][C]4080.71986042767[/C][C]-4.01986042766794[/C][/ROW]
[ROW][C]47[/C][C]4103[/C][C]4095.13183173568[/C][C]7.86816826431914[/C][/ROW]
[ROW][C]48[/C][C]4125.3[/C][C]4125.06363765741[/C][C]0.236362342592656[/C][/ROW]
[ROW][C]49[/C][C]4139.7[/C][C]4147.66697093726[/C][C]-7.96697093725743[/C][/ROW]
[ROW][C]50[/C][C]4146.7[/C][C]4157.58581576732[/C][C]-10.8858157673249[/C][/ROW]
[ROW][C]51[/C][C]4158[/C][C]4159.58927061899[/C][C]-1.58927061898885[/C][/ROW]
[ROW][C]52[/C][C]4155.1[/C][C]4168.08249039810[/C][C]-12.9824903980953[/C][/ROW]
[ROW][C]53[/C][C]4144.8[/C][C]4157.74080674139[/C][C]-12.9408067413915[/C][/ROW]
[ROW][C]54[/C][C]4148.2[/C][C]4139.85107893624[/C][C]8.348921063759[/C][/ROW]
[ROW][C]55[/C][C]4142.5[/C][C]4149.18087474119[/C][C]-6.68087474118784[/C][/ROW]
[ROW][C]56[/C][C]4142.1[/C][C]4137.8033720707[/C][C]4.29662792929685[/C][/ROW]
[ROW][C]57[/C][C]4145.4[/C][C]4139.76956772944[/C][C]5.63043227056005[/C][/ROW]
[ROW][C]58[/C][C]4146.3[/C][C]4147.50243316825[/C][C]-1.20243316824599[/C][/ROW]
[ROW][C]59[/C][C]4143.5[/C][C]4148.24544058326[/C][C]-4.7454405832641[/C][/ROW]
[ROW][C]60[/C][C]4149.2[/C][C]4141.60205512947[/C][C]7.59794487053114[/C][/ROW]
[ROW][C]61[/C][C]4158.9[/C][C]4151.1254254438[/C][C]7.77457455619697[/C][/ROW]
[ROW][C]62[/C][C]4166.1[/C][C]4166.211285515[/C][C]-0.11128551499678[/C][/ROW]
[ROW][C]63[/C][C]4179.1[/C][C]4174.10877739726[/C][C]4.99122260274453[/C][/ROW]
[ROW][C]64[/C][C]4194.4[/C][C]4189.4181817393[/C][C]4.98181826069685[/C][/ROW]
[ROW][C]65[/C][C]4211.7[/C][C]4206.98794485687[/C][C]4.71205514312805[/C][/ROW]
[ROW][C]66[/C][C]4226.3[/C][C]4227.48915003755[/C][C]-1.18915003755046[/C][/ROW]
[ROW][C]67[/C][C]4235.8[/C][C]4242.65699375052[/C][C]-6.85699375052172[/C][/ROW]
[ROW][C]68[/C][C]4243.6[/C][C]4247.65521403769[/C][C]-4.05521403769308[/C][/ROW]
[ROW][C]69[/C][C]4258.7[/C][C]4252.18476019441[/C][C]6.51523980558704[/C][/ROW]
[ROW][C]70[/C][C]4278.2[/C][C]4270.79332880678[/C][C]7.40667119322461[/C][/ROW]
[ROW][C]71[/C][C]4298[/C][C]4295.68801040755[/C][C]2.31198959245285[/C][/ROW]
[ROW][C]72[/C][C]4315.1[/C][C]4316.8306387632[/C][C]-1.73063876319702[/C][/ROW]
[ROW][C]73[/C][C]4334.3[/C][C]4332.73101374313[/C][C]1.56898625686881[/C][/ROW]
[ROW][C]74[/C][C]4356[/C][C]4352.37328321141[/C][C]3.62671678859078[/C][/ROW]
[ROW][C]75[/C][C]4374[/C][C]4376.87653303087[/C][C]-2.87653303086518[/C][/ROW]
[ROW][C]76[/C][C]4395.5[/C][C]4393.23562729915[/C][C]2.2643727008508[/C][/ROW]
[/TABLE]
Source: https://freestatistics.org/blog/index.php?pk=42216&T=2

Globally Unique Identifier (entire table): ba.freestatistics.org/blog/index.php?pk=42216&T=2

As an alternative you can also use a QR Code:  

The GUIDs for individual cells are displayed in the table below:

Interpolation Forecasts of Exponential Smoothing
tObservedFittedResiduals
53833.33808.7524.5500000000002
63844.83861.02642532958-16.2264253295775
73851.33861.11617551798-9.81617551798354
83851.83862.40470474576-10.6047047457605
93854.13852.280461911281.81953808872413
103858.43860.18498607354-1.78498607354140
113861.63862.16670331421-0.56670331421401
123856.33865.58508257386-9.28508257386284
133855.83851.43655379234.36344620769842
143860.43857.254284121093.14571587890759
153855.13862.59431297464-7.49431297464389
163839.53853.46543302548-13.9654330254793
1738333827.161769117675.83823088233294
183833.63826.878211444266.7217885557402
193826.83829.81548209852-3.01548209852126
203818.23822.01384482077-3.81384482077237
213811.43809.734912056521.66508794347692
223806.83806.444568561490.355431438508731
233810.33799.9862901454710.3137098545340
243818.23809.942086593678.25791340632577
253858.93821.7241420083237.17585799168
263867.83885.72804787394-17.9280478739352
273872.33884.89058072043-12.5905807204313
283873.33881.82302928699-8.52302928698646
293876.73877.84471515636-1.14471515636251
303882.63878.745541189413.85445881059331
313883.53887.93194746546-4.43194746546169
323882.23886.71367232607-4.51367232606708
333888.13883.178155090494.92184490950831
343893.73889.99456689233.70543310769926
353901.93898.461708298233.43829170177150
363914.33909.252041643765.04795835623554
373930.33925.492114957914.8078850420884
383948.33942.294863286866.00513671314275
393971.53964.466932870857.03306712915264
403990.13992.43116843819-2.33116843819334
4139934010.89080592883-17.8908059288269
4239984001.8211434419-3.82114344190131
434015.84004.5159230060911.2840769939053
444041.24028.4757020873612.7242979126399
454060.74061.93202184942-1.23202184942102
464076.74080.71986042767-4.01986042766794
4741034095.131831735687.86816826431914
484125.34125.063637657410.236362342592656
494139.74147.66697093726-7.96697093725743
504146.74157.58581576732-10.8858157673249
5141584159.58927061899-1.58927061898885
524155.14168.08249039810-12.9824903980953
534144.84157.74080674139-12.9408067413915
544148.24139.851078936248.348921063759
554142.54149.18087474119-6.68087474118784
564142.14137.80337207074.29662792929685
574145.44139.769567729445.63043227056005
584146.34147.50243316825-1.20243316824599
594143.54148.24544058326-4.7454405832641
604149.24141.602055129477.59794487053114
614158.94151.12542544387.77457455619697
624166.14166.211285515-0.11128551499678
634179.14174.108777397264.99122260274453
644194.44189.41818173934.98181826069685
654211.74206.987944856874.71205514312805
664226.34227.48915003755-1.18915003755046
674235.84242.65699375052-6.85699375052172
684243.64247.65521403769-4.05521403769308
694258.74252.184760194416.51523980558704
704278.24270.793328806787.40667119322461
7142984295.688010407552.31198959245285
724315.14316.8306387632-1.73063876319702
734334.34332.731013743131.56898625686881
7443564352.373283211413.62671678859078
7543744376.87653303087-2.87653303086518
764395.54393.235627299152.2643727008508


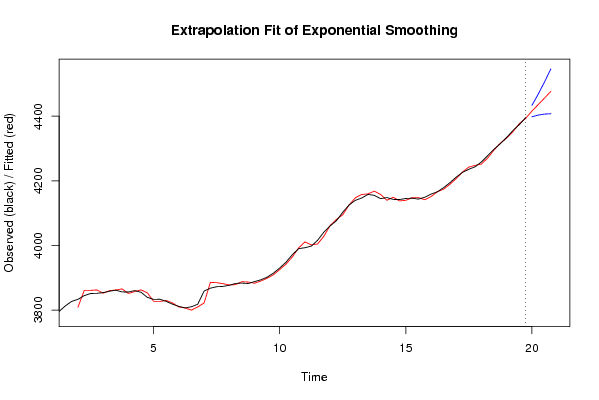
Extrapolation Forecasts of Exponential Smoothing
tForecast95% Lower Bound95% Upper Bound
774415.835727819424398.263694706764433.40776093207
784435.878662370794403.458652121224468.29867262035
794456.255250504764406.503358985724506.00714202381
804476.948893717464407.65537938964546.24240804533

\begin{tabular}{lllllllll}
\hline
Extrapolation Forecasts of Exponential Smoothing \tabularnewline
t & Forecast & 95% Lower Bound & 95% Upper Bound \tabularnewline
77 & 4415.83572781942 & 4398.26369470676 & 4433.40776093207 \tabularnewline
78 & 4435.87866237079 & 4403.45865212122 & 4468.29867262035 \tabularnewline
79 & 4456.25525050476 & 4406.50335898572 & 4506.00714202381 \tabularnewline
80 & 4476.94889371746 & 4407.6553793896 & 4546.24240804533 \tabularnewline
\hline
\end{tabular}
%Source: https://freestatistics.org/blog/index.php?pk=42216&T=3

[TABLE]
[ROW][C]Extrapolation Forecasts of Exponential Smoothing[/C][/ROW]
[ROW][C]t[/C][C]Forecast[/C][C]95% Lower Bound[/C][C]95% Upper Bound[/C][/ROW]
[ROW][C]77[/C][C]4415.83572781942[/C][C]4398.26369470676[/C][C]4433.40776093207[/C][/ROW]
[ROW][C]78[/C][C]4435.87866237079[/C][C]4403.45865212122[/C][C]4468.29867262035[/C][/ROW]
[ROW][C]79[/C][C]4456.25525050476[/C][C]4406.50335898572[/C][C]4506.00714202381[/C][/ROW]
[ROW][C]80[/C][C]4476.94889371746[/C][C]4407.6553793896[/C][C]4546.24240804533[/C][/ROW]
[/TABLE]
Source: https://freestatistics.org/blog/index.php?pk=42216&T=3

Globally Unique Identifier (entire table): ba.freestatistics.org/blog/index.php?pk=42216&T=3

As an alternative you can also use a QR Code:  

The GUIDs for individual cells are displayed in the table below:

Extrapolation Forecasts of Exponential Smoothing
tForecast95% Lower Bound95% Upper Bound
774415.835727819424398.263694706764433.40776093207
784435.878662370794403.458652121224468.29867262035
794456.255250504764406.503358985724506.00714202381
804476.948893717464407.65537938964546.24240804533


Parameters (Session):
par1 = 48 ; par2 = 1 ; par3 = 1 ; par4 = 0 ; par5 = 4 ;
Parameters (R input):
par1 = 4 ; par2 = Triple ; par3 = additive ;
R code (references can be found in the software module):
par1 <- as.numeric(par1)
if (par2 == 'Single') K <- 1
if (par2 == 'Double') K <- 2
if (par2 == 'Triple') K <- par1
nx <- length(x)
nxmK <- nx - K
x <- ts(x, frequency = par1)
if (par2 == 'Single') fit <- HoltWinters(x, gamma=0, beta=0)
if (par2 == 'Double') fit <- HoltWinters(x, gamma=0)
if (par2 == 'Triple') fit <- HoltWinters(x, seasonal=par3)
fit
myresid <- x - fit$fitted[,'xhat']
bitmap(file='test1.png')
op <- par(mfrow=c(2,1))
plot(fit,ylab='Observed (black) / Fitted (red)',main='Interpolation Fit of Exponential Smoothing')
plot(myresid,ylab='Residuals',main='Interpolation Prediction Errors')
par(op)
dev.off()
bitmap(file='test2.png')
p <- predict(fit, par1, prediction.interval=TRUE)
np <- length(p[,1])
plot(fit,p,ylab='Observed (black) / Fitted (red)',main='Extrapolation Fit of Exponential Smoothing')
dev.off()
bitmap(file='test3.png')
op <- par(mfrow = c(2,2))
acf(as.numeric(myresid),lag.max = nx/2,main='Residual ACF')
spectrum(myresid,main='Residals Periodogram')
cpgram(myresid,main='Residal Cumulative Periodogram')
qqnorm(myresid,main='Residual Normal QQ Plot')
qqline(myresid)
par(op)
dev.off()
load(file='createtable')
a<-table.start()
a<-table.row.start(a)
a<-table.element(a,'Estimated Parameters of Exponential Smoothing',2,TRUE)
a<-table.row.end(a)
a<-table.row.start(a)
a<-table.element(a,'Parameter',header=TRUE)
a<-table.element(a,'Value',header=TRUE)
a<-table.row.end(a)
a<-table.row.start(a)
a<-table.element(a,'alpha',header=TRUE)
a<-table.element(a,fit$alpha)
a<-table.row.end(a)
a<-table.row.start(a)
a<-table.element(a,'beta',header=TRUE)
a<-table.element(a,fit$beta)
a<-table.row.end(a)
a<-table.row.start(a)
a<-table.element(a,'gamma',header=TRUE)
a<-table.element(a,fit$gamma)
a<-table.row.end(a)
a<-table.end(a)
table.save(a,file='mytable.tab')
a<-table.start()
a<-table.row.start(a)
a<-table.element(a,'Interpolation Forecasts of Exponential Smoothing',4,TRUE)
a<-table.row.end(a)
a<-table.row.start(a)
a<-table.element(a,'t',header=TRUE)
a<-table.element(a,'Observed',header=TRUE)
a<-table.element(a,'Fitted',header=TRUE)
a<-table.element(a,'Residuals',header=TRUE)
a<-table.row.end(a)
for (i in 1:nxmK) {
a<-table.row.start(a)
a<-table.element(a,i+K,header=TRUE)
a<-table.element(a,x[i+K])
a<-table.element(a,fit$fitted[i,'xhat'])
a<-table.element(a,myresid[i])
a<-table.row.end(a)
}
a<-table.end(a)
table.save(a,file='mytable1.tab')
a<-table.start()
a<-table.row.start(a)
a<-table.element(a,'Extrapolation Forecasts of Exponential Smoothing',4,TRUE)
a<-table.row.end(a)
a<-table.row.start(a)
a<-table.element(a,'t',header=TRUE)
a<-table.element(a,'Forecast',header=TRUE)
a<-table.element(a,'95% Lower Bound',header=TRUE)
a<-table.element(a,'95% Upper Bound',header=TRUE)
a<-table.row.end(a)
for (i in 1:np) {
a<-table.row.start(a)
a<-table.element(a,nx+i,header=TRUE)
a<-table.element(a,p[i,'fit'])
a<-table.element(a,p[i,'lwr'])
a<-table.element(a,p[i,'upr'])
a<-table.row.end(a)
}
a<-table.end(a)
table.save(a,file='mytable2.tab')