Free Statistics

of Irreproducible Research!

Author's title

Author*Unverified author*
R Software Modulerwasp_exponentialsmoothing.wasp
Title produced by softwareExponential Smoothing
Date of computationSun, 07 Jun 2009 11:38:07 -0600
Cite this page as followsStatistical Computations at FreeStatistics.org, Office for Research Development and Education, URL https://freestatistics.org/blog/index.php?v=date/2009/Jun/07/t1244396369m9qoogd6dwqhxc3.htm/, Retrieved Sun, 12 May 2024 22:35:56 +0000
Statistical Computations at FreeStatistics.org, Office for Research Development and Education, URL https://freestatistics.org/blog/index.php?pk=42214, Retrieved Sun, 12 May 2024 22:35:56 +0000
QR Codes:

Original text written by user:
IsPrivate?No (this computation is public)
User-defined keywords
Estimated Impact115
Family? (F = Feedback message, R = changed R code, M = changed R Module, P = changed Parameters, D = changed Data)
-     [Exponential Smoothing] [Opgave 10 Oefenin...] [2009-06-02 12:23:00] [74be16979710d4c4e7c6647856088456]
-   PD  [Exponential Smoothing] [Opgave 10 Oefenin...] [2009-06-02 19:12:36] [74be16979710d4c4e7c6647856088456]
-   P       [Exponential Smoothing] [Opgave 10 Oefenin...] [2009-06-07 17:38:07] [d41d8cd98f00b204e9800998ecf8427e] [Current]
Feedback Forum

Post a new message
Dataseries X:
3779.7
3795.5
3813.1
3826.9
3833.3
3844.8
3851.3
3851.8
3854.1
3858.4
3861.6
3856.3
3855.8
3860.4
3855.1
3839.5
3833
3833.6
3826.8
3818.2
3811.4
3806.8
3810.3
3818.2
3858.9
3867.8
3872.3
3873.3
3876.7
3882.6
3883.5
3882.2
3888.1
3893.7
3901.9
3914.3
3930.3
3948.3
3971.5
3990.1
3993
3998
4015.8
4041.2
4060.7
4076.7
4103
4125.3
4139.7
4146.7
4158
4155.1
4144.8
4148.2
4142.5
4142.1
4145.4
4146.3
4143.5
4149.2
4158.9
4166.1
4179.1
4194.4
4211.7
4226.3
4235.8
4243.6
4258.7
4278.2
4298
4315.1
4334.3
4356
4374
4395.5


Summary of computational transaction
Raw Inputview raw input (R code)
Raw Outputview raw output of R engine
Computing time3 seconds
R Server'George Udny Yule' @ 72.249.76.132

\begin{tabular}{lllllllll}
\hline
Summary of computational transaction \tabularnewline
Raw Input & view raw input (R code)  \tabularnewline
Raw Output & view raw output of R engine  \tabularnewline
Computing time & 3 seconds \tabularnewline
R Server & 'George Udny Yule' @ 72.249.76.132 \tabularnewline
\hline
\end{tabular}
%Source: https://freestatistics.org/blog/index.php?pk=42214&T=0

[TABLE]
[ROW][C]Summary of computational transaction[/C][/ROW]
[ROW][C]Raw Input[/C][C]view raw input (R code) [/C][/ROW]
[ROW][C]Raw Output[/C][C]view raw output of R engine [/C][/ROW]
[ROW][C]Computing time[/C][C]3 seconds[/C][/ROW]
[ROW][C]R Server[/C][C]'George Udny Yule' @ 72.249.76.132[/C][/ROW]
[/TABLE]
Source: https://freestatistics.org/blog/index.php?pk=42214&T=0

Globally Unique Identifier (entire table): ba.freestatistics.org/blog/index.php?pk=42214&T=0

As an alternative you can also use a QR Code:  

The GUIDs for individual cells are displayed in the table below:

Summary of computational transaction
Raw Inputview raw input (R code)
Raw Outputview raw output of R engine
Computing time3 seconds
R Server'George Udny Yule' @ 72.249.76.132


Estimated Parameters of Exponential Smoothing
ParameterValue
alpha0.953285713274124
beta0.626443540095629
gamma1

\begin{tabular}{lllllllll}
\hline
Estimated Parameters of Exponential Smoothing \tabularnewline
Parameter & Value \tabularnewline
alpha & 0.953285713274124 \tabularnewline
beta & 0.626443540095629 \tabularnewline
gamma & 1 \tabularnewline
\hline
\end{tabular}
%Source: https://freestatistics.org/blog/index.php?pk=42214&T=1

[TABLE]
[ROW][C]Estimated Parameters of Exponential Smoothing[/C][/ROW]
[ROW][C]Parameter[/C][C]Value[/C][/ROW]
[ROW][C]alpha[/C][C]0.953285713274124[/C][/ROW]
[ROW][C]beta[/C][C]0.626443540095629[/C][/ROW]
[ROW][C]gamma[/C][C]1[/C][/ROW]
[/TABLE]
Source: https://freestatistics.org/blog/index.php?pk=42214&T=1

Globally Unique Identifier (entire table): ba.freestatistics.org/blog/index.php?pk=42214&T=1

As an alternative you can also use a QR Code:  

The GUIDs for individual cells are displayed in the table below:

Estimated Parameters of Exponential Smoothing
ParameterValue
alpha0.953285713274124
beta0.626443540095629
gamma1


Interpolation Forecasts of Exponential Smoothing
tObservedFittedResiduals
53833.33808.7524.5500000000002
63844.83861.02642532990-16.2264253299045
73851.33861.11617551792-9.81617551792124
83851.83862.40470474558-10.6047047455818
93854.13852.280461911061.81953808893832
103858.43860.18498607344-1.78498607344136
113861.63862.1667033142-0.566703314202186
123856.33865.58508257384-9.28508257383919
133855.83851.436553792174.36344620782575
143860.43857.254284121053.14571587895216
153855.13862.59431297472-7.49431297472165
163839.53853.46543302540-13.9654330254048
1738333827.161769117465.83823088254212
183833.63826.878211444196.72178855581296
193826.83829.81548209863-3.01548209863267
203818.23822.01384482079-3.8138448207892
213811.43809.73491205651.66508794350375
223806.83806.444568561430.355431438574215
233810.33799.9862901454810.3137098545189
243818.23809.942086593848.2579134061607
253858.93821.7241420085337.1758579914713
263867.83885.72804787444-17.9280478744431
273872.33884.89058072046-12.5905807204554
283873.33881.82302928681-8.52302928681229
293876.73877.8447151562-1.14471515620153
303882.63878.745541189213.85445881078613
313883.53887.93194746552-4.43194746552081
323882.23886.71367232604-4.51367232604298
333888.13883.178155090444.92184490955697
343893.73889.994566892243.70543310776475
353901.93898.461708298323.43829170167783
363914.33909.252041643875.04795835612686
373930.33925.492114958054.8078850419497
383948.33942.294863286876.00513671313138
393971.53964.466932870997.03306712901076
403990.13992.43116843838-2.3311684383757
4139934010.8908059289-17.8908059288974
4239984001.82114344158-3.82114344158117
434015.84004.5159230059411.2840769940576
444041.24028.4757020874812.7242979125190
454060.74061.93202184969-1.23202184968522
464076.74080.71986042768-4.01986042768431
4741034095.131831735657.86816826435324
484125.34125.063637657510.236362342488974
494139.74147.66697093734-7.96697093734292
504146.74157.58581576719-10.8858157671903
5141584159.5892706188-1.58927061879604
524155.14168.08249039799-12.9824903979925
534144.84157.74080674122-12.9408067412214
544148.24139.851078935948.34892106405823
554142.54149.18087474119-6.68087474118511
564142.14137.803372070624.29662792938234
574145.44139.769567729515.63043227049184
584146.34147.50243316831-1.2024331683142
594143.54148.24544058326-4.74544058326228
604149.24141.602055129427.5979448705848
614158.94151.125425443927.77457455608328
624166.14166.21128551512-0.111285515118652
634179.14174.10877739734.99122260270451
644194.44189.41818173944.98181826060045
654211.74206.987944857004.71205514299527
664226.34227.48915003764-1.18915003763595
674235.84242.65699375054-6.85699375053628
684243.64247.65521403761-4.05521403761304
694258.74252.184760194356.51523980565435
704278.24270.793328806807.40667119319551
7142984295.688010407662.31198959233916
724315.14316.83063876329-1.73063876329161
734334.34332.731013743171.56898625683061
7443564352.373283211413.62671678859351
7543744376.87653303091-2.87653303090610
764395.54393.235627299152.26437270085262

\begin{tabular}{lllllllll}
\hline
Interpolation Forecasts of Exponential Smoothing \tabularnewline
t & Observed & Fitted & Residuals \tabularnewline
5 & 3833.3 & 3808.75 & 24.5500000000002 \tabularnewline
6 & 3844.8 & 3861.02642532990 & -16.2264253299045 \tabularnewline
7 & 3851.3 & 3861.11617551792 & -9.81617551792124 \tabularnewline
8 & 3851.8 & 3862.40470474558 & -10.6047047455818 \tabularnewline
9 & 3854.1 & 3852.28046191106 & 1.81953808893832 \tabularnewline
10 & 3858.4 & 3860.18498607344 & -1.78498607344136 \tabularnewline
11 & 3861.6 & 3862.1667033142 & -0.566703314202186 \tabularnewline
12 & 3856.3 & 3865.58508257384 & -9.28508257383919 \tabularnewline
13 & 3855.8 & 3851.43655379217 & 4.36344620782575 \tabularnewline
14 & 3860.4 & 3857.25428412105 & 3.14571587895216 \tabularnewline
15 & 3855.1 & 3862.59431297472 & -7.49431297472165 \tabularnewline
16 & 3839.5 & 3853.46543302540 & -13.9654330254048 \tabularnewline
17 & 3833 & 3827.16176911746 & 5.83823088254212 \tabularnewline
18 & 3833.6 & 3826.87821144419 & 6.72178855581296 \tabularnewline
19 & 3826.8 & 3829.81548209863 & -3.01548209863267 \tabularnewline
20 & 3818.2 & 3822.01384482079 & -3.8138448207892 \tabularnewline
21 & 3811.4 & 3809.7349120565 & 1.66508794350375 \tabularnewline
22 & 3806.8 & 3806.44456856143 & 0.355431438574215 \tabularnewline
23 & 3810.3 & 3799.98629014548 & 10.3137098545189 \tabularnewline
24 & 3818.2 & 3809.94208659384 & 8.2579134061607 \tabularnewline
25 & 3858.9 & 3821.72414200853 & 37.1758579914713 \tabularnewline
26 & 3867.8 & 3885.72804787444 & -17.9280478744431 \tabularnewline
27 & 3872.3 & 3884.89058072046 & -12.5905807204554 \tabularnewline
28 & 3873.3 & 3881.82302928681 & -8.52302928681229 \tabularnewline
29 & 3876.7 & 3877.8447151562 & -1.14471515620153 \tabularnewline
30 & 3882.6 & 3878.74554118921 & 3.85445881078613 \tabularnewline
31 & 3883.5 & 3887.93194746552 & -4.43194746552081 \tabularnewline
32 & 3882.2 & 3886.71367232604 & -4.51367232604298 \tabularnewline
33 & 3888.1 & 3883.17815509044 & 4.92184490955697 \tabularnewline
34 & 3893.7 & 3889.99456689224 & 3.70543310776475 \tabularnewline
35 & 3901.9 & 3898.46170829832 & 3.43829170167783 \tabularnewline
36 & 3914.3 & 3909.25204164387 & 5.04795835612686 \tabularnewline
37 & 3930.3 & 3925.49211495805 & 4.8078850419497 \tabularnewline
38 & 3948.3 & 3942.29486328687 & 6.00513671313138 \tabularnewline
39 & 3971.5 & 3964.46693287099 & 7.03306712901076 \tabularnewline
40 & 3990.1 & 3992.43116843838 & -2.3311684383757 \tabularnewline
41 & 3993 & 4010.8908059289 & -17.8908059288974 \tabularnewline
42 & 3998 & 4001.82114344158 & -3.82114344158117 \tabularnewline
43 & 4015.8 & 4004.51592300594 & 11.2840769940576 \tabularnewline
44 & 4041.2 & 4028.47570208748 & 12.7242979125190 \tabularnewline
45 & 4060.7 & 4061.93202184969 & -1.23202184968522 \tabularnewline
46 & 4076.7 & 4080.71986042768 & -4.01986042768431 \tabularnewline
47 & 4103 & 4095.13183173565 & 7.86816826435324 \tabularnewline
48 & 4125.3 & 4125.06363765751 & 0.236362342488974 \tabularnewline
49 & 4139.7 & 4147.66697093734 & -7.96697093734292 \tabularnewline
50 & 4146.7 & 4157.58581576719 & -10.8858157671903 \tabularnewline
51 & 4158 & 4159.5892706188 & -1.58927061879604 \tabularnewline
52 & 4155.1 & 4168.08249039799 & -12.9824903979925 \tabularnewline
53 & 4144.8 & 4157.74080674122 & -12.9408067412214 \tabularnewline
54 & 4148.2 & 4139.85107893594 & 8.34892106405823 \tabularnewline
55 & 4142.5 & 4149.18087474119 & -6.68087474118511 \tabularnewline
56 & 4142.1 & 4137.80337207062 & 4.29662792938234 \tabularnewline
57 & 4145.4 & 4139.76956772951 & 5.63043227049184 \tabularnewline
58 & 4146.3 & 4147.50243316831 & -1.2024331683142 \tabularnewline
59 & 4143.5 & 4148.24544058326 & -4.74544058326228 \tabularnewline
60 & 4149.2 & 4141.60205512942 & 7.5979448705848 \tabularnewline
61 & 4158.9 & 4151.12542544392 & 7.77457455608328 \tabularnewline
62 & 4166.1 & 4166.21128551512 & -0.111285515118652 \tabularnewline
63 & 4179.1 & 4174.1087773973 & 4.99122260270451 \tabularnewline
64 & 4194.4 & 4189.4181817394 & 4.98181826060045 \tabularnewline
65 & 4211.7 & 4206.98794485700 & 4.71205514299527 \tabularnewline
66 & 4226.3 & 4227.48915003764 & -1.18915003763595 \tabularnewline
67 & 4235.8 & 4242.65699375054 & -6.85699375053628 \tabularnewline
68 & 4243.6 & 4247.65521403761 & -4.05521403761304 \tabularnewline
69 & 4258.7 & 4252.18476019435 & 6.51523980565435 \tabularnewline
70 & 4278.2 & 4270.79332880680 & 7.40667119319551 \tabularnewline
71 & 4298 & 4295.68801040766 & 2.31198959233916 \tabularnewline
72 & 4315.1 & 4316.83063876329 & -1.73063876329161 \tabularnewline
73 & 4334.3 & 4332.73101374317 & 1.56898625683061 \tabularnewline
74 & 4356 & 4352.37328321141 & 3.62671678859351 \tabularnewline
75 & 4374 & 4376.87653303091 & -2.87653303090610 \tabularnewline
76 & 4395.5 & 4393.23562729915 & 2.26437270085262 \tabularnewline
\hline
\end{tabular}
%Source: https://freestatistics.org/blog/index.php?pk=42214&T=2

[TABLE]
[ROW][C]Interpolation Forecasts of Exponential Smoothing[/C][/ROW]
[ROW][C]t[/C][C]Observed[/C][C]Fitted[/C][C]Residuals[/C][/ROW]
[ROW][C]5[/C][C]3833.3[/C][C]3808.75[/C][C]24.5500000000002[/C][/ROW]
[ROW][C]6[/C][C]3844.8[/C][C]3861.02642532990[/C][C]-16.2264253299045[/C][/ROW]
[ROW][C]7[/C][C]3851.3[/C][C]3861.11617551792[/C][C]-9.81617551792124[/C][/ROW]
[ROW][C]8[/C][C]3851.8[/C][C]3862.40470474558[/C][C]-10.6047047455818[/C][/ROW]
[ROW][C]9[/C][C]3854.1[/C][C]3852.28046191106[/C][C]1.81953808893832[/C][/ROW]
[ROW][C]10[/C][C]3858.4[/C][C]3860.18498607344[/C][C]-1.78498607344136[/C][/ROW]
[ROW][C]11[/C][C]3861.6[/C][C]3862.1667033142[/C][C]-0.566703314202186[/C][/ROW]
[ROW][C]12[/C][C]3856.3[/C][C]3865.58508257384[/C][C]-9.28508257383919[/C][/ROW]
[ROW][C]13[/C][C]3855.8[/C][C]3851.43655379217[/C][C]4.36344620782575[/C][/ROW]
[ROW][C]14[/C][C]3860.4[/C][C]3857.25428412105[/C][C]3.14571587895216[/C][/ROW]
[ROW][C]15[/C][C]3855.1[/C][C]3862.59431297472[/C][C]-7.49431297472165[/C][/ROW]
[ROW][C]16[/C][C]3839.5[/C][C]3853.46543302540[/C][C]-13.9654330254048[/C][/ROW]
[ROW][C]17[/C][C]3833[/C][C]3827.16176911746[/C][C]5.83823088254212[/C][/ROW]
[ROW][C]18[/C][C]3833.6[/C][C]3826.87821144419[/C][C]6.72178855581296[/C][/ROW]
[ROW][C]19[/C][C]3826.8[/C][C]3829.81548209863[/C][C]-3.01548209863267[/C][/ROW]
[ROW][C]20[/C][C]3818.2[/C][C]3822.01384482079[/C][C]-3.8138448207892[/C][/ROW]
[ROW][C]21[/C][C]3811.4[/C][C]3809.7349120565[/C][C]1.66508794350375[/C][/ROW]
[ROW][C]22[/C][C]3806.8[/C][C]3806.44456856143[/C][C]0.355431438574215[/C][/ROW]
[ROW][C]23[/C][C]3810.3[/C][C]3799.98629014548[/C][C]10.3137098545189[/C][/ROW]
[ROW][C]24[/C][C]3818.2[/C][C]3809.94208659384[/C][C]8.2579134061607[/C][/ROW]
[ROW][C]25[/C][C]3858.9[/C][C]3821.72414200853[/C][C]37.1758579914713[/C][/ROW]
[ROW][C]26[/C][C]3867.8[/C][C]3885.72804787444[/C][C]-17.9280478744431[/C][/ROW]
[ROW][C]27[/C][C]3872.3[/C][C]3884.89058072046[/C][C]-12.5905807204554[/C][/ROW]
[ROW][C]28[/C][C]3873.3[/C][C]3881.82302928681[/C][C]-8.52302928681229[/C][/ROW]
[ROW][C]29[/C][C]3876.7[/C][C]3877.8447151562[/C][C]-1.14471515620153[/C][/ROW]
[ROW][C]30[/C][C]3882.6[/C][C]3878.74554118921[/C][C]3.85445881078613[/C][/ROW]
[ROW][C]31[/C][C]3883.5[/C][C]3887.93194746552[/C][C]-4.43194746552081[/C][/ROW]
[ROW][C]32[/C][C]3882.2[/C][C]3886.71367232604[/C][C]-4.51367232604298[/C][/ROW]
[ROW][C]33[/C][C]3888.1[/C][C]3883.17815509044[/C][C]4.92184490955697[/C][/ROW]
[ROW][C]34[/C][C]3893.7[/C][C]3889.99456689224[/C][C]3.70543310776475[/C][/ROW]
[ROW][C]35[/C][C]3901.9[/C][C]3898.46170829832[/C][C]3.43829170167783[/C][/ROW]
[ROW][C]36[/C][C]3914.3[/C][C]3909.25204164387[/C][C]5.04795835612686[/C][/ROW]
[ROW][C]37[/C][C]3930.3[/C][C]3925.49211495805[/C][C]4.8078850419497[/C][/ROW]
[ROW][C]38[/C][C]3948.3[/C][C]3942.29486328687[/C][C]6.00513671313138[/C][/ROW]
[ROW][C]39[/C][C]3971.5[/C][C]3964.46693287099[/C][C]7.03306712901076[/C][/ROW]
[ROW][C]40[/C][C]3990.1[/C][C]3992.43116843838[/C][C]-2.3311684383757[/C][/ROW]
[ROW][C]41[/C][C]3993[/C][C]4010.8908059289[/C][C]-17.8908059288974[/C][/ROW]
[ROW][C]42[/C][C]3998[/C][C]4001.82114344158[/C][C]-3.82114344158117[/C][/ROW]
[ROW][C]43[/C][C]4015.8[/C][C]4004.51592300594[/C][C]11.2840769940576[/C][/ROW]
[ROW][C]44[/C][C]4041.2[/C][C]4028.47570208748[/C][C]12.7242979125190[/C][/ROW]
[ROW][C]45[/C][C]4060.7[/C][C]4061.93202184969[/C][C]-1.23202184968522[/C][/ROW]
[ROW][C]46[/C][C]4076.7[/C][C]4080.71986042768[/C][C]-4.01986042768431[/C][/ROW]
[ROW][C]47[/C][C]4103[/C][C]4095.13183173565[/C][C]7.86816826435324[/C][/ROW]
[ROW][C]48[/C][C]4125.3[/C][C]4125.06363765751[/C][C]0.236362342488974[/C][/ROW]
[ROW][C]49[/C][C]4139.7[/C][C]4147.66697093734[/C][C]-7.96697093734292[/C][/ROW]
[ROW][C]50[/C][C]4146.7[/C][C]4157.58581576719[/C][C]-10.8858157671903[/C][/ROW]
[ROW][C]51[/C][C]4158[/C][C]4159.5892706188[/C][C]-1.58927061879604[/C][/ROW]
[ROW][C]52[/C][C]4155.1[/C][C]4168.08249039799[/C][C]-12.9824903979925[/C][/ROW]
[ROW][C]53[/C][C]4144.8[/C][C]4157.74080674122[/C][C]-12.9408067412214[/C][/ROW]
[ROW][C]54[/C][C]4148.2[/C][C]4139.85107893594[/C][C]8.34892106405823[/C][/ROW]
[ROW][C]55[/C][C]4142.5[/C][C]4149.18087474119[/C][C]-6.68087474118511[/C][/ROW]
[ROW][C]56[/C][C]4142.1[/C][C]4137.80337207062[/C][C]4.29662792938234[/C][/ROW]
[ROW][C]57[/C][C]4145.4[/C][C]4139.76956772951[/C][C]5.63043227049184[/C][/ROW]
[ROW][C]58[/C][C]4146.3[/C][C]4147.50243316831[/C][C]-1.2024331683142[/C][/ROW]
[ROW][C]59[/C][C]4143.5[/C][C]4148.24544058326[/C][C]-4.74544058326228[/C][/ROW]
[ROW][C]60[/C][C]4149.2[/C][C]4141.60205512942[/C][C]7.5979448705848[/C][/ROW]
[ROW][C]61[/C][C]4158.9[/C][C]4151.12542544392[/C][C]7.77457455608328[/C][/ROW]
[ROW][C]62[/C][C]4166.1[/C][C]4166.21128551512[/C][C]-0.111285515118652[/C][/ROW]
[ROW][C]63[/C][C]4179.1[/C][C]4174.1087773973[/C][C]4.99122260270451[/C][/ROW]
[ROW][C]64[/C][C]4194.4[/C][C]4189.4181817394[/C][C]4.98181826060045[/C][/ROW]
[ROW][C]65[/C][C]4211.7[/C][C]4206.98794485700[/C][C]4.71205514299527[/C][/ROW]
[ROW][C]66[/C][C]4226.3[/C][C]4227.48915003764[/C][C]-1.18915003763595[/C][/ROW]
[ROW][C]67[/C][C]4235.8[/C][C]4242.65699375054[/C][C]-6.85699375053628[/C][/ROW]
[ROW][C]68[/C][C]4243.6[/C][C]4247.65521403761[/C][C]-4.05521403761304[/C][/ROW]
[ROW][C]69[/C][C]4258.7[/C][C]4252.18476019435[/C][C]6.51523980565435[/C][/ROW]
[ROW][C]70[/C][C]4278.2[/C][C]4270.79332880680[/C][C]7.40667119319551[/C][/ROW]
[ROW][C]71[/C][C]4298[/C][C]4295.68801040766[/C][C]2.31198959233916[/C][/ROW]
[ROW][C]72[/C][C]4315.1[/C][C]4316.83063876329[/C][C]-1.73063876329161[/C][/ROW]
[ROW][C]73[/C][C]4334.3[/C][C]4332.73101374317[/C][C]1.56898625683061[/C][/ROW]
[ROW][C]74[/C][C]4356[/C][C]4352.37328321141[/C][C]3.62671678859351[/C][/ROW]
[ROW][C]75[/C][C]4374[/C][C]4376.87653303091[/C][C]-2.87653303090610[/C][/ROW]
[ROW][C]76[/C][C]4395.5[/C][C]4393.23562729915[/C][C]2.26437270085262[/C][/ROW]
[/TABLE]
Source: https://freestatistics.org/blog/index.php?pk=42214&T=2

Globally Unique Identifier (entire table): ba.freestatistics.org/blog/index.php?pk=42214&T=2

As an alternative you can also use a QR Code:  

The GUIDs for individual cells are displayed in the table below:

Interpolation Forecasts of Exponential Smoothing
tObservedFittedResiduals
53833.33808.7524.5500000000002
63844.83861.02642532990-16.2264253299045
73851.33861.11617551792-9.81617551792124
83851.83862.40470474558-10.6047047455818
93854.13852.280461911061.81953808893832
103858.43860.18498607344-1.78498607344136
113861.63862.1667033142-0.566703314202186
123856.33865.58508257384-9.28508257383919
133855.83851.436553792174.36344620782575
143860.43857.254284121053.14571587895216
153855.13862.59431297472-7.49431297472165
163839.53853.46543302540-13.9654330254048
1738333827.161769117465.83823088254212
183833.63826.878211444196.72178855581296
193826.83829.81548209863-3.01548209863267
203818.23822.01384482079-3.8138448207892
213811.43809.73491205651.66508794350375
223806.83806.444568561430.355431438574215
233810.33799.9862901454810.3137098545189
243818.23809.942086593848.2579134061607
253858.93821.7241420085337.1758579914713
263867.83885.72804787444-17.9280478744431
273872.33884.89058072046-12.5905807204554
283873.33881.82302928681-8.52302928681229
293876.73877.8447151562-1.14471515620153
303882.63878.745541189213.85445881078613
313883.53887.93194746552-4.43194746552081
323882.23886.71367232604-4.51367232604298
333888.13883.178155090444.92184490955697
343893.73889.994566892243.70543310776475
353901.93898.461708298323.43829170167783
363914.33909.252041643875.04795835612686
373930.33925.492114958054.8078850419497
383948.33942.294863286876.00513671313138
393971.53964.466932870997.03306712901076
403990.13992.43116843838-2.3311684383757
4139934010.8908059289-17.8908059288974
4239984001.82114344158-3.82114344158117
434015.84004.5159230059411.2840769940576
444041.24028.4757020874812.7242979125190
454060.74061.93202184969-1.23202184968522
464076.74080.71986042768-4.01986042768431
4741034095.131831735657.86816826435324
484125.34125.063637657510.236362342488974
494139.74147.66697093734-7.96697093734292
504146.74157.58581576719-10.8858157671903
5141584159.5892706188-1.58927061879604
524155.14168.08249039799-12.9824903979925
534144.84157.74080674122-12.9408067412214
544148.24139.851078935948.34892106405823
554142.54149.18087474119-6.68087474118511
564142.14137.803372070624.29662792938234
574145.44139.769567729515.63043227049184
584146.34147.50243316831-1.2024331683142
594143.54148.24544058326-4.74544058326228
604149.24141.602055129427.5979448705848
614158.94151.125425443927.77457455608328
624166.14166.21128551512-0.111285515118652
634179.14174.10877739734.99122260270451
644194.44189.41818173944.98181826060045
654211.74206.987944857004.71205514299527
664226.34227.48915003764-1.18915003763595
674235.84242.65699375054-6.85699375053628
684243.64247.65521403761-4.05521403761304
694258.74252.184760194356.51523980565435
704278.24270.793328806807.40667119319551
7142984295.688010407662.31198959233916
724315.14316.83063876329-1.73063876329161
734334.34332.731013743171.56898625683061
7443564352.373283211413.62671678859351
7543744376.87653303091-2.87653303090610
764395.54393.235627299152.26437270085262


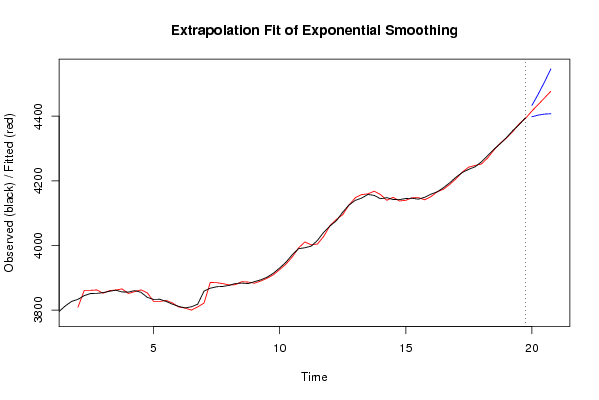
Extrapolation Forecasts of Exponential Smoothing
tForecast95% Lower Bound95% Upper Bound
774415.835727819474398.263694706824433.40776093212
784435.878662370864403.45865212114468.29867262062
794456.255250504844406.503358985314506.00714202438
804476.948893717574407.655379388864546.24240804628

\begin{tabular}{lllllllll}
\hline
Extrapolation Forecasts of Exponential Smoothing \tabularnewline
t & Forecast & 95% Lower Bound & 95% Upper Bound \tabularnewline
77 & 4415.83572781947 & 4398.26369470682 & 4433.40776093212 \tabularnewline
78 & 4435.87866237086 & 4403.4586521211 & 4468.29867262062 \tabularnewline
79 & 4456.25525050484 & 4406.50335898531 & 4506.00714202438 \tabularnewline
80 & 4476.94889371757 & 4407.65537938886 & 4546.24240804628 \tabularnewline
\hline
\end{tabular}
%Source: https://freestatistics.org/blog/index.php?pk=42214&T=3

[TABLE]
[ROW][C]Extrapolation Forecasts of Exponential Smoothing[/C][/ROW]
[ROW][C]t[/C][C]Forecast[/C][C]95% Lower Bound[/C][C]95% Upper Bound[/C][/ROW]
[ROW][C]77[/C][C]4415.83572781947[/C][C]4398.26369470682[/C][C]4433.40776093212[/C][/ROW]
[ROW][C]78[/C][C]4435.87866237086[/C][C]4403.4586521211[/C][C]4468.29867262062[/C][/ROW]
[ROW][C]79[/C][C]4456.25525050484[/C][C]4406.50335898531[/C][C]4506.00714202438[/C][/ROW]
[ROW][C]80[/C][C]4476.94889371757[/C][C]4407.65537938886[/C][C]4546.24240804628[/C][/ROW]
[/TABLE]
Source: https://freestatistics.org/blog/index.php?pk=42214&T=3

Globally Unique Identifier (entire table): ba.freestatistics.org/blog/index.php?pk=42214&T=3

As an alternative you can also use a QR Code:  

The GUIDs for individual cells are displayed in the table below:

Extrapolation Forecasts of Exponential Smoothing
tForecast95% Lower Bound95% Upper Bound
774415.835727819474398.263694706824433.40776093212
784435.878662370864403.45865212114468.29867262062
794456.255250504844406.503358985314506.00714202438
804476.948893717574407.655379388864546.24240804628


Parameters (Session):
par1 = 4 ; par2 = Triple ; par3 = additive ;
Parameters (R input):
par1 = 4 ; par2 = Triple ; par3 = additive ;
R code (references can be found in the software module):
par1 <- as.numeric(par1)
if (par2 == 'Single') K <- 1
if (par2 == 'Double') K <- 2
if (par2 == 'Triple') K <- par1
nx <- length(x)
nxmK <- nx - K
x <- ts(x, frequency = par1)
if (par2 == 'Single') fit <- HoltWinters(x, gamma=0, beta=0)
if (par2 == 'Double') fit <- HoltWinters(x, gamma=0)
if (par2 == 'Triple') fit <- HoltWinters(x, seasonal=par3)
fit
myresid <- x - fit$fitted[,'xhat']
bitmap(file='test1.png')
op <- par(mfrow=c(2,1))
plot(fit,ylab='Observed (black) / Fitted (red)',main='Interpolation Fit of Exponential Smoothing')
plot(myresid,ylab='Residuals',main='Interpolation Prediction Errors')
par(op)
dev.off()
bitmap(file='test2.png')
p <- predict(fit, par1, prediction.interval=TRUE)
np <- length(p[,1])
plot(fit,p,ylab='Observed (black) / Fitted (red)',main='Extrapolation Fit of Exponential Smoothing')
dev.off()
bitmap(file='test3.png')
op <- par(mfrow = c(2,2))
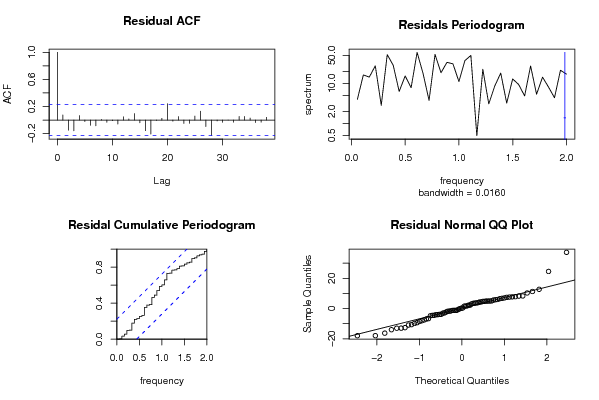
acf(as.numeric(myresid),lag.max = nx/2,main='Residual ACF')
spectrum(myresid,main='Residals Periodogram')
cpgram(myresid,main='Residal Cumulative Periodogram')
qqnorm(myresid,main='Residual Normal QQ Plot')
qqline(myresid)
par(op)
dev.off()
load(file='createtable')
a<-table.start()
a<-table.row.start(a)
a<-table.element(a,'Estimated Parameters of Exponential Smoothing',2,TRUE)
a<-table.row.end(a)
a<-table.row.start(a)
a<-table.element(a,'Parameter',header=TRUE)
a<-table.element(a,'Value',header=TRUE)
a<-table.row.end(a)
a<-table.row.start(a)
a<-table.element(a,'alpha',header=TRUE)
a<-table.element(a,fit$alpha)
a<-table.row.end(a)
a<-table.row.start(a)
a<-table.element(a,'beta',header=TRUE)
a<-table.element(a,fit$beta)
a<-table.row.end(a)
a<-table.row.start(a)
a<-table.element(a,'gamma',header=TRUE)
a<-table.element(a,fit$gamma)
a<-table.row.end(a)
a<-table.end(a)
table.save(a,file='mytable.tab')
a<-table.start()
a<-table.row.start(a)
a<-table.element(a,'Interpolation Forecasts of Exponential Smoothing',4,TRUE)
a<-table.row.end(a)
a<-table.row.start(a)
a<-table.element(a,'t',header=TRUE)
a<-table.element(a,'Observed',header=TRUE)
a<-table.element(a,'Fitted',header=TRUE)
a<-table.element(a,'Residuals',header=TRUE)
a<-table.row.end(a)
for (i in 1:nxmK) {
a<-table.row.start(a)
a<-table.element(a,i+K,header=TRUE)
a<-table.element(a,x[i+K])
a<-table.element(a,fit$fitted[i,'xhat'])
a<-table.element(a,myresid[i])
a<-table.row.end(a)
}
a<-table.end(a)
table.save(a,file='mytable1.tab')
a<-table.start()
a<-table.row.start(a)
a<-table.element(a,'Extrapolation Forecasts of Exponential Smoothing',4,TRUE)
a<-table.row.end(a)
a<-table.row.start(a)
a<-table.element(a,'t',header=TRUE)
a<-table.element(a,'Forecast',header=TRUE)
a<-table.element(a,'95% Lower Bound',header=TRUE)
a<-table.element(a,'95% Upper Bound',header=TRUE)
a<-table.row.end(a)
for (i in 1:np) {
a<-table.row.start(a)
a<-table.element(a,nx+i,header=TRUE)
a<-table.element(a,p[i,'fit'])
a<-table.element(a,p[i,'lwr'])
a<-table.element(a,p[i,'upr'])
a<-table.row.end(a)
}
a<-table.end(a)
table.save(a,file='mytable2.tab')