Free Statistics

of Irreproducible Research!

Author's title

Author*Unverified author*
R Software Modulerwasp_autocorrelation.wasp
Title produced by software(Partial) Autocorrelation Function
Date of computationSun, 07 Jun 2009 11:36:09 -0600
Cite this page as followsStatistical Computations at FreeStatistics.org, Office for Research Development and Education, URL https://freestatistics.org/blog/index.php?v=date/2009/Jun/07/t1244396238ncmzifsns5dtuto.htm/, Retrieved Mon, 13 May 2024 10:58:51 +0000
Statistical Computations at FreeStatistics.org, Office for Research Development and Education, URL https://freestatistics.org/blog/index.php?pk=42213, Retrieved Mon, 13 May 2024 10:58:51 +0000
QR Codes:

Original text written by user:
IsPrivate?No (this computation is public)
User-defined keywords
Estimated Impact93
Family? (F = Feedback message, R = changed R code, M = changed R Module, P = changed Parameters, D = changed Data)
-       [(Partial) Autocorrelation Function] [autocorrelation -...] [2009-06-07 17:36:09] [822aa141fddc67f18188afbe1dd38d3f] [Current]
Feedback Forum

Post a new message
Dataseries X:
517
540
454
292
445
483
545
355
370
372
422
445
471
413
307
308
389
377
521
420
413
384
466
434
263
334
334
416
309
334
350
337
277
439
433
455
372
409
471
382
417
405
410
357
360
329
359
393
448
593
535
449
742
631
513
526
677
631
547
533
433
427
470
418
485
464
439
452
423
537
384
380


Summary of computational transaction
Raw Inputview raw input (R code)
Raw Outputview raw output of R engine
Computing time1 seconds
R Server'Gwilym Jenkins' @ 72.249.127.135

\begin{tabular}{lllllllll}
\hline
Summary of computational transaction \tabularnewline
Raw Input & view raw input (R code)  \tabularnewline
Raw Output & view raw output of R engine  \tabularnewline
Computing time & 1 seconds \tabularnewline
R Server & 'Gwilym Jenkins' @ 72.249.127.135 \tabularnewline
\hline
\end{tabular}
%Source: https://freestatistics.org/blog/index.php?pk=42213&T=0

[TABLE]
[ROW][C]Summary of computational transaction[/C][/ROW]
[ROW][C]Raw Input[/C][C]view raw input (R code) [/C][/ROW]
[ROW][C]Raw Output[/C][C]view raw output of R engine [/C][/ROW]
[ROW][C]Computing time[/C][C]1 seconds[/C][/ROW]
[ROW][C]R Server[/C][C]'Gwilym Jenkins' @ 72.249.127.135[/C][/ROW]
[/TABLE]
Source: https://freestatistics.org/blog/index.php?pk=42213&T=0

Globally Unique Identifier (entire table): ba.freestatistics.org/blog/index.php?pk=42213&T=0

As an alternative you can also use a QR Code:  

The GUIDs for individual cells are displayed in the table below:

Summary of computational transaction
Raw Inputview raw input (R code)
Raw Outputview raw output of R engine
Computing time1 seconds
R Server'Gwilym Jenkins' @ 72.249.127.135


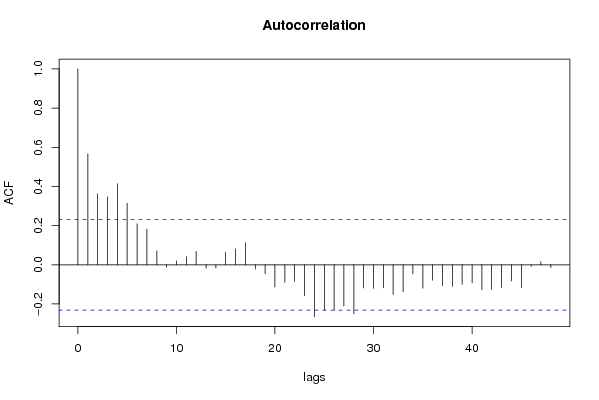
Autocorrelation Function
Time lag kACF(k)T-STATP-value
10.5667184.80884e-06
20.3625983.07670.001479
30.3468612.94320.002185
40.4133163.50710.000392
50.3138522.66310.004773
60.2096281.77880.039751
70.1812221.53770.06425
80.0718380.60960.272035
9-0.012717-0.10790.457184
100.0200980.17050.432531
110.0412350.34990.363722
120.068970.58520.28011
13-0.016284-0.13820.445244
14-0.016032-0.1360.446085
150.0632560.53670.29655
160.0808540.68610.247437
170.1125490.9550.171384
18-0.021029-0.17840.429441
19-0.045879-0.38930.349105
20-0.113158-0.96020.170091
21-0.088472-0.75070.227636
22-0.084926-0.72060.236739
23-0.157595-1.33720.092677
24-0.264636-2.24550.013903
25-0.230792-1.95830.027032
26-0.232268-1.97090.026292
27-0.210448-1.78570.039178
28-0.24965-2.11840.018799
29-0.117788-0.99950.160459
30-0.120351-1.02120.155287
31-0.117428-0.99640.161194
32-0.151358-1.28430.101575
33-0.138089-1.17170.122585
34-0.046521-0.39470.347099
35-0.11905-1.01020.157897
36-0.078712-0.66790.25317
37-0.106453-0.90330.184695
38-0.109784-0.93150.177342
39-0.099744-0.84640.20008
40-0.09205-0.78110.218661
41-0.125745-1.0670.144772
42-0.124345-1.05510.147454
43-0.115473-0.97980.165228
44-0.082451-0.69960.24321
45-0.116297-0.98680.163519
46-0.007564-0.06420.474501
470.0153130.12990.448489
48-0.013138-0.11150.455774

\begin{tabular}{lllllllll}
\hline
Autocorrelation Function \tabularnewline
Time lag k & ACF(k) & T-STAT & P-value \tabularnewline
1 & 0.566718 & 4.8088 & 4e-06 \tabularnewline
2 & 0.362598 & 3.0767 & 0.001479 \tabularnewline
3 & 0.346861 & 2.9432 & 0.002185 \tabularnewline
4 & 0.413316 & 3.5071 & 0.000392 \tabularnewline
5 & 0.313852 & 2.6631 & 0.004773 \tabularnewline
6 & 0.209628 & 1.7788 & 0.039751 \tabularnewline
7 & 0.181222 & 1.5377 & 0.06425 \tabularnewline
8 & 0.071838 & 0.6096 & 0.272035 \tabularnewline
9 & -0.012717 & -0.1079 & 0.457184 \tabularnewline
10 & 0.020098 & 0.1705 & 0.432531 \tabularnewline
11 & 0.041235 & 0.3499 & 0.363722 \tabularnewline
12 & 0.06897 & 0.5852 & 0.28011 \tabularnewline
13 & -0.016284 & -0.1382 & 0.445244 \tabularnewline
14 & -0.016032 & -0.136 & 0.446085 \tabularnewline
15 & 0.063256 & 0.5367 & 0.29655 \tabularnewline
16 & 0.080854 & 0.6861 & 0.247437 \tabularnewline
17 & 0.112549 & 0.955 & 0.171384 \tabularnewline
18 & -0.021029 & -0.1784 & 0.429441 \tabularnewline
19 & -0.045879 & -0.3893 & 0.349105 \tabularnewline
20 & -0.113158 & -0.9602 & 0.170091 \tabularnewline
21 & -0.088472 & -0.7507 & 0.227636 \tabularnewline
22 & -0.084926 & -0.7206 & 0.236739 \tabularnewline
23 & -0.157595 & -1.3372 & 0.092677 \tabularnewline
24 & -0.264636 & -2.2455 & 0.013903 \tabularnewline
25 & -0.230792 & -1.9583 & 0.027032 \tabularnewline
26 & -0.232268 & -1.9709 & 0.026292 \tabularnewline
27 & -0.210448 & -1.7857 & 0.039178 \tabularnewline
28 & -0.24965 & -2.1184 & 0.018799 \tabularnewline
29 & -0.117788 & -0.9995 & 0.160459 \tabularnewline
30 & -0.120351 & -1.0212 & 0.155287 \tabularnewline
31 & -0.117428 & -0.9964 & 0.161194 \tabularnewline
32 & -0.151358 & -1.2843 & 0.101575 \tabularnewline
33 & -0.138089 & -1.1717 & 0.122585 \tabularnewline
34 & -0.046521 & -0.3947 & 0.347099 \tabularnewline
35 & -0.11905 & -1.0102 & 0.157897 \tabularnewline
36 & -0.078712 & -0.6679 & 0.25317 \tabularnewline
37 & -0.106453 & -0.9033 & 0.184695 \tabularnewline
38 & -0.109784 & -0.9315 & 0.177342 \tabularnewline
39 & -0.099744 & -0.8464 & 0.20008 \tabularnewline
40 & -0.09205 & -0.7811 & 0.218661 \tabularnewline
41 & -0.125745 & -1.067 & 0.144772 \tabularnewline
42 & -0.124345 & -1.0551 & 0.147454 \tabularnewline
43 & -0.115473 & -0.9798 & 0.165228 \tabularnewline
44 & -0.082451 & -0.6996 & 0.24321 \tabularnewline
45 & -0.116297 & -0.9868 & 0.163519 \tabularnewline
46 & -0.007564 & -0.0642 & 0.474501 \tabularnewline
47 & 0.015313 & 0.1299 & 0.448489 \tabularnewline
48 & -0.013138 & -0.1115 & 0.455774 \tabularnewline
\hline
\end{tabular}
%Source: https://freestatistics.org/blog/index.php?pk=42213&T=1

[TABLE]
[ROW][C]Autocorrelation Function[/C][/ROW]
[ROW][C]Time lag k[/C][C]ACF(k)[/C][C]T-STAT[/C][C]P-value[/C][/ROW]
[ROW][C]1[/C][C]0.566718[/C][C]4.8088[/C][C]4e-06[/C][/ROW]
[ROW][C]2[/C][C]0.362598[/C][C]3.0767[/C][C]0.001479[/C][/ROW]
[ROW][C]3[/C][C]0.346861[/C][C]2.9432[/C][C]0.002185[/C][/ROW]
[ROW][C]4[/C][C]0.413316[/C][C]3.5071[/C][C]0.000392[/C][/ROW]
[ROW][C]5[/C][C]0.313852[/C][C]2.6631[/C][C]0.004773[/C][/ROW]
[ROW][C]6[/C][C]0.209628[/C][C]1.7788[/C][C]0.039751[/C][/ROW]
[ROW][C]7[/C][C]0.181222[/C][C]1.5377[/C][C]0.06425[/C][/ROW]
[ROW][C]8[/C][C]0.071838[/C][C]0.6096[/C][C]0.272035[/C][/ROW]
[ROW][C]9[/C][C]-0.012717[/C][C]-0.1079[/C][C]0.457184[/C][/ROW]
[ROW][C]10[/C][C]0.020098[/C][C]0.1705[/C][C]0.432531[/C][/ROW]
[ROW][C]11[/C][C]0.041235[/C][C]0.3499[/C][C]0.363722[/C][/ROW]
[ROW][C]12[/C][C]0.06897[/C][C]0.5852[/C][C]0.28011[/C][/ROW]
[ROW][C]13[/C][C]-0.016284[/C][C]-0.1382[/C][C]0.445244[/C][/ROW]
[ROW][C]14[/C][C]-0.016032[/C][C]-0.136[/C][C]0.446085[/C][/ROW]
[ROW][C]15[/C][C]0.063256[/C][C]0.5367[/C][C]0.29655[/C][/ROW]
[ROW][C]16[/C][C]0.080854[/C][C]0.6861[/C][C]0.247437[/C][/ROW]
[ROW][C]17[/C][C]0.112549[/C][C]0.955[/C][C]0.171384[/C][/ROW]
[ROW][C]18[/C][C]-0.021029[/C][C]-0.1784[/C][C]0.429441[/C][/ROW]
[ROW][C]19[/C][C]-0.045879[/C][C]-0.3893[/C][C]0.349105[/C][/ROW]
[ROW][C]20[/C][C]-0.113158[/C][C]-0.9602[/C][C]0.170091[/C][/ROW]
[ROW][C]21[/C][C]-0.088472[/C][C]-0.7507[/C][C]0.227636[/C][/ROW]
[ROW][C]22[/C][C]-0.084926[/C][C]-0.7206[/C][C]0.236739[/C][/ROW]
[ROW][C]23[/C][C]-0.157595[/C][C]-1.3372[/C][C]0.092677[/C][/ROW]
[ROW][C]24[/C][C]-0.264636[/C][C]-2.2455[/C][C]0.013903[/C][/ROW]
[ROW][C]25[/C][C]-0.230792[/C][C]-1.9583[/C][C]0.027032[/C][/ROW]
[ROW][C]26[/C][C]-0.232268[/C][C]-1.9709[/C][C]0.026292[/C][/ROW]
[ROW][C]27[/C][C]-0.210448[/C][C]-1.7857[/C][C]0.039178[/C][/ROW]
[ROW][C]28[/C][C]-0.24965[/C][C]-2.1184[/C][C]0.018799[/C][/ROW]
[ROW][C]29[/C][C]-0.117788[/C][C]-0.9995[/C][C]0.160459[/C][/ROW]
[ROW][C]30[/C][C]-0.120351[/C][C]-1.0212[/C][C]0.155287[/C][/ROW]
[ROW][C]31[/C][C]-0.117428[/C][C]-0.9964[/C][C]0.161194[/C][/ROW]
[ROW][C]32[/C][C]-0.151358[/C][C]-1.2843[/C][C]0.101575[/C][/ROW]
[ROW][C]33[/C][C]-0.138089[/C][C]-1.1717[/C][C]0.122585[/C][/ROW]
[ROW][C]34[/C][C]-0.046521[/C][C]-0.3947[/C][C]0.347099[/C][/ROW]
[ROW][C]35[/C][C]-0.11905[/C][C]-1.0102[/C][C]0.157897[/C][/ROW]
[ROW][C]36[/C][C]-0.078712[/C][C]-0.6679[/C][C]0.25317[/C][/ROW]
[ROW][C]37[/C][C]-0.106453[/C][C]-0.9033[/C][C]0.184695[/C][/ROW]
[ROW][C]38[/C][C]-0.109784[/C][C]-0.9315[/C][C]0.177342[/C][/ROW]
[ROW][C]39[/C][C]-0.099744[/C][C]-0.8464[/C][C]0.20008[/C][/ROW]
[ROW][C]40[/C][C]-0.09205[/C][C]-0.7811[/C][C]0.218661[/C][/ROW]
[ROW][C]41[/C][C]-0.125745[/C][C]-1.067[/C][C]0.144772[/C][/ROW]
[ROW][C]42[/C][C]-0.124345[/C][C]-1.0551[/C][C]0.147454[/C][/ROW]
[ROW][C]43[/C][C]-0.115473[/C][C]-0.9798[/C][C]0.165228[/C][/ROW]
[ROW][C]44[/C][C]-0.082451[/C][C]-0.6996[/C][C]0.24321[/C][/ROW]
[ROW][C]45[/C][C]-0.116297[/C][C]-0.9868[/C][C]0.163519[/C][/ROW]
[ROW][C]46[/C][C]-0.007564[/C][C]-0.0642[/C][C]0.474501[/C][/ROW]
[ROW][C]47[/C][C]0.015313[/C][C]0.1299[/C][C]0.448489[/C][/ROW]
[ROW][C]48[/C][C]-0.013138[/C][C]-0.1115[/C][C]0.455774[/C][/ROW]
[/TABLE]
Source: https://freestatistics.org/blog/index.php?pk=42213&T=1

Globally Unique Identifier (entire table): ba.freestatistics.org/blog/index.php?pk=42213&T=1

As an alternative you can also use a QR Code:  

The GUIDs for individual cells are displayed in the table below:

Autocorrelation Function
Time lag kACF(k)T-STATP-value
10.5667184.80884e-06
20.3625983.07670.001479
30.3468612.94320.002185
40.4133163.50710.000392
50.3138522.66310.004773
60.2096281.77880.039751
70.1812221.53770.06425
80.0718380.60960.272035
9-0.012717-0.10790.457184
100.0200980.17050.432531
110.0412350.34990.363722
120.068970.58520.28011
13-0.016284-0.13820.445244
14-0.016032-0.1360.446085
150.0632560.53670.29655
160.0808540.68610.247437
170.1125490.9550.171384
18-0.021029-0.17840.429441
19-0.045879-0.38930.349105
20-0.113158-0.96020.170091
21-0.088472-0.75070.227636
22-0.084926-0.72060.236739
23-0.157595-1.33720.092677
24-0.264636-2.24550.013903
25-0.230792-1.95830.027032
26-0.232268-1.97090.026292
27-0.210448-1.78570.039178
28-0.24965-2.11840.018799
29-0.117788-0.99950.160459
30-0.120351-1.02120.155287
31-0.117428-0.99640.161194
32-0.151358-1.28430.101575
33-0.138089-1.17170.122585
34-0.046521-0.39470.347099
35-0.11905-1.01020.157897
36-0.078712-0.66790.25317
37-0.106453-0.90330.184695
38-0.109784-0.93150.177342
39-0.099744-0.84640.20008
40-0.09205-0.78110.218661
41-0.125745-1.0670.144772
42-0.124345-1.05510.147454
43-0.115473-0.97980.165228
44-0.082451-0.69960.24321
45-0.116297-0.98680.163519
46-0.007564-0.06420.474501
470.0153130.12990.448489
48-0.013138-0.11150.455774


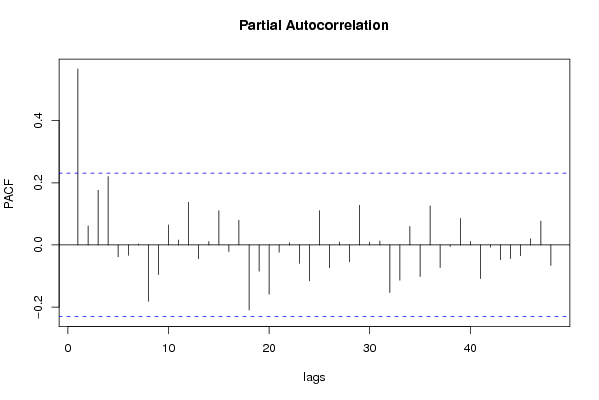
Partial Autocorrelation Function
Time lag kPACF(k)T-STATP-value
10.5667184.80884e-06
20.0610290.51790.303075
30.1764371.49710.069367
40.2203731.86990.03278
5-0.038311-0.32510.373031
6-0.033317-0.28270.389109
70.0028570.02420.490364
8-0.181577-1.54070.063883
9-0.095397-0.80950.210456
100.0645010.54730.292929
110.0158470.13450.446706
120.1373851.16580.123781
13-0.044254-0.37550.354194
140.0113530.09630.461763
150.1102340.93540.176363
16-0.021209-0.180.428844
170.0796420.67580.250672
18-0.209305-1.7760.039978
19-0.084427-0.71640.238036
20-0.158817-1.34760.091006
21-0.023255-0.19730.422065
220.0066630.05650.477534
23-0.059234-0.50260.308382
24-0.11557-0.98060.165026
250.1102960.93590.176229
26-0.073576-0.62430.267197
270.0090640.07690.469453
28-0.05432-0.46090.323121
290.1274031.08110.14164
300.0089780.07620.469744
310.0123640.10490.45837
32-0.153387-1.30150.098613
33-0.113737-0.96510.168865
340.0594430.50440.307765
35-0.101399-0.86040.196214
360.125431.06430.145372
37-0.072619-0.61620.269854
38-0.004752-0.04030.483973
390.0854550.72510.235368
400.0114480.09710.461443
41-0.108366-0.91950.180448
42-0.007168-0.06080.475833
43-0.047662-0.40440.343551
44-0.044096-0.37420.354689
45-0.034838-0.29560.38419
460.0197250.16740.433772
470.0770440.65370.257681
48-0.066051-0.56050.288452

\begin{tabular}{lllllllll}
\hline
Partial Autocorrelation Function \tabularnewline
Time lag k & PACF(k) & T-STAT & P-value \tabularnewline
1 & 0.566718 & 4.8088 & 4e-06 \tabularnewline
2 & 0.061029 & 0.5179 & 0.303075 \tabularnewline
3 & 0.176437 & 1.4971 & 0.069367 \tabularnewline
4 & 0.220373 & 1.8699 & 0.03278 \tabularnewline
5 & -0.038311 & -0.3251 & 0.373031 \tabularnewline
6 & -0.033317 & -0.2827 & 0.389109 \tabularnewline
7 & 0.002857 & 0.0242 & 0.490364 \tabularnewline
8 & -0.181577 & -1.5407 & 0.063883 \tabularnewline
9 & -0.095397 & -0.8095 & 0.210456 \tabularnewline
10 & 0.064501 & 0.5473 & 0.292929 \tabularnewline
11 & 0.015847 & 0.1345 & 0.446706 \tabularnewline
12 & 0.137385 & 1.1658 & 0.123781 \tabularnewline
13 & -0.044254 & -0.3755 & 0.354194 \tabularnewline
14 & 0.011353 & 0.0963 & 0.461763 \tabularnewline
15 & 0.110234 & 0.9354 & 0.176363 \tabularnewline
16 & -0.021209 & -0.18 & 0.428844 \tabularnewline
17 & 0.079642 & 0.6758 & 0.250672 \tabularnewline
18 & -0.209305 & -1.776 & 0.039978 \tabularnewline
19 & -0.084427 & -0.7164 & 0.238036 \tabularnewline
20 & -0.158817 & -1.3476 & 0.091006 \tabularnewline
21 & -0.023255 & -0.1973 & 0.422065 \tabularnewline
22 & 0.006663 & 0.0565 & 0.477534 \tabularnewline
23 & -0.059234 & -0.5026 & 0.308382 \tabularnewline
24 & -0.11557 & -0.9806 & 0.165026 \tabularnewline
25 & 0.110296 & 0.9359 & 0.176229 \tabularnewline
26 & -0.073576 & -0.6243 & 0.267197 \tabularnewline
27 & 0.009064 & 0.0769 & 0.469453 \tabularnewline
28 & -0.05432 & -0.4609 & 0.323121 \tabularnewline
29 & 0.127403 & 1.0811 & 0.14164 \tabularnewline
30 & 0.008978 & 0.0762 & 0.469744 \tabularnewline
31 & 0.012364 & 0.1049 & 0.45837 \tabularnewline
32 & -0.153387 & -1.3015 & 0.098613 \tabularnewline
33 & -0.113737 & -0.9651 & 0.168865 \tabularnewline
34 & 0.059443 & 0.5044 & 0.307765 \tabularnewline
35 & -0.101399 & -0.8604 & 0.196214 \tabularnewline
36 & 0.12543 & 1.0643 & 0.145372 \tabularnewline
37 & -0.072619 & -0.6162 & 0.269854 \tabularnewline
38 & -0.004752 & -0.0403 & 0.483973 \tabularnewline
39 & 0.085455 & 0.7251 & 0.235368 \tabularnewline
40 & 0.011448 & 0.0971 & 0.461443 \tabularnewline
41 & -0.108366 & -0.9195 & 0.180448 \tabularnewline
42 & -0.007168 & -0.0608 & 0.475833 \tabularnewline
43 & -0.047662 & -0.4044 & 0.343551 \tabularnewline
44 & -0.044096 & -0.3742 & 0.354689 \tabularnewline
45 & -0.034838 & -0.2956 & 0.38419 \tabularnewline
46 & 0.019725 & 0.1674 & 0.433772 \tabularnewline
47 & 0.077044 & 0.6537 & 0.257681 \tabularnewline
48 & -0.066051 & -0.5605 & 0.288452 \tabularnewline
\hline
\end{tabular}
%Source: https://freestatistics.org/blog/index.php?pk=42213&T=2

[TABLE]
[ROW][C]Partial Autocorrelation Function[/C][/ROW]
[ROW][C]Time lag k[/C][C]PACF(k)[/C][C]T-STAT[/C][C]P-value[/C][/ROW]
[ROW][C]1[/C][C]0.566718[/C][C]4.8088[/C][C]4e-06[/C][/ROW]
[ROW][C]2[/C][C]0.061029[/C][C]0.5179[/C][C]0.303075[/C][/ROW]
[ROW][C]3[/C][C]0.176437[/C][C]1.4971[/C][C]0.069367[/C][/ROW]
[ROW][C]4[/C][C]0.220373[/C][C]1.8699[/C][C]0.03278[/C][/ROW]
[ROW][C]5[/C][C]-0.038311[/C][C]-0.3251[/C][C]0.373031[/C][/ROW]
[ROW][C]6[/C][C]-0.033317[/C][C]-0.2827[/C][C]0.389109[/C][/ROW]
[ROW][C]7[/C][C]0.002857[/C][C]0.0242[/C][C]0.490364[/C][/ROW]
[ROW][C]8[/C][C]-0.181577[/C][C]-1.5407[/C][C]0.063883[/C][/ROW]
[ROW][C]9[/C][C]-0.095397[/C][C]-0.8095[/C][C]0.210456[/C][/ROW]
[ROW][C]10[/C][C]0.064501[/C][C]0.5473[/C][C]0.292929[/C][/ROW]
[ROW][C]11[/C][C]0.015847[/C][C]0.1345[/C][C]0.446706[/C][/ROW]
[ROW][C]12[/C][C]0.137385[/C][C]1.1658[/C][C]0.123781[/C][/ROW]
[ROW][C]13[/C][C]-0.044254[/C][C]-0.3755[/C][C]0.354194[/C][/ROW]
[ROW][C]14[/C][C]0.011353[/C][C]0.0963[/C][C]0.461763[/C][/ROW]
[ROW][C]15[/C][C]0.110234[/C][C]0.9354[/C][C]0.176363[/C][/ROW]
[ROW][C]16[/C][C]-0.021209[/C][C]-0.18[/C][C]0.428844[/C][/ROW]
[ROW][C]17[/C][C]0.079642[/C][C]0.6758[/C][C]0.250672[/C][/ROW]
[ROW][C]18[/C][C]-0.209305[/C][C]-1.776[/C][C]0.039978[/C][/ROW]
[ROW][C]19[/C][C]-0.084427[/C][C]-0.7164[/C][C]0.238036[/C][/ROW]
[ROW][C]20[/C][C]-0.158817[/C][C]-1.3476[/C][C]0.091006[/C][/ROW]
[ROW][C]21[/C][C]-0.023255[/C][C]-0.1973[/C][C]0.422065[/C][/ROW]
[ROW][C]22[/C][C]0.006663[/C][C]0.0565[/C][C]0.477534[/C][/ROW]
[ROW][C]23[/C][C]-0.059234[/C][C]-0.5026[/C][C]0.308382[/C][/ROW]
[ROW][C]24[/C][C]-0.11557[/C][C]-0.9806[/C][C]0.165026[/C][/ROW]
[ROW][C]25[/C][C]0.110296[/C][C]0.9359[/C][C]0.176229[/C][/ROW]
[ROW][C]26[/C][C]-0.073576[/C][C]-0.6243[/C][C]0.267197[/C][/ROW]
[ROW][C]27[/C][C]0.009064[/C][C]0.0769[/C][C]0.469453[/C][/ROW]
[ROW][C]28[/C][C]-0.05432[/C][C]-0.4609[/C][C]0.323121[/C][/ROW]
[ROW][C]29[/C][C]0.127403[/C][C]1.0811[/C][C]0.14164[/C][/ROW]
[ROW][C]30[/C][C]0.008978[/C][C]0.0762[/C][C]0.469744[/C][/ROW]
[ROW][C]31[/C][C]0.012364[/C][C]0.1049[/C][C]0.45837[/C][/ROW]
[ROW][C]32[/C][C]-0.153387[/C][C]-1.3015[/C][C]0.098613[/C][/ROW]
[ROW][C]33[/C][C]-0.113737[/C][C]-0.9651[/C][C]0.168865[/C][/ROW]
[ROW][C]34[/C][C]0.059443[/C][C]0.5044[/C][C]0.307765[/C][/ROW]
[ROW][C]35[/C][C]-0.101399[/C][C]-0.8604[/C][C]0.196214[/C][/ROW]
[ROW][C]36[/C][C]0.12543[/C][C]1.0643[/C][C]0.145372[/C][/ROW]
[ROW][C]37[/C][C]-0.072619[/C][C]-0.6162[/C][C]0.269854[/C][/ROW]
[ROW][C]38[/C][C]-0.004752[/C][C]-0.0403[/C][C]0.483973[/C][/ROW]
[ROW][C]39[/C][C]0.085455[/C][C]0.7251[/C][C]0.235368[/C][/ROW]
[ROW][C]40[/C][C]0.011448[/C][C]0.0971[/C][C]0.461443[/C][/ROW]
[ROW][C]41[/C][C]-0.108366[/C][C]-0.9195[/C][C]0.180448[/C][/ROW]
[ROW][C]42[/C][C]-0.007168[/C][C]-0.0608[/C][C]0.475833[/C][/ROW]
[ROW][C]43[/C][C]-0.047662[/C][C]-0.4044[/C][C]0.343551[/C][/ROW]
[ROW][C]44[/C][C]-0.044096[/C][C]-0.3742[/C][C]0.354689[/C][/ROW]
[ROW][C]45[/C][C]-0.034838[/C][C]-0.2956[/C][C]0.38419[/C][/ROW]
[ROW][C]46[/C][C]0.019725[/C][C]0.1674[/C][C]0.433772[/C][/ROW]
[ROW][C]47[/C][C]0.077044[/C][C]0.6537[/C][C]0.257681[/C][/ROW]
[ROW][C]48[/C][C]-0.066051[/C][C]-0.5605[/C][C]0.288452[/C][/ROW]
[/TABLE]
Source: https://freestatistics.org/blog/index.php?pk=42213&T=2

Globally Unique Identifier (entire table): ba.freestatistics.org/blog/index.php?pk=42213&T=2

As an alternative you can also use a QR Code:  

The GUIDs for individual cells are displayed in the table below:

Partial Autocorrelation Function
Time lag kPACF(k)T-STATP-value
10.5667184.80884e-06
20.0610290.51790.303075
30.1764371.49710.069367
40.2203731.86990.03278
5-0.038311-0.32510.373031
6-0.033317-0.28270.389109
70.0028570.02420.490364
8-0.181577-1.54070.063883
9-0.095397-0.80950.210456
100.0645010.54730.292929
110.0158470.13450.446706
120.1373851.16580.123781
13-0.044254-0.37550.354194
140.0113530.09630.461763
150.1102340.93540.176363
16-0.021209-0.180.428844
170.0796420.67580.250672
18-0.209305-1.7760.039978
19-0.084427-0.71640.238036
20-0.158817-1.34760.091006
21-0.023255-0.19730.422065
220.0066630.05650.477534
23-0.059234-0.50260.308382
24-0.11557-0.98060.165026
250.1102960.93590.176229
26-0.073576-0.62430.267197
270.0090640.07690.469453
28-0.05432-0.46090.323121
290.1274031.08110.14164
300.0089780.07620.469744
310.0123640.10490.45837
32-0.153387-1.30150.098613
33-0.113737-0.96510.168865
340.0594430.50440.307765
35-0.101399-0.86040.196214
360.125431.06430.145372
37-0.072619-0.61620.269854
38-0.004752-0.04030.483973
390.0854550.72510.235368
400.0114480.09710.461443
41-0.108366-0.91950.180448
42-0.007168-0.06080.475833
43-0.047662-0.40440.343551
44-0.044096-0.37420.354689
45-0.034838-0.29560.38419
460.0197250.16740.433772
470.0770440.65370.257681
48-0.066051-0.56050.288452


Parameters (Session):
par1 = 48 ; par2 = 1 ; par3 = 0 ; par4 = 0 ; par5 = 12 ;
Parameters (R input):
par1 = 48 ; par2 = 1 ; par3 = 0 ; par4 = 0 ; par5 = 12 ;
R code (references can be found in the software module):
if (par1 == 'Default') {
par1 = 10*log10(length(x))
} else {
par1 <- as.numeric(par1)
}
par2 <- as.numeric(par2)
par3 <- as.numeric(par3)
par4 <- as.numeric(par4)
par5 <- as.numeric(par5)
if (par2 == 0) {
x <- log(x)
} else {
x <- (x ^ par2 - 1) / par2
}
if (par3 > 0) x <- diff(x,lag=1,difference=par3)
if (par4 > 0) x <- diff(x,lag=par5,difference=par4)
bitmap(file='pic1.png')
racf <- acf(x,par1,main='Autocorrelation',xlab='lags',ylab='ACF')
dev.off()
bitmap(file='pic2.png')
rpacf <- pacf(x,par1,main='Partial Autocorrelation',xlab='lags',ylab='PACF')
dev.off()
(myacf <- c(racf$acf))
(mypacf <- c(rpacf$acf))
lengthx <- length(x)
sqrtn <- sqrt(lengthx)
load(file='createtable')
a<-table.start()
a<-table.row.start(a)
a<-table.element(a,'Autocorrelation Function',4,TRUE)
a<-table.row.end(a)
a<-table.row.start(a)
a<-table.element(a,'Time lag k',header=TRUE)
a<-table.element(a,hyperlink('basics.htm','ACF(k)','click here for more information about the Autocorrelation Function'),header=TRUE)
a<-table.element(a,'T-STAT',header=TRUE)
a<-table.element(a,'P-value',header=TRUE)
a<-table.row.end(a)
for (i in 2:(par1+1)) {
a<-table.row.start(a)
a<-table.element(a,i-1,header=TRUE)
a<-table.element(a,round(myacf[i],6))
mytstat <- myacf[i]*sqrtn
a<-table.element(a,round(mytstat,4))
a<-table.element(a,round(1-pt(abs(mytstat),lengthx),6))
a<-table.row.end(a)
}
a<-table.end(a)
table.save(a,file='mytable.tab')
a<-table.start()
a<-table.row.start(a)
a<-table.element(a,'Partial Autocorrelation Function',4,TRUE)
a<-table.row.end(a)
a<-table.row.start(a)
a<-table.element(a,'Time lag k',header=TRUE)
a<-table.element(a,hyperlink('basics.htm','PACF(k)','click here for more information about the Partial Autocorrelation Function'),header=TRUE)
a<-table.element(a,'T-STAT',header=TRUE)
a<-table.element(a,'P-value',header=TRUE)
a<-table.row.end(a)
for (i in 1:par1) {
a<-table.row.start(a)
a<-table.element(a,i,header=TRUE)
a<-table.element(a,round(mypacf[i],6))
mytstat <- mypacf[i]*sqrtn
a<-table.element(a,round(mytstat,4))
a<-table.element(a,round(1-pt(abs(mytstat),lengthx),6))
a<-table.row.end(a)
}
a<-table.end(a)
table.save(a,file='mytable1.tab')