Free Statistics

of Irreproducible Research!

Author's title

Author*Unverified author*
R Software Modulerwasp_exponentialsmoothing.wasp
Title produced by softwareExponential Smoothing
Date of computationSun, 07 Jun 2009 10:02:40 -0600
Cite this page as followsStatistical Computations at FreeStatistics.org, Office for Research Development and Education, URL https://freestatistics.org/blog/index.php?v=date/2009/Jun/07/t124439065335rg8zjhzxer62h.htm/, Retrieved Mon, 13 May 2024 12:05:03 +0000
Statistical Computations at FreeStatistics.org, Office for Research Development and Education, URL https://freestatistics.org/blog/index.php?pk=42175, Retrieved Mon, 13 May 2024 12:05:03 +0000
QR Codes:

Original text written by user:
IsPrivate?No (this computation is public)
User-defined keywords
Estimated Impact99
Family? (F = Feedback message, R = changed R code, M = changed R Module, P = changed Parameters, D = changed Data)
-       [Exponential Smoothing] [Opgave 10 - Expon...] [2009-06-07 16:02:40] [80b98812df2028d0ae657015c109b08c] [Current]
Feedback Forum

Post a new message
Dataseries X:
10.812
10.738
10.171
9.721
9.897
9.828
9.924
10.371
10.846
10.413
10.709
10.662
10.570
10.297
10.635
10.872
10.296
10.383
10.431
10.574
10.653
10.805
10.872
10.625
10.407
10.463
10.556
10.646
10.702
11.353
11.346
11.451
11.964
12.574
13.031
13.812
14.544
14.931
14.886
16.005
17.064
15.168
16.050
15.839
15.137
14.954
15.648
15.305
15.579
16.348
15.928
16.171
15.937
15.713
15.594
15.683
16.438
17.032
17.696
17.745
19.394
20.148
20.108
18.584
18.441
18.391
19.178
18.079
18.483
19.644
19.195
19.650
20.830


Summary of computational transaction
Raw Inputview raw input (R code)
Raw Outputview raw output of R engine
Computing time2 seconds
R Server'Sir Ronald Aylmer Fisher' @ 193.190.124.24

\begin{tabular}{lllllllll}
\hline
Summary of computational transaction \tabularnewline
Raw Input & view raw input (R code)  \tabularnewline
Raw Output & view raw output of R engine  \tabularnewline
Computing time & 2 seconds \tabularnewline
R Server & 'Sir Ronald Aylmer Fisher' @ 193.190.124.24 \tabularnewline
\hline
\end{tabular}
%Source: https://freestatistics.org/blog/index.php?pk=42175&T=0

[TABLE]
[ROW][C]Summary of computational transaction[/C][/ROW]
[ROW][C]Raw Input[/C][C]view raw input (R code) [/C][/ROW]
[ROW][C]Raw Output[/C][C]view raw output of R engine [/C][/ROW]
[ROW][C]Computing time[/C][C]2 seconds[/C][/ROW]
[ROW][C]R Server[/C][C]'Sir Ronald Aylmer Fisher' @ 193.190.124.24[/C][/ROW]
[/TABLE]
Source: https://freestatistics.org/blog/index.php?pk=42175&T=0

Globally Unique Identifier (entire table): ba.freestatistics.org/blog/index.php?pk=42175&T=0

As an alternative you can also use a QR Code:  

The GUIDs for individual cells are displayed in the table below:

Summary of computational transaction
Raw Inputview raw input (R code)
Raw Outputview raw output of R engine
Computing time2 seconds
R Server'Sir Ronald Aylmer Fisher' @ 193.190.124.24


Estimated Parameters of Exponential Smoothing
ParameterValue
alpha1
beta0
gamma0

\begin{tabular}{lllllllll}
\hline
Estimated Parameters of Exponential Smoothing \tabularnewline
Parameter & Value \tabularnewline
alpha & 1 \tabularnewline
beta & 0 \tabularnewline
gamma & 0 \tabularnewline
\hline
\end{tabular}
%Source: https://freestatistics.org/blog/index.php?pk=42175&T=1

[TABLE]
[ROW][C]Estimated Parameters of Exponential Smoothing[/C][/ROW]
[ROW][C]Parameter[/C][C]Value[/C][/ROW]
[ROW][C]alpha[/C][C]1[/C][/ROW]
[ROW][C]beta[/C][C]0[/C][/ROW]
[ROW][C]gamma[/C][C]0[/C][/ROW]
[/TABLE]
Source: https://freestatistics.org/blog/index.php?pk=42175&T=1

Globally Unique Identifier (entire table): ba.freestatistics.org/blog/index.php?pk=42175&T=1

As an alternative you can also use a QR Code:  

The GUIDs for individual cells are displayed in the table below:

Estimated Parameters of Exponential Smoothing
ParameterValue
alpha1
beta0
gamma0


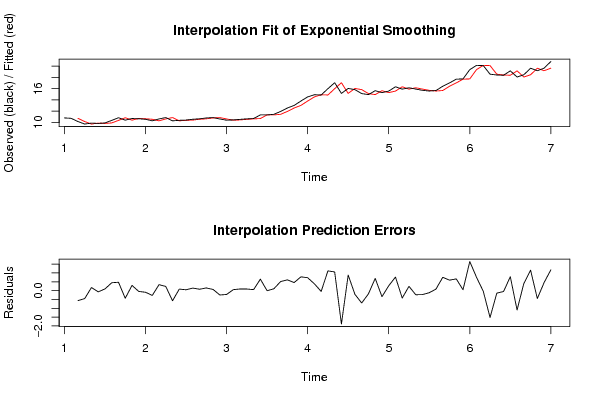
Interpolation Forecasts of Exponential Smoothing
tObservedFittedResiduals
310.17110.738-0.567
49.72110.171-0.449999999999999
59.8979.7210.176
69.8289.897-0.0690000000000008
79.9249.8280.096
810.3719.9240.447000000000001
910.84610.3710.475
1010.41310.846-0.433
1110.70910.4130.295999999999999
1210.66210.709-0.0469999999999988
1310.5710.662-0.0920000000000005
1410.29710.57-0.273000000000000
1510.63510.2970.337999999999999
1610.87210.6350.237
1710.29610.872-0.576
1810.38310.2960.0869999999999997
1910.43110.3830.048
2010.57410.4310.143000000000001
2110.65310.5740.0790000000000006
2210.80510.6530.151999999999999
2310.87210.8050.0670000000000002
2410.62510.872-0.247
2510.40710.625-0.218
2610.46310.4070.0559999999999992
2710.55610.4630.093
2810.64610.5560.0900000000000016
2910.70210.6460.0559999999999992
3011.35310.7020.651
3111.34611.353-0.00699999999999967
3211.45111.3460.105000000000000
3311.96411.4510.513
3412.57411.9640.61
3513.03112.5740.457000000000001
3613.81213.0310.780999999999999
3714.54413.8120.732000000000001
3814.93114.5440.386999999999999
3914.88614.931-0.0449999999999999
4016.00514.8861.119
4117.06416.0051.059
4215.16817.064-1.896
4316.0515.1680.882000000000001
4415.83916.05-0.211000000000000
4515.13715.839-0.702
4614.95415.137-0.183
4715.64814.9540.693999999999999
4815.30515.648-0.343
4915.57915.3050.274000000000001
5016.34815.5790.768999999999998
5115.92816.348-0.419999999999998
5216.17115.9280.242999999999999
5315.93716.171-0.234
5415.71315.937-0.224
5515.59415.713-0.119000000000000
5615.68315.5940.0890000000000004
5716.43815.6830.754999999999999
5817.03216.4380.594000000000001
5917.69617.0320.664000000000001
6017.74517.6960.0489999999999995
6119.39417.7451.64900000000000
6220.14819.3940.754000000000001
6320.10820.148-0.0399999999999991
6418.58420.108-1.524
6518.44118.584-0.143000000000001
6618.39118.441-0.0500000000000007
6719.17818.3910.787000000000003
6818.07919.178-1.099
6918.48318.0790.404
7019.64418.4831.16100000000000
7119.19519.644-0.448999999999998
7219.6519.1950.454999999999998
7320.8319.651.18

\begin{tabular}{lllllllll}
\hline
Interpolation Forecasts of Exponential Smoothing \tabularnewline
t & Observed & Fitted & Residuals \tabularnewline
3 & 10.171 & 10.738 & -0.567 \tabularnewline
4 & 9.721 & 10.171 & -0.449999999999999 \tabularnewline
5 & 9.897 & 9.721 & 0.176 \tabularnewline
6 & 9.828 & 9.897 & -0.0690000000000008 \tabularnewline
7 & 9.924 & 9.828 & 0.096 \tabularnewline
8 & 10.371 & 9.924 & 0.447000000000001 \tabularnewline
9 & 10.846 & 10.371 & 0.475 \tabularnewline
10 & 10.413 & 10.846 & -0.433 \tabularnewline
11 & 10.709 & 10.413 & 0.295999999999999 \tabularnewline
12 & 10.662 & 10.709 & -0.0469999999999988 \tabularnewline
13 & 10.57 & 10.662 & -0.0920000000000005 \tabularnewline
14 & 10.297 & 10.57 & -0.273000000000000 \tabularnewline
15 & 10.635 & 10.297 & 0.337999999999999 \tabularnewline
16 & 10.872 & 10.635 & 0.237 \tabularnewline
17 & 10.296 & 10.872 & -0.576 \tabularnewline
18 & 10.383 & 10.296 & 0.0869999999999997 \tabularnewline
19 & 10.431 & 10.383 & 0.048 \tabularnewline
20 & 10.574 & 10.431 & 0.143000000000001 \tabularnewline
21 & 10.653 & 10.574 & 0.0790000000000006 \tabularnewline
22 & 10.805 & 10.653 & 0.151999999999999 \tabularnewline
23 & 10.872 & 10.805 & 0.0670000000000002 \tabularnewline
24 & 10.625 & 10.872 & -0.247 \tabularnewline
25 & 10.407 & 10.625 & -0.218 \tabularnewline
26 & 10.463 & 10.407 & 0.0559999999999992 \tabularnewline
27 & 10.556 & 10.463 & 0.093 \tabularnewline
28 & 10.646 & 10.556 & 0.0900000000000016 \tabularnewline
29 & 10.702 & 10.646 & 0.0559999999999992 \tabularnewline
30 & 11.353 & 10.702 & 0.651 \tabularnewline
31 & 11.346 & 11.353 & -0.00699999999999967 \tabularnewline
32 & 11.451 & 11.346 & 0.105000000000000 \tabularnewline
33 & 11.964 & 11.451 & 0.513 \tabularnewline
34 & 12.574 & 11.964 & 0.61 \tabularnewline
35 & 13.031 & 12.574 & 0.457000000000001 \tabularnewline
36 & 13.812 & 13.031 & 0.780999999999999 \tabularnewline
37 & 14.544 & 13.812 & 0.732000000000001 \tabularnewline
38 & 14.931 & 14.544 & 0.386999999999999 \tabularnewline
39 & 14.886 & 14.931 & -0.0449999999999999 \tabularnewline
40 & 16.005 & 14.886 & 1.119 \tabularnewline
41 & 17.064 & 16.005 & 1.059 \tabularnewline
42 & 15.168 & 17.064 & -1.896 \tabularnewline
43 & 16.05 & 15.168 & 0.882000000000001 \tabularnewline
44 & 15.839 & 16.05 & -0.211000000000000 \tabularnewline
45 & 15.137 & 15.839 & -0.702 \tabularnewline
46 & 14.954 & 15.137 & -0.183 \tabularnewline
47 & 15.648 & 14.954 & 0.693999999999999 \tabularnewline
48 & 15.305 & 15.648 & -0.343 \tabularnewline
49 & 15.579 & 15.305 & 0.274000000000001 \tabularnewline
50 & 16.348 & 15.579 & 0.768999999999998 \tabularnewline
51 & 15.928 & 16.348 & -0.419999999999998 \tabularnewline
52 & 16.171 & 15.928 & 0.242999999999999 \tabularnewline
53 & 15.937 & 16.171 & -0.234 \tabularnewline
54 & 15.713 & 15.937 & -0.224 \tabularnewline
55 & 15.594 & 15.713 & -0.119000000000000 \tabularnewline
56 & 15.683 & 15.594 & 0.0890000000000004 \tabularnewline
57 & 16.438 & 15.683 & 0.754999999999999 \tabularnewline
58 & 17.032 & 16.438 & 0.594000000000001 \tabularnewline
59 & 17.696 & 17.032 & 0.664000000000001 \tabularnewline
60 & 17.745 & 17.696 & 0.0489999999999995 \tabularnewline
61 & 19.394 & 17.745 & 1.64900000000000 \tabularnewline
62 & 20.148 & 19.394 & 0.754000000000001 \tabularnewline
63 & 20.108 & 20.148 & -0.0399999999999991 \tabularnewline
64 & 18.584 & 20.108 & -1.524 \tabularnewline
65 & 18.441 & 18.584 & -0.143000000000001 \tabularnewline
66 & 18.391 & 18.441 & -0.0500000000000007 \tabularnewline
67 & 19.178 & 18.391 & 0.787000000000003 \tabularnewline
68 & 18.079 & 19.178 & -1.099 \tabularnewline
69 & 18.483 & 18.079 & 0.404 \tabularnewline
70 & 19.644 & 18.483 & 1.16100000000000 \tabularnewline
71 & 19.195 & 19.644 & -0.448999999999998 \tabularnewline
72 & 19.65 & 19.195 & 0.454999999999998 \tabularnewline
73 & 20.83 & 19.65 & 1.18 \tabularnewline
\hline
\end{tabular}
%Source: https://freestatistics.org/blog/index.php?pk=42175&T=2

[TABLE]
[ROW][C]Interpolation Forecasts of Exponential Smoothing[/C][/ROW]
[ROW][C]t[/C][C]Observed[/C][C]Fitted[/C][C]Residuals[/C][/ROW]
[ROW][C]3[/C][C]10.171[/C][C]10.738[/C][C]-0.567[/C][/ROW]
[ROW][C]4[/C][C]9.721[/C][C]10.171[/C][C]-0.449999999999999[/C][/ROW]
[ROW][C]5[/C][C]9.897[/C][C]9.721[/C][C]0.176[/C][/ROW]
[ROW][C]6[/C][C]9.828[/C][C]9.897[/C][C]-0.0690000000000008[/C][/ROW]
[ROW][C]7[/C][C]9.924[/C][C]9.828[/C][C]0.096[/C][/ROW]
[ROW][C]8[/C][C]10.371[/C][C]9.924[/C][C]0.447000000000001[/C][/ROW]
[ROW][C]9[/C][C]10.846[/C][C]10.371[/C][C]0.475[/C][/ROW]
[ROW][C]10[/C][C]10.413[/C][C]10.846[/C][C]-0.433[/C][/ROW]
[ROW][C]11[/C][C]10.709[/C][C]10.413[/C][C]0.295999999999999[/C][/ROW]
[ROW][C]12[/C][C]10.662[/C][C]10.709[/C][C]-0.0469999999999988[/C][/ROW]
[ROW][C]13[/C][C]10.57[/C][C]10.662[/C][C]-0.0920000000000005[/C][/ROW]
[ROW][C]14[/C][C]10.297[/C][C]10.57[/C][C]-0.273000000000000[/C][/ROW]
[ROW][C]15[/C][C]10.635[/C][C]10.297[/C][C]0.337999999999999[/C][/ROW]
[ROW][C]16[/C][C]10.872[/C][C]10.635[/C][C]0.237[/C][/ROW]
[ROW][C]17[/C][C]10.296[/C][C]10.872[/C][C]-0.576[/C][/ROW]
[ROW][C]18[/C][C]10.383[/C][C]10.296[/C][C]0.0869999999999997[/C][/ROW]
[ROW][C]19[/C][C]10.431[/C][C]10.383[/C][C]0.048[/C][/ROW]
[ROW][C]20[/C][C]10.574[/C][C]10.431[/C][C]0.143000000000001[/C][/ROW]
[ROW][C]21[/C][C]10.653[/C][C]10.574[/C][C]0.0790000000000006[/C][/ROW]
[ROW][C]22[/C][C]10.805[/C][C]10.653[/C][C]0.151999999999999[/C][/ROW]
[ROW][C]23[/C][C]10.872[/C][C]10.805[/C][C]0.0670000000000002[/C][/ROW]
[ROW][C]24[/C][C]10.625[/C][C]10.872[/C][C]-0.247[/C][/ROW]
[ROW][C]25[/C][C]10.407[/C][C]10.625[/C][C]-0.218[/C][/ROW]
[ROW][C]26[/C][C]10.463[/C][C]10.407[/C][C]0.0559999999999992[/C][/ROW]
[ROW][C]27[/C][C]10.556[/C][C]10.463[/C][C]0.093[/C][/ROW]
[ROW][C]28[/C][C]10.646[/C][C]10.556[/C][C]0.0900000000000016[/C][/ROW]
[ROW][C]29[/C][C]10.702[/C][C]10.646[/C][C]0.0559999999999992[/C][/ROW]
[ROW][C]30[/C][C]11.353[/C][C]10.702[/C][C]0.651[/C][/ROW]
[ROW][C]31[/C][C]11.346[/C][C]11.353[/C][C]-0.00699999999999967[/C][/ROW]
[ROW][C]32[/C][C]11.451[/C][C]11.346[/C][C]0.105000000000000[/C][/ROW]
[ROW][C]33[/C][C]11.964[/C][C]11.451[/C][C]0.513[/C][/ROW]
[ROW][C]34[/C][C]12.574[/C][C]11.964[/C][C]0.61[/C][/ROW]
[ROW][C]35[/C][C]13.031[/C][C]12.574[/C][C]0.457000000000001[/C][/ROW]
[ROW][C]36[/C][C]13.812[/C][C]13.031[/C][C]0.780999999999999[/C][/ROW]
[ROW][C]37[/C][C]14.544[/C][C]13.812[/C][C]0.732000000000001[/C][/ROW]
[ROW][C]38[/C][C]14.931[/C][C]14.544[/C][C]0.386999999999999[/C][/ROW]
[ROW][C]39[/C][C]14.886[/C][C]14.931[/C][C]-0.0449999999999999[/C][/ROW]
[ROW][C]40[/C][C]16.005[/C][C]14.886[/C][C]1.119[/C][/ROW]
[ROW][C]41[/C][C]17.064[/C][C]16.005[/C][C]1.059[/C][/ROW]
[ROW][C]42[/C][C]15.168[/C][C]17.064[/C][C]-1.896[/C][/ROW]
[ROW][C]43[/C][C]16.05[/C][C]15.168[/C][C]0.882000000000001[/C][/ROW]
[ROW][C]44[/C][C]15.839[/C][C]16.05[/C][C]-0.211000000000000[/C][/ROW]
[ROW][C]45[/C][C]15.137[/C][C]15.839[/C][C]-0.702[/C][/ROW]
[ROW][C]46[/C][C]14.954[/C][C]15.137[/C][C]-0.183[/C][/ROW]
[ROW][C]47[/C][C]15.648[/C][C]14.954[/C][C]0.693999999999999[/C][/ROW]
[ROW][C]48[/C][C]15.305[/C][C]15.648[/C][C]-0.343[/C][/ROW]
[ROW][C]49[/C][C]15.579[/C][C]15.305[/C][C]0.274000000000001[/C][/ROW]
[ROW][C]50[/C][C]16.348[/C][C]15.579[/C][C]0.768999999999998[/C][/ROW]
[ROW][C]51[/C][C]15.928[/C][C]16.348[/C][C]-0.419999999999998[/C][/ROW]
[ROW][C]52[/C][C]16.171[/C][C]15.928[/C][C]0.242999999999999[/C][/ROW]
[ROW][C]53[/C][C]15.937[/C][C]16.171[/C][C]-0.234[/C][/ROW]
[ROW][C]54[/C][C]15.713[/C][C]15.937[/C][C]-0.224[/C][/ROW]
[ROW][C]55[/C][C]15.594[/C][C]15.713[/C][C]-0.119000000000000[/C][/ROW]
[ROW][C]56[/C][C]15.683[/C][C]15.594[/C][C]0.0890000000000004[/C][/ROW]
[ROW][C]57[/C][C]16.438[/C][C]15.683[/C][C]0.754999999999999[/C][/ROW]
[ROW][C]58[/C][C]17.032[/C][C]16.438[/C][C]0.594000000000001[/C][/ROW]
[ROW][C]59[/C][C]17.696[/C][C]17.032[/C][C]0.664000000000001[/C][/ROW]
[ROW][C]60[/C][C]17.745[/C][C]17.696[/C][C]0.0489999999999995[/C][/ROW]
[ROW][C]61[/C][C]19.394[/C][C]17.745[/C][C]1.64900000000000[/C][/ROW]
[ROW][C]62[/C][C]20.148[/C][C]19.394[/C][C]0.754000000000001[/C][/ROW]
[ROW][C]63[/C][C]20.108[/C][C]20.148[/C][C]-0.0399999999999991[/C][/ROW]
[ROW][C]64[/C][C]18.584[/C][C]20.108[/C][C]-1.524[/C][/ROW]
[ROW][C]65[/C][C]18.441[/C][C]18.584[/C][C]-0.143000000000001[/C][/ROW]
[ROW][C]66[/C][C]18.391[/C][C]18.441[/C][C]-0.0500000000000007[/C][/ROW]
[ROW][C]67[/C][C]19.178[/C][C]18.391[/C][C]0.787000000000003[/C][/ROW]
[ROW][C]68[/C][C]18.079[/C][C]19.178[/C][C]-1.099[/C][/ROW]
[ROW][C]69[/C][C]18.483[/C][C]18.079[/C][C]0.404[/C][/ROW]
[ROW][C]70[/C][C]19.644[/C][C]18.483[/C][C]1.16100000000000[/C][/ROW]
[ROW][C]71[/C][C]19.195[/C][C]19.644[/C][C]-0.448999999999998[/C][/ROW]
[ROW][C]72[/C][C]19.65[/C][C]19.195[/C][C]0.454999999999998[/C][/ROW]
[ROW][C]73[/C][C]20.83[/C][C]19.65[/C][C]1.18[/C][/ROW]
[/TABLE]
Source: https://freestatistics.org/blog/index.php?pk=42175&T=2

Globally Unique Identifier (entire table): ba.freestatistics.org/blog/index.php?pk=42175&T=2

As an alternative you can also use a QR Code:  

The GUIDs for individual cells are displayed in the table below:

Interpolation Forecasts of Exponential Smoothing
tObservedFittedResiduals
310.17110.738-0.567
49.72110.171-0.449999999999999
59.8979.7210.176
69.8289.897-0.0690000000000008
79.9249.8280.096
810.3719.9240.447000000000001
910.84610.3710.475
1010.41310.846-0.433
1110.70910.4130.295999999999999
1210.66210.709-0.0469999999999988
1310.5710.662-0.0920000000000005
1410.29710.57-0.273000000000000
1510.63510.2970.337999999999999
1610.87210.6350.237
1710.29610.872-0.576
1810.38310.2960.0869999999999997
1910.43110.3830.048
2010.57410.4310.143000000000001
2110.65310.5740.0790000000000006
2210.80510.6530.151999999999999
2310.87210.8050.0670000000000002
2410.62510.872-0.247
2510.40710.625-0.218
2610.46310.4070.0559999999999992
2710.55610.4630.093
2810.64610.5560.0900000000000016
2910.70210.6460.0559999999999992
3011.35310.7020.651
3111.34611.353-0.00699999999999967
3211.45111.3460.105000000000000
3311.96411.4510.513
3412.57411.9640.61
3513.03112.5740.457000000000001
3613.81213.0310.780999999999999
3714.54413.8120.732000000000001
3814.93114.5440.386999999999999
3914.88614.931-0.0449999999999999
4016.00514.8861.119
4117.06416.0051.059
4215.16817.064-1.896
4316.0515.1680.882000000000001
4415.83916.05-0.211000000000000
4515.13715.839-0.702
4614.95415.137-0.183
4715.64814.9540.693999999999999
4815.30515.648-0.343
4915.57915.3050.274000000000001
5016.34815.5790.768999999999998
5115.92816.348-0.419999999999998
5216.17115.9280.242999999999999
5315.93716.171-0.234
5415.71315.937-0.224
5515.59415.713-0.119000000000000
5615.68315.5940.0890000000000004
5716.43815.6830.754999999999999
5817.03216.4380.594000000000001
5917.69617.0320.664000000000001
6017.74517.6960.0489999999999995
6119.39417.7451.64900000000000
6220.14819.3940.754000000000001
6320.10820.148-0.0399999999999991
6418.58420.108-1.524
6518.44118.584-0.143000000000001
6618.39118.441-0.0500000000000007
6719.17818.3910.787000000000003
6818.07919.178-1.099
6918.48318.0790.404
7019.64418.4831.16100000000000
7119.19519.644-0.448999999999998
7219.6519.1950.454999999999998
7320.8319.651.18


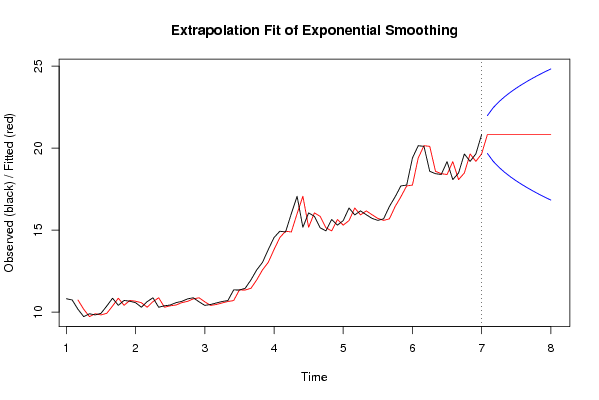
Extrapolation Forecasts of Exponential Smoothing
tForecast95% Lower Bound95% Upper Bound
7420.8319.675678369429921.9843216305701
7520.8319.197542694707222.4624573052928
7620.8318.830656287576922.8293437124231
7720.8318.521356738859923.1386432611401
7820.8318.248858366146923.4111416338531
7920.8318.002501006045923.6574989939541
8020.8317.775952032529023.8840479674710
8120.8317.565085389414424.0949146105856
8220.8317.367035108289824.2929648917102
8320.8317.179714494999124.4802855050008
8420.8317.001548264007924.6584517359921
8520.8316.831312575153824.8286874248462

\begin{tabular}{lllllllll}
\hline
Extrapolation Forecasts of Exponential Smoothing \tabularnewline
t & Forecast & 95% Lower Bound & 95% Upper Bound \tabularnewline
74 & 20.83 & 19.6756783694299 & 21.9843216305701 \tabularnewline
75 & 20.83 & 19.1975426947072 & 22.4624573052928 \tabularnewline
76 & 20.83 & 18.8306562875769 & 22.8293437124231 \tabularnewline
77 & 20.83 & 18.5213567388599 & 23.1386432611401 \tabularnewline
78 & 20.83 & 18.2488583661469 & 23.4111416338531 \tabularnewline
79 & 20.83 & 18.0025010060459 & 23.6574989939541 \tabularnewline
80 & 20.83 & 17.7759520325290 & 23.8840479674710 \tabularnewline
81 & 20.83 & 17.5650853894144 & 24.0949146105856 \tabularnewline
82 & 20.83 & 17.3670351082898 & 24.2929648917102 \tabularnewline
83 & 20.83 & 17.1797144949991 & 24.4802855050008 \tabularnewline
84 & 20.83 & 17.0015482640079 & 24.6584517359921 \tabularnewline
85 & 20.83 & 16.8313125751538 & 24.8286874248462 \tabularnewline
\hline
\end{tabular}
%Source: https://freestatistics.org/blog/index.php?pk=42175&T=3

[TABLE]
[ROW][C]Extrapolation Forecasts of Exponential Smoothing[/C][/ROW]
[ROW][C]t[/C][C]Forecast[/C][C]95% Lower Bound[/C][C]95% Upper Bound[/C][/ROW]
[ROW][C]74[/C][C]20.83[/C][C]19.6756783694299[/C][C]21.9843216305701[/C][/ROW]
[ROW][C]75[/C][C]20.83[/C][C]19.1975426947072[/C][C]22.4624573052928[/C][/ROW]
[ROW][C]76[/C][C]20.83[/C][C]18.8306562875769[/C][C]22.8293437124231[/C][/ROW]
[ROW][C]77[/C][C]20.83[/C][C]18.5213567388599[/C][C]23.1386432611401[/C][/ROW]
[ROW][C]78[/C][C]20.83[/C][C]18.2488583661469[/C][C]23.4111416338531[/C][/ROW]
[ROW][C]79[/C][C]20.83[/C][C]18.0025010060459[/C][C]23.6574989939541[/C][/ROW]
[ROW][C]80[/C][C]20.83[/C][C]17.7759520325290[/C][C]23.8840479674710[/C][/ROW]
[ROW][C]81[/C][C]20.83[/C][C]17.5650853894144[/C][C]24.0949146105856[/C][/ROW]
[ROW][C]82[/C][C]20.83[/C][C]17.3670351082898[/C][C]24.2929648917102[/C][/ROW]
[ROW][C]83[/C][C]20.83[/C][C]17.1797144949991[/C][C]24.4802855050008[/C][/ROW]
[ROW][C]84[/C][C]20.83[/C][C]17.0015482640079[/C][C]24.6584517359921[/C][/ROW]
[ROW][C]85[/C][C]20.83[/C][C]16.8313125751538[/C][C]24.8286874248462[/C][/ROW]
[/TABLE]
Source: https://freestatistics.org/blog/index.php?pk=42175&T=3

Globally Unique Identifier (entire table): ba.freestatistics.org/blog/index.php?pk=42175&T=3

As an alternative you can also use a QR Code:  

The GUIDs for individual cells are displayed in the table below:

Extrapolation Forecasts of Exponential Smoothing
tForecast95% Lower Bound95% Upper Bound
7420.8319.675678369429921.9843216305701
7520.8319.197542694707222.4624573052928
7620.8318.830656287576922.8293437124231
7720.8318.521356738859923.1386432611401
7820.8318.248858366146923.4111416338531
7920.8318.002501006045923.6574989939541
8020.8317.775952032529023.8840479674710
8120.8317.565085389414424.0949146105856
8220.8317.367035108289824.2929648917102
8320.8317.179714494999124.4802855050008
8420.8317.001548264007924.6584517359921
8520.8316.831312575153824.8286874248462


Parameters (Session):
par1 = 12 ; par2 = Double ; par3 = multiplicative ;
Parameters (R input):
par1 = 12 ; par2 = Double ; par3 = multiplicative ;
R code (references can be found in the software module):
par1 <- as.numeric(par1)
if (par2 == 'Single') K <- 1
if (par2 == 'Double') K <- 2
if (par2 == 'Triple') K <- par1
nx <- length(x)
nxmK <- nx - K
x <- ts(x, frequency = par1)
if (par2 == 'Single') fit <- HoltWinters(x, gamma=0, beta=0)
if (par2 == 'Double') fit <- HoltWinters(x, gamma=0)
if (par2 == 'Triple') fit <- HoltWinters(x, seasonal=par3)
fit
myresid <- x - fit$fitted[,'xhat']
bitmap(file='test1.png')
op <- par(mfrow=c(2,1))
plot(fit,ylab='Observed (black) / Fitted (red)',main='Interpolation Fit of Exponential Smoothing')
plot(myresid,ylab='Residuals',main='Interpolation Prediction Errors')
par(op)
dev.off()
bitmap(file='test2.png')
p <- predict(fit, par1, prediction.interval=TRUE)
np <- length(p[,1])
plot(fit,p,ylab='Observed (black) / Fitted (red)',main='Extrapolation Fit of Exponential Smoothing')
dev.off()
bitmap(file='test3.png')
op <- par(mfrow = c(2,2))
acf(as.numeric(myresid),lag.max = nx/2,main='Residual ACF')
spectrum(myresid,main='Residals Periodogram')
cpgram(myresid,main='Residal Cumulative Periodogram')
qqnorm(myresid,main='Residual Normal QQ Plot')
qqline(myresid)
par(op)
dev.off()
load(file='createtable')
a<-table.start()
a<-table.row.start(a)
a<-table.element(a,'Estimated Parameters of Exponential Smoothing',2,TRUE)
a<-table.row.end(a)
a<-table.row.start(a)
a<-table.element(a,'Parameter',header=TRUE)
a<-table.element(a,'Value',header=TRUE)
a<-table.row.end(a)
a<-table.row.start(a)
a<-table.element(a,'alpha',header=TRUE)
a<-table.element(a,fit$alpha)
a<-table.row.end(a)
a<-table.row.start(a)
a<-table.element(a,'beta',header=TRUE)
a<-table.element(a,fit$beta)
a<-table.row.end(a)
a<-table.row.start(a)
a<-table.element(a,'gamma',header=TRUE)
a<-table.element(a,fit$gamma)
a<-table.row.end(a)
a<-table.end(a)
table.save(a,file='mytable.tab')
a<-table.start()
a<-table.row.start(a)
a<-table.element(a,'Interpolation Forecasts of Exponential Smoothing',4,TRUE)
a<-table.row.end(a)
a<-table.row.start(a)
a<-table.element(a,'t',header=TRUE)
a<-table.element(a,'Observed',header=TRUE)
a<-table.element(a,'Fitted',header=TRUE)
a<-table.element(a,'Residuals',header=TRUE)
a<-table.row.end(a)
for (i in 1:nxmK) {
a<-table.row.start(a)
a<-table.element(a,i+K,header=TRUE)
a<-table.element(a,x[i+K])
a<-table.element(a,fit$fitted[i,'xhat'])
a<-table.element(a,myresid[i])
a<-table.row.end(a)
}
a<-table.end(a)
table.save(a,file='mytable1.tab')
a<-table.start()
a<-table.row.start(a)
a<-table.element(a,'Extrapolation Forecasts of Exponential Smoothing',4,TRUE)
a<-table.row.end(a)
a<-table.row.start(a)
a<-table.element(a,'t',header=TRUE)
a<-table.element(a,'Forecast',header=TRUE)
a<-table.element(a,'95% Lower Bound',header=TRUE)
a<-table.element(a,'95% Upper Bound',header=TRUE)
a<-table.row.end(a)
for (i in 1:np) {
a<-table.row.start(a)
a<-table.element(a,nx+i,header=TRUE)
a<-table.element(a,p[i,'fit'])
a<-table.element(a,p[i,'lwr'])
a<-table.element(a,p[i,'upr'])
a<-table.row.end(a)
}
a<-table.end(a)
table.save(a,file='mytable2.tab')