Free Statistics
of Irreproducible Research!
Description of Statistical Computation | |||||||||||||||||||||||||||||||||
|---|---|---|---|---|---|---|---|---|---|---|---|---|---|---|---|---|---|---|---|---|---|---|---|---|---|---|---|---|---|---|---|---|---|
| Author's title | |||||||||||||||||||||||||||||||||
| Author | *Unverified author* | ||||||||||||||||||||||||||||||||
| R Software Module | rwasp_meanversusmedian.wasp | ||||||||||||||||||||||||||||||||
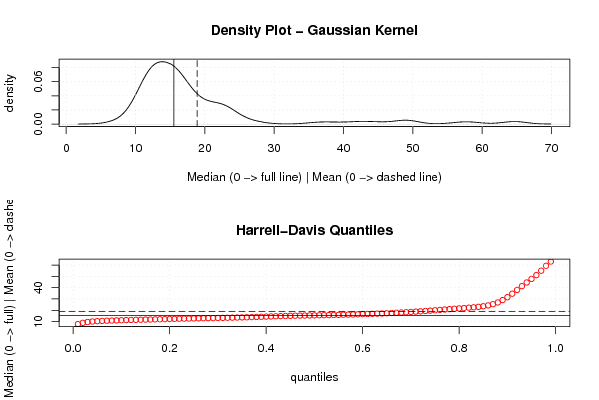
| Title produced by software | Mean versus Median | ||||||||||||||||||||||||||||||||
| Date of computation | Sun, 07 Jun 2009 09:42:17 -0600 | ||||||||||||||||||||||||||||||||
| Cite this page as follows | Statistical Computations at FreeStatistics.org, Office for Research Development and Education, URL https://freestatistics.org/blog/index.php?v=date/2009/Jun/07/t1244389362si5jq7pi7nao6xh.htm/, Retrieved Mon, 13 May 2024 09:16:37 +0000 | ||||||||||||||||||||||||||||||||
| Statistical Computations at FreeStatistics.org, Office for Research Development and Education, URL https://freestatistics.org/blog/index.php?pk=42170, Retrieved Mon, 13 May 2024 09:16:37 +0000 | |||||||||||||||||||||||||||||||||
| QR Codes: | |||||||||||||||||||||||||||||||||
|
| |||||||||||||||||||||||||||||||||
| Original text written by user: | |||||||||||||||||||||||||||||||||
| IsPrivate? | No (this computation is public) | ||||||||||||||||||||||||||||||||
| User-defined keywords | |||||||||||||||||||||||||||||||||
| Estimated Impact | 118 | ||||||||||||||||||||||||||||||||
Tree of Dependent Computations | |||||||||||||||||||||||||||||||||
| Family? (F = Feedback message, R = changed R code, M = changed R Module, P = changed Parameters, D = changed Data) | |||||||||||||||||||||||||||||||||
| - [Quartiles] [] [2009-06-07 13:46:35] [20f4bab96040345df1f930341b3cf3a9] - RM [Mean versus Median] [] [2009-06-07 15:42:17] [e921d89db97faa9283224ee60d8fb091] [Current] | |||||||||||||||||||||||||||||||||
| Feedback Forum | |||||||||||||||||||||||||||||||||
Post a new message | |||||||||||||||||||||||||||||||||
Dataset | |||||||||||||||||||||||||||||||||
| Dataseries X: | |||||||||||||||||||||||||||||||||
49.32 58.53 49.09 24.68 16.71 19.86 38.23 36.11 19.59 14.91 15.74 15.40 13.06 19.07 15.28 15.82 12.77 12.05 11.69 13.85 13.85 10.07 9.17 10.79 13.44 21.17 18.64 13.21 15.54 21.94 23.11 18.64 14.94 16.90 15.46 11.15 13.13 12.48 12.95 12.59 10.58 10.58 12.39 15.53 13.06 10.22 16.33 19.72 21.31 18.84 24.84 15.67 15.57 12.73 13.56 15.54 17.22 12.14 11.07 12.02 11.55 6.92 10.33 8.38 12.11 11.46 12.75 13.32 13.00 11.90 11.79 12.55 11.84 11.25 11.15 10.99 11.70 14.01 17.51 17.27 16.90 15.79 15.45 16.24 16.71 16.77 16.64 17.80 16.87 16.13 15.76 15.66 15.54 15.30 15.05 14.69 14.39 14.18 13.70 13.66 13.27 13.56 13.14 14.19 22.57 23.09 23.31 22.91 22.36 43.06 64.67 64.68 56.90 48.79 45.21 41.40 22.17 25.52 20.28 22.87 27.63 22.95 21.35 18.38 17.15 18.27 19.40 20.52 | |||||||||||||||||||||||||||||||||
Tables (Output of Computation) | |||||||||||||||||||||||||||||||||
| |||||||||||||||||||||||||||||||||
Figures (Output of Computation) | |||||||||||||||||||||||||||||||||
Input Parameters & R Code | |||||||||||||||||||||||||||||||||
| Parameters (Session): | |||||||||||||||||||||||||||||||||
| Parameters (R input): | |||||||||||||||||||||||||||||||||
| R code (references can be found in the software module): | |||||||||||||||||||||||||||||||||
library(Hmisc) | |||||||||||||||||||||||||||||||||