Free Statistics

of Irreproducible Research!

Author's title

Author*Unverified author*
R Software Modulerwasp_exponentialsmoothing.wasp
Title produced by softwareExponential Smoothing
Date of computationSun, 07 Jun 2009 03:37:39 -0600
Cite this page as followsStatistical Computations at FreeStatistics.org, Office for Research Development and Education, URL https://freestatistics.org/blog/index.php?v=date/2009/Jun/07/t1244367517y2o2cn00mhfbcbv.htm/, Retrieved Mon, 13 May 2024 06:21:54 +0000
Statistical Computations at FreeStatistics.org, Office for Research Development and Education, URL https://freestatistics.org/blog/index.php?pk=42095, Retrieved Mon, 13 May 2024 06:21:54 +0000
QR Codes:

Original text written by user:
IsPrivate?No (this computation is public)
User-defined keywords
Estimated Impact151
Family? (F = Feedback message, R = changed R code, M = changed R Module, P = changed Parameters, D = changed Data)
-     [Classical Decomposition] [Yelle Eyckmans] [2009-06-07 08:55:04] [595bbfb6ab1e20d51262e8b831f4c453]
- RMPD    [Exponential Smoothing] [Yelle Eyckmans] [2009-06-07 09:37:39] [5aa691221f42eb69d375706ec88f102e] [Current]
Feedback Forum

Post a new message
Dataseries X:
10,812
10,738
10,171
9,721
9,897
9,828
9,924
10,371
10,846
10,413
10,709
10,662
10,57
10,297
10,635
10,872
10,296
10,383
10,431
10,574
10,653
10,805
10,872
10,625
10,407
10,463
10,556
10,646
10,702
11,353
11,346
11,451
11,964
12,574
13,031
13,812
14,544
14,931
14,886
16,005
17,064
15,168
16,05
15,839
15,137
14,954
15,648
15,305
15,579
16,348
15,928
16,171
15,937
15,713
15,594
15,683
16,438
17,032
17,696
17,745
19,394
20,148
20,108
18,584
18,441
18,391
19,178
18,079
18,483
19,644
19,195
19,65
20,83


Summary of computational transaction
Raw Inputview raw input (R code)
Raw Outputview raw output of R engine
Computing time2 seconds
R Server'Sir Ronald Aylmer Fisher' @ 193.190.124.24

\begin{tabular}{lllllllll}
\hline
Summary of computational transaction \tabularnewline
Raw Input & view raw input (R code)  \tabularnewline
Raw Output & view raw output of R engine  \tabularnewline
Computing time & 2 seconds \tabularnewline
R Server & 'Sir Ronald Aylmer Fisher' @ 193.190.124.24 \tabularnewline
\hline
\end{tabular}
%Source: https://freestatistics.org/blog/index.php?pk=42095&T=0

[TABLE]
[ROW][C]Summary of computational transaction[/C][/ROW]
[ROW][C]Raw Input[/C][C]view raw input (R code) [/C][/ROW]
[ROW][C]Raw Output[/C][C]view raw output of R engine [/C][/ROW]
[ROW][C]Computing time[/C][C]2 seconds[/C][/ROW]
[ROW][C]R Server[/C][C]'Sir Ronald Aylmer Fisher' @ 193.190.124.24[/C][/ROW]
[/TABLE]
Source: https://freestatistics.org/blog/index.php?pk=42095&T=0

Globally Unique Identifier (entire table): ba.freestatistics.org/blog/index.php?pk=42095&T=0

As an alternative you can also use a QR Code:  

The GUIDs for individual cells are displayed in the table below:

Summary of computational transaction
Raw Inputview raw input (R code)
Raw Outputview raw output of R engine
Computing time2 seconds
R Server'Sir Ronald Aylmer Fisher' @ 193.190.124.24


Estimated Parameters of Exponential Smoothing
ParameterValue
alpha0.684229726256932
beta0.0266636363199593
gamma1

\begin{tabular}{lllllllll}
\hline
Estimated Parameters of Exponential Smoothing \tabularnewline
Parameter & Value \tabularnewline
alpha & 0.684229726256932 \tabularnewline
beta & 0.0266636363199593 \tabularnewline
gamma & 1 \tabularnewline
\hline
\end{tabular}
%Source: https://freestatistics.org/blog/index.php?pk=42095&T=1

[TABLE]
[ROW][C]Estimated Parameters of Exponential Smoothing[/C][/ROW]
[ROW][C]Parameter[/C][C]Value[/C][/ROW]
[ROW][C]alpha[/C][C]0.684229726256932[/C][/ROW]
[ROW][C]beta[/C][C]0.0266636363199593[/C][/ROW]
[ROW][C]gamma[/C][C]1[/C][/ROW]
[/TABLE]
Source: https://freestatistics.org/blog/index.php?pk=42095&T=1

Globally Unique Identifier (entire table): ba.freestatistics.org/blog/index.php?pk=42095&T=1

As an alternative you can also use a QR Code:  

The GUIDs for individual cells are displayed in the table below:

Estimated Parameters of Exponential Smoothing
ParameterValue
alpha0.684229726256932
beta0.0266636363199593
gamma1


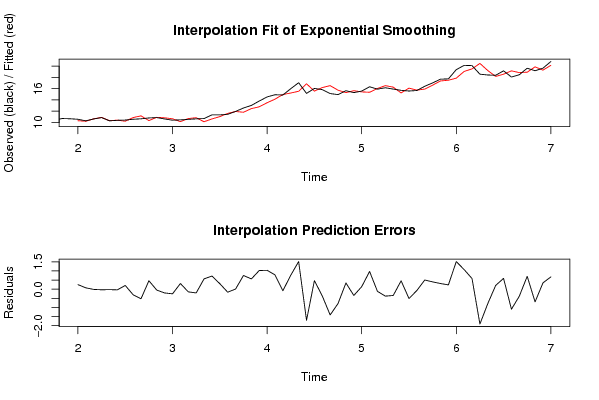
Interpolation Forecasts of Exponential Smoothing
tObservedFittedResiduals
1310.5710.31823210470090.251767895299142
1410.29710.22176363248520.075236367514794
1510.63510.6460463242495-0.0110463242495022
1610.87210.9022153037268-0.0302153037267772
1710.29610.3168837147004-0.0208837147004406
1810.38310.4184310726901-0.0354310726900700
1910.43110.22366995621820.20733004378177
2010.57410.8782124189026-0.304212418902621
2110.65311.175775588343-0.522775588342995
2210.80510.33992046153260.465079538467382
2310.87210.9201784466083-0.0481784466083255
2410.62510.8302044242767-0.205204424276680
2510.40710.6590456171419-0.252045617141913
2610.46310.14966078053930.313339219460733
2710.55610.7015101994321-0.145510199432065
2810.64610.8490640256141-0.203064025614081
2910.70210.13469940128700.567300598713031
3011.35310.6311257532970.721874246702997
3111.34611.04202793595470.30397206404532
3211.45111.6137647238808-0.162764723880805
3311.96411.95427432395160.0097256760484381
3412.57411.81960212121550.754397878784529
3513.03112.46592148554930.565078514450654
3613.81212.78733304700791.02466695299209
3714.54413.50669665460611.03730334539394
3814.93114.14537629580650.785623704193492
3914.88614.9714240402584-0.0854240402583901
4016.00515.23895127874810.766048721251888
4117.06415.54565565964991.51834434035014
4215.16816.8736900732493-1.70569007324931
4316.0515.57939678753560.470603212464367
4415.83916.2085832730306-0.369583273030619
4515.13716.5490929219398-1.41209292193981
4614.95415.7378198884652-0.783819888465159
4715.64815.30490455170730.343095448292749
4815.30515.648544245109-0.343544245108985
4915.57915.43975673670430.139243263295690
5016.34815.37212922966070.97587077033934
5115.92816.0444147699615-0.116414769961533
5216.17116.5501577030023-0.379157703002321
5315.93716.2804878791535-0.343487879153484
5415.71315.25223722846430.460762771535727
5515.59416.1027191008123-0.508719100812259
5615.68315.7538664182311-0.070866418231132
5716.43815.93237145449230.50562854550774
5817.03216.62943540755830.40256459244171
5917.69617.38355542869640.312444571303587
6017.74517.50827274568290.236727254317074
6119.39417.87843096262521.51556903737481
6220.14819.07127509238131.07672490761872
6320.10819.52406324778280.583936752217173
6418.58420.4952248736570-1.91122487365702
6518.44119.2297652754669-0.78876527546694
6618.39118.18391003408680.207089965913234
6719.17818.58316884803140.594831151968553
6818.07919.1762731152626-1.09727311526260
6918.48318.8644085339511-0.381408533951110
7019.64418.93569604842250.708303951577506
7119.19519.8898379609034-0.694837960903403
7219.6519.30233959030170.347660409698261
7320.8320.15515190161230.67484809838771

\begin{tabular}{lllllllll}
\hline
Interpolation Forecasts of Exponential Smoothing \tabularnewline
t & Observed & Fitted & Residuals \tabularnewline
13 & 10.57 & 10.3182321047009 & 0.251767895299142 \tabularnewline
14 & 10.297 & 10.2217636324852 & 0.075236367514794 \tabularnewline
15 & 10.635 & 10.6460463242495 & -0.0110463242495022 \tabularnewline
16 & 10.872 & 10.9022153037268 & -0.0302153037267772 \tabularnewline
17 & 10.296 & 10.3168837147004 & -0.0208837147004406 \tabularnewline
18 & 10.383 & 10.4184310726901 & -0.0354310726900700 \tabularnewline
19 & 10.431 & 10.2236699562182 & 0.20733004378177 \tabularnewline
20 & 10.574 & 10.8782124189026 & -0.304212418902621 \tabularnewline
21 & 10.653 & 11.175775588343 & -0.522775588342995 \tabularnewline
22 & 10.805 & 10.3399204615326 & 0.465079538467382 \tabularnewline
23 & 10.872 & 10.9201784466083 & -0.0481784466083255 \tabularnewline
24 & 10.625 & 10.8302044242767 & -0.205204424276680 \tabularnewline
25 & 10.407 & 10.6590456171419 & -0.252045617141913 \tabularnewline
26 & 10.463 & 10.1496607805393 & 0.313339219460733 \tabularnewline
27 & 10.556 & 10.7015101994321 & -0.145510199432065 \tabularnewline
28 & 10.646 & 10.8490640256141 & -0.203064025614081 \tabularnewline
29 & 10.702 & 10.1346994012870 & 0.567300598713031 \tabularnewline
30 & 11.353 & 10.631125753297 & 0.721874246702997 \tabularnewline
31 & 11.346 & 11.0420279359547 & 0.30397206404532 \tabularnewline
32 & 11.451 & 11.6137647238808 & -0.162764723880805 \tabularnewline
33 & 11.964 & 11.9542743239516 & 0.0097256760484381 \tabularnewline
34 & 12.574 & 11.8196021212155 & 0.754397878784529 \tabularnewline
35 & 13.031 & 12.4659214855493 & 0.565078514450654 \tabularnewline
36 & 13.812 & 12.7873330470079 & 1.02466695299209 \tabularnewline
37 & 14.544 & 13.5066966546061 & 1.03730334539394 \tabularnewline
38 & 14.931 & 14.1453762958065 & 0.785623704193492 \tabularnewline
39 & 14.886 & 14.9714240402584 & -0.0854240402583901 \tabularnewline
40 & 16.005 & 15.2389512787481 & 0.766048721251888 \tabularnewline
41 & 17.064 & 15.5456556596499 & 1.51834434035014 \tabularnewline
42 & 15.168 & 16.8736900732493 & -1.70569007324931 \tabularnewline
43 & 16.05 & 15.5793967875356 & 0.470603212464367 \tabularnewline
44 & 15.839 & 16.2085832730306 & -0.369583273030619 \tabularnewline
45 & 15.137 & 16.5490929219398 & -1.41209292193981 \tabularnewline
46 & 14.954 & 15.7378198884652 & -0.783819888465159 \tabularnewline
47 & 15.648 & 15.3049045517073 & 0.343095448292749 \tabularnewline
48 & 15.305 & 15.648544245109 & -0.343544245108985 \tabularnewline
49 & 15.579 & 15.4397567367043 & 0.139243263295690 \tabularnewline
50 & 16.348 & 15.3721292296607 & 0.97587077033934 \tabularnewline
51 & 15.928 & 16.0444147699615 & -0.116414769961533 \tabularnewline
52 & 16.171 & 16.5501577030023 & -0.379157703002321 \tabularnewline
53 & 15.937 & 16.2804878791535 & -0.343487879153484 \tabularnewline
54 & 15.713 & 15.2522372284643 & 0.460762771535727 \tabularnewline
55 & 15.594 & 16.1027191008123 & -0.508719100812259 \tabularnewline
56 & 15.683 & 15.7538664182311 & -0.070866418231132 \tabularnewline
57 & 16.438 & 15.9323714544923 & 0.50562854550774 \tabularnewline
58 & 17.032 & 16.6294354075583 & 0.40256459244171 \tabularnewline
59 & 17.696 & 17.3835554286964 & 0.312444571303587 \tabularnewline
60 & 17.745 & 17.5082727456829 & 0.236727254317074 \tabularnewline
61 & 19.394 & 17.8784309626252 & 1.51556903737481 \tabularnewline
62 & 20.148 & 19.0712750923813 & 1.07672490761872 \tabularnewline
63 & 20.108 & 19.5240632477828 & 0.583936752217173 \tabularnewline
64 & 18.584 & 20.4952248736570 & -1.91122487365702 \tabularnewline
65 & 18.441 & 19.2297652754669 & -0.78876527546694 \tabularnewline
66 & 18.391 & 18.1839100340868 & 0.207089965913234 \tabularnewline
67 & 19.178 & 18.5831688480314 & 0.594831151968553 \tabularnewline
68 & 18.079 & 19.1762731152626 & -1.09727311526260 \tabularnewline
69 & 18.483 & 18.8644085339511 & -0.381408533951110 \tabularnewline
70 & 19.644 & 18.9356960484225 & 0.708303951577506 \tabularnewline
71 & 19.195 & 19.8898379609034 & -0.694837960903403 \tabularnewline
72 & 19.65 & 19.3023395903017 & 0.347660409698261 \tabularnewline
73 & 20.83 & 20.1551519016123 & 0.67484809838771 \tabularnewline
\hline
\end{tabular}
%Source: https://freestatistics.org/blog/index.php?pk=42095&T=2

[TABLE]
[ROW][C]Interpolation Forecasts of Exponential Smoothing[/C][/ROW]
[ROW][C]t[/C][C]Observed[/C][C]Fitted[/C][C]Residuals[/C][/ROW]
[ROW][C]13[/C][C]10.57[/C][C]10.3182321047009[/C][C]0.251767895299142[/C][/ROW]
[ROW][C]14[/C][C]10.297[/C][C]10.2217636324852[/C][C]0.075236367514794[/C][/ROW]
[ROW][C]15[/C][C]10.635[/C][C]10.6460463242495[/C][C]-0.0110463242495022[/C][/ROW]
[ROW][C]16[/C][C]10.872[/C][C]10.9022153037268[/C][C]-0.0302153037267772[/C][/ROW]
[ROW][C]17[/C][C]10.296[/C][C]10.3168837147004[/C][C]-0.0208837147004406[/C][/ROW]
[ROW][C]18[/C][C]10.383[/C][C]10.4184310726901[/C][C]-0.0354310726900700[/C][/ROW]
[ROW][C]19[/C][C]10.431[/C][C]10.2236699562182[/C][C]0.20733004378177[/C][/ROW]
[ROW][C]20[/C][C]10.574[/C][C]10.8782124189026[/C][C]-0.304212418902621[/C][/ROW]
[ROW][C]21[/C][C]10.653[/C][C]11.175775588343[/C][C]-0.522775588342995[/C][/ROW]
[ROW][C]22[/C][C]10.805[/C][C]10.3399204615326[/C][C]0.465079538467382[/C][/ROW]
[ROW][C]23[/C][C]10.872[/C][C]10.9201784466083[/C][C]-0.0481784466083255[/C][/ROW]
[ROW][C]24[/C][C]10.625[/C][C]10.8302044242767[/C][C]-0.205204424276680[/C][/ROW]
[ROW][C]25[/C][C]10.407[/C][C]10.6590456171419[/C][C]-0.252045617141913[/C][/ROW]
[ROW][C]26[/C][C]10.463[/C][C]10.1496607805393[/C][C]0.313339219460733[/C][/ROW]
[ROW][C]27[/C][C]10.556[/C][C]10.7015101994321[/C][C]-0.145510199432065[/C][/ROW]
[ROW][C]28[/C][C]10.646[/C][C]10.8490640256141[/C][C]-0.203064025614081[/C][/ROW]
[ROW][C]29[/C][C]10.702[/C][C]10.1346994012870[/C][C]0.567300598713031[/C][/ROW]
[ROW][C]30[/C][C]11.353[/C][C]10.631125753297[/C][C]0.721874246702997[/C][/ROW]
[ROW][C]31[/C][C]11.346[/C][C]11.0420279359547[/C][C]0.30397206404532[/C][/ROW]
[ROW][C]32[/C][C]11.451[/C][C]11.6137647238808[/C][C]-0.162764723880805[/C][/ROW]
[ROW][C]33[/C][C]11.964[/C][C]11.9542743239516[/C][C]0.0097256760484381[/C][/ROW]
[ROW][C]34[/C][C]12.574[/C][C]11.8196021212155[/C][C]0.754397878784529[/C][/ROW]
[ROW][C]35[/C][C]13.031[/C][C]12.4659214855493[/C][C]0.565078514450654[/C][/ROW]
[ROW][C]36[/C][C]13.812[/C][C]12.7873330470079[/C][C]1.02466695299209[/C][/ROW]
[ROW][C]37[/C][C]14.544[/C][C]13.5066966546061[/C][C]1.03730334539394[/C][/ROW]
[ROW][C]38[/C][C]14.931[/C][C]14.1453762958065[/C][C]0.785623704193492[/C][/ROW]
[ROW][C]39[/C][C]14.886[/C][C]14.9714240402584[/C][C]-0.0854240402583901[/C][/ROW]
[ROW][C]40[/C][C]16.005[/C][C]15.2389512787481[/C][C]0.766048721251888[/C][/ROW]
[ROW][C]41[/C][C]17.064[/C][C]15.5456556596499[/C][C]1.51834434035014[/C][/ROW]
[ROW][C]42[/C][C]15.168[/C][C]16.8736900732493[/C][C]-1.70569007324931[/C][/ROW]
[ROW][C]43[/C][C]16.05[/C][C]15.5793967875356[/C][C]0.470603212464367[/C][/ROW]
[ROW][C]44[/C][C]15.839[/C][C]16.2085832730306[/C][C]-0.369583273030619[/C][/ROW]
[ROW][C]45[/C][C]15.137[/C][C]16.5490929219398[/C][C]-1.41209292193981[/C][/ROW]
[ROW][C]46[/C][C]14.954[/C][C]15.7378198884652[/C][C]-0.783819888465159[/C][/ROW]
[ROW][C]47[/C][C]15.648[/C][C]15.3049045517073[/C][C]0.343095448292749[/C][/ROW]
[ROW][C]48[/C][C]15.305[/C][C]15.648544245109[/C][C]-0.343544245108985[/C][/ROW]
[ROW][C]49[/C][C]15.579[/C][C]15.4397567367043[/C][C]0.139243263295690[/C][/ROW]
[ROW][C]50[/C][C]16.348[/C][C]15.3721292296607[/C][C]0.97587077033934[/C][/ROW]
[ROW][C]51[/C][C]15.928[/C][C]16.0444147699615[/C][C]-0.116414769961533[/C][/ROW]
[ROW][C]52[/C][C]16.171[/C][C]16.5501577030023[/C][C]-0.379157703002321[/C][/ROW]
[ROW][C]53[/C][C]15.937[/C][C]16.2804878791535[/C][C]-0.343487879153484[/C][/ROW]
[ROW][C]54[/C][C]15.713[/C][C]15.2522372284643[/C][C]0.460762771535727[/C][/ROW]
[ROW][C]55[/C][C]15.594[/C][C]16.1027191008123[/C][C]-0.508719100812259[/C][/ROW]
[ROW][C]56[/C][C]15.683[/C][C]15.7538664182311[/C][C]-0.070866418231132[/C][/ROW]
[ROW][C]57[/C][C]16.438[/C][C]15.9323714544923[/C][C]0.50562854550774[/C][/ROW]
[ROW][C]58[/C][C]17.032[/C][C]16.6294354075583[/C][C]0.40256459244171[/C][/ROW]
[ROW][C]59[/C][C]17.696[/C][C]17.3835554286964[/C][C]0.312444571303587[/C][/ROW]
[ROW][C]60[/C][C]17.745[/C][C]17.5082727456829[/C][C]0.236727254317074[/C][/ROW]
[ROW][C]61[/C][C]19.394[/C][C]17.8784309626252[/C][C]1.51556903737481[/C][/ROW]
[ROW][C]62[/C][C]20.148[/C][C]19.0712750923813[/C][C]1.07672490761872[/C][/ROW]
[ROW][C]63[/C][C]20.108[/C][C]19.5240632477828[/C][C]0.583936752217173[/C][/ROW]
[ROW][C]64[/C][C]18.584[/C][C]20.4952248736570[/C][C]-1.91122487365702[/C][/ROW]
[ROW][C]65[/C][C]18.441[/C][C]19.2297652754669[/C][C]-0.78876527546694[/C][/ROW]
[ROW][C]66[/C][C]18.391[/C][C]18.1839100340868[/C][C]0.207089965913234[/C][/ROW]
[ROW][C]67[/C][C]19.178[/C][C]18.5831688480314[/C][C]0.594831151968553[/C][/ROW]
[ROW][C]68[/C][C]18.079[/C][C]19.1762731152626[/C][C]-1.09727311526260[/C][/ROW]
[ROW][C]69[/C][C]18.483[/C][C]18.8644085339511[/C][C]-0.381408533951110[/C][/ROW]
[ROW][C]70[/C][C]19.644[/C][C]18.9356960484225[/C][C]0.708303951577506[/C][/ROW]
[ROW][C]71[/C][C]19.195[/C][C]19.8898379609034[/C][C]-0.694837960903403[/C][/ROW]
[ROW][C]72[/C][C]19.65[/C][C]19.3023395903017[/C][C]0.347660409698261[/C][/ROW]
[ROW][C]73[/C][C]20.83[/C][C]20.1551519016123[/C][C]0.67484809838771[/C][/ROW]
[/TABLE]
Source: https://freestatistics.org/blog/index.php?pk=42095&T=2

Globally Unique Identifier (entire table): ba.freestatistics.org/blog/index.php?pk=42095&T=2

As an alternative you can also use a QR Code:  

The GUIDs for individual cells are displayed in the table below:

Interpolation Forecasts of Exponential Smoothing
tObservedFittedResiduals
1310.5710.31823210470090.251767895299142
1410.29710.22176363248520.075236367514794
1510.63510.6460463242495-0.0110463242495022
1610.87210.9022153037268-0.0302153037267772
1710.29610.3168837147004-0.0208837147004406
1810.38310.4184310726901-0.0354310726900700
1910.43110.22366995621820.20733004378177
2010.57410.8782124189026-0.304212418902621
2110.65311.175775588343-0.522775588342995
2210.80510.33992046153260.465079538467382
2310.87210.9201784466083-0.0481784466083255
2410.62510.8302044242767-0.205204424276680
2510.40710.6590456171419-0.252045617141913
2610.46310.14966078053930.313339219460733
2710.55610.7015101994321-0.145510199432065
2810.64610.8490640256141-0.203064025614081
2910.70210.13469940128700.567300598713031
3011.35310.6311257532970.721874246702997
3111.34611.04202793595470.30397206404532
3211.45111.6137647238808-0.162764723880805
3311.96411.95427432395160.0097256760484381
3412.57411.81960212121550.754397878784529
3513.03112.46592148554930.565078514450654
3613.81212.78733304700791.02466695299209
3714.54413.50669665460611.03730334539394
3814.93114.14537629580650.785623704193492
3914.88614.9714240402584-0.0854240402583901
4016.00515.23895127874810.766048721251888
4117.06415.54565565964991.51834434035014
4215.16816.8736900732493-1.70569007324931
4316.0515.57939678753560.470603212464367
4415.83916.2085832730306-0.369583273030619
4515.13716.5490929219398-1.41209292193981
4614.95415.7378198884652-0.783819888465159
4715.64815.30490455170730.343095448292749
4815.30515.648544245109-0.343544245108985
4915.57915.43975673670430.139243263295690
5016.34815.37212922966070.97587077033934
5115.92816.0444147699615-0.116414769961533
5216.17116.5501577030023-0.379157703002321
5315.93716.2804878791535-0.343487879153484
5415.71315.25223722846430.460762771535727
5515.59416.1027191008123-0.508719100812259
5615.68315.7538664182311-0.070866418231132
5716.43815.93237145449230.50562854550774
5817.03216.62943540755830.40256459244171
5917.69617.38355542869640.312444571303587
6017.74517.50827274568290.236727254317074
6119.39417.87843096262521.51556903737481
6220.14819.07127509238131.07672490761872
6320.10819.52406324778280.583936752217173
6418.58420.4952248736570-1.91122487365702
6518.44119.2297652754669-0.78876527546694
6618.39118.18391003408680.207089965913234
6719.17818.58316884803140.594831151968553
6818.07919.1762731152626-1.09727311526260
6918.48318.8644085339511-0.381408533951110
7019.64418.93569604842250.708303951577506
7119.19519.8898379609034-0.694837960903403
7219.6519.30233959030170.347660409698261
7320.8320.15515190161230.67484809838771


Extrapolation Forecasts of Exponential Smoothing
tForecast95% Lower Bound95% Upper Bound
7420.621767797345819.291117253495021.9524183411965
7520.150169042298418.524013133278321.7763249513186
7619.891180670678818.003295807511121.7790655338466
7720.280040562542818.151428758776322.4086523663093
7820.094896970364717.739860113544122.4499338271853
7920.477671172366517.906500406548223.0488419381849
8020.121381283121217.341753891895222.9010086743473
8120.798294275777917.816079449340623.7805091022151
8221.493552030110418.313311738752424.6737923214685
8321.525958856584118.151277205495824.9006405076724
8421.761733968611118.195443491078425.3280244461438
8522.492294803176918.736637527080626.2479520792733

\begin{tabular}{lllllllll}
\hline
Extrapolation Forecasts of Exponential Smoothing \tabularnewline
t & Forecast & 95% Lower Bound & 95% Upper Bound \tabularnewline
74 & 20.6217677973458 & 19.2911172534950 & 21.9524183411965 \tabularnewline
75 & 20.1501690422984 & 18.5240131332783 & 21.7763249513186 \tabularnewline
76 & 19.8911806706788 & 18.0032958075111 & 21.7790655338466 \tabularnewline
77 & 20.2800405625428 & 18.1514287587763 & 22.4086523663093 \tabularnewline
78 & 20.0948969703647 & 17.7398601135441 & 22.4499338271853 \tabularnewline
79 & 20.4776711723665 & 17.9065004065482 & 23.0488419381849 \tabularnewline
80 & 20.1213812831212 & 17.3417538918952 & 22.9010086743473 \tabularnewline
81 & 20.7982942757779 & 17.8160794493406 & 23.7805091022151 \tabularnewline
82 & 21.4935520301104 & 18.3133117387524 & 24.6737923214685 \tabularnewline
83 & 21.5259588565841 & 18.1512772054958 & 24.9006405076724 \tabularnewline
84 & 21.7617339686111 & 18.1954434910784 & 25.3280244461438 \tabularnewline
85 & 22.4922948031769 & 18.7366375270806 & 26.2479520792733 \tabularnewline
\hline
\end{tabular}
%Source: https://freestatistics.org/blog/index.php?pk=42095&T=3

[TABLE]
[ROW][C]Extrapolation Forecasts of Exponential Smoothing[/C][/ROW]
[ROW][C]t[/C][C]Forecast[/C][C]95% Lower Bound[/C][C]95% Upper Bound[/C][/ROW]
[ROW][C]74[/C][C]20.6217677973458[/C][C]19.2911172534950[/C][C]21.9524183411965[/C][/ROW]
[ROW][C]75[/C][C]20.1501690422984[/C][C]18.5240131332783[/C][C]21.7763249513186[/C][/ROW]
[ROW][C]76[/C][C]19.8911806706788[/C][C]18.0032958075111[/C][C]21.7790655338466[/C][/ROW]
[ROW][C]77[/C][C]20.2800405625428[/C][C]18.1514287587763[/C][C]22.4086523663093[/C][/ROW]
[ROW][C]78[/C][C]20.0948969703647[/C][C]17.7398601135441[/C][C]22.4499338271853[/C][/ROW]
[ROW][C]79[/C][C]20.4776711723665[/C][C]17.9065004065482[/C][C]23.0488419381849[/C][/ROW]
[ROW][C]80[/C][C]20.1213812831212[/C][C]17.3417538918952[/C][C]22.9010086743473[/C][/ROW]
[ROW][C]81[/C][C]20.7982942757779[/C][C]17.8160794493406[/C][C]23.7805091022151[/C][/ROW]
[ROW][C]82[/C][C]21.4935520301104[/C][C]18.3133117387524[/C][C]24.6737923214685[/C][/ROW]
[ROW][C]83[/C][C]21.5259588565841[/C][C]18.1512772054958[/C][C]24.9006405076724[/C][/ROW]
[ROW][C]84[/C][C]21.7617339686111[/C][C]18.1954434910784[/C][C]25.3280244461438[/C][/ROW]
[ROW][C]85[/C][C]22.4922948031769[/C][C]18.7366375270806[/C][C]26.2479520792733[/C][/ROW]
[/TABLE]
Source: https://freestatistics.org/blog/index.php?pk=42095&T=3

Globally Unique Identifier (entire table): ba.freestatistics.org/blog/index.php?pk=42095&T=3

As an alternative you can also use a QR Code:  

The GUIDs for individual cells are displayed in the table below:

Extrapolation Forecasts of Exponential Smoothing
tForecast95% Lower Bound95% Upper Bound
7420.621767797345819.291117253495021.9524183411965
7520.150169042298418.524013133278321.7763249513186
7619.891180670678818.003295807511121.7790655338466
7720.280040562542818.151428758776322.4086523663093
7820.094896970364717.739860113544122.4499338271853
7920.477671172366517.906500406548223.0488419381849
8020.121381283121217.341753891895222.9010086743473
8120.798294275777917.816079449340623.7805091022151
8221.493552030110418.313311738752424.6737923214685
8321.525958856584118.151277205495824.9006405076724
8421.761733968611118.195443491078425.3280244461438
8522.492294803176918.736637527080626.2479520792733


Parameters (Session):
par1 = 12 ; par2 = Triple ; par3 = additive ;
Parameters (R input):
par1 = 12 ; par2 = Triple ; par3 = additive ;
R code (references can be found in the software module):
par1 <- as.numeric(par1)
if (par2 == 'Single') K <- 1
if (par2 == 'Double') K <- 2
if (par2 == 'Triple') K <- par1
nx <- length(x)
nxmK <- nx - K
x <- ts(x, frequency = par1)
if (par2 == 'Single') fit <- HoltWinters(x, gamma=0, beta=0)
if (par2 == 'Double') fit <- HoltWinters(x, gamma=0)
if (par2 == 'Triple') fit <- HoltWinters(x, seasonal=par3)
fit
myresid <- x - fit$fitted[,'xhat']
bitmap(file='test1.png')
op <- par(mfrow=c(2,1))
plot(fit,ylab='Observed (black) / Fitted (red)',main='Interpolation Fit of Exponential Smoothing')
plot(myresid,ylab='Residuals',main='Interpolation Prediction Errors')
par(op)
dev.off()
bitmap(file='test2.png')
p <- predict(fit, par1, prediction.interval=TRUE)
np <- length(p[,1])
plot(fit,p,ylab='Observed (black) / Fitted (red)',main='Extrapolation Fit of Exponential Smoothing')
dev.off()
bitmap(file='test3.png')
op <- par(mfrow = c(2,2))
acf(as.numeric(myresid),lag.max = nx/2,main='Residual ACF')
spectrum(myresid,main='Residals Periodogram')
cpgram(myresid,main='Residal Cumulative Periodogram')
qqnorm(myresid,main='Residual Normal QQ Plot')
qqline(myresid)
par(op)
dev.off()
load(file='createtable')
a<-table.start()
a<-table.row.start(a)
a<-table.element(a,'Estimated Parameters of Exponential Smoothing',2,TRUE)
a<-table.row.end(a)
a<-table.row.start(a)
a<-table.element(a,'Parameter',header=TRUE)
a<-table.element(a,'Value',header=TRUE)
a<-table.row.end(a)
a<-table.row.start(a)
a<-table.element(a,'alpha',header=TRUE)
a<-table.element(a,fit$alpha)
a<-table.row.end(a)
a<-table.row.start(a)
a<-table.element(a,'beta',header=TRUE)
a<-table.element(a,fit$beta)
a<-table.row.end(a)
a<-table.row.start(a)
a<-table.element(a,'gamma',header=TRUE)
a<-table.element(a,fit$gamma)
a<-table.row.end(a)
a<-table.end(a)
table.save(a,file='mytable.tab')
a<-table.start()
a<-table.row.start(a)
a<-table.element(a,'Interpolation Forecasts of Exponential Smoothing',4,TRUE)
a<-table.row.end(a)
a<-table.row.start(a)
a<-table.element(a,'t',header=TRUE)
a<-table.element(a,'Observed',header=TRUE)
a<-table.element(a,'Fitted',header=TRUE)
a<-table.element(a,'Residuals',header=TRUE)
a<-table.row.end(a)
for (i in 1:nxmK) {
a<-table.row.start(a)
a<-table.element(a,i+K,header=TRUE)
a<-table.element(a,x[i+K])
a<-table.element(a,fit$fitted[i,'xhat'])
a<-table.element(a,myresid[i])
a<-table.row.end(a)
}
a<-table.end(a)
table.save(a,file='mytable1.tab')
a<-table.start()
a<-table.row.start(a)
a<-table.element(a,'Extrapolation Forecasts of Exponential Smoothing',4,TRUE)
a<-table.row.end(a)
a<-table.row.start(a)
a<-table.element(a,'t',header=TRUE)
a<-table.element(a,'Forecast',header=TRUE)
a<-table.element(a,'95% Lower Bound',header=TRUE)
a<-table.element(a,'95% Upper Bound',header=TRUE)
a<-table.row.end(a)
for (i in 1:np) {
a<-table.row.start(a)
a<-table.element(a,nx+i,header=TRUE)
a<-table.element(a,p[i,'fit'])
a<-table.element(a,p[i,'lwr'])
a<-table.element(a,p[i,'upr'])
a<-table.row.end(a)
}
a<-table.end(a)
table.save(a,file='mytable2.tab')