Free Statistics

of Irreproducible Research!

Author's title

Author*Unverified author*
R Software Modulerwasp_smp.wasp
Title produced by softwareStandard Deviation-Mean Plot
Date of computationSun, 07 Jun 2009 02:37:15 -0600
Cite this page as followsStatistical Computations at FreeStatistics.org, Office for Research Development and Education, URL https://freestatistics.org/blog/index.php?v=date/2009/Jun/07/t124436386078s7wpgzftowiq0.htm/, Retrieved Mon, 13 May 2024 14:26:20 +0000
Statistical Computations at FreeStatistics.org, Office for Research Development and Education, URL https://freestatistics.org/blog/index.php?pk=42079, Retrieved Mon, 13 May 2024 14:26:20 +0000
QR Codes:

Original text written by user:
IsPrivate?No (this computation is public)
User-defined keywords
Estimated Impact138
Family? (F = Feedback message, R = changed R code, M = changed R Module, P = changed Parameters, D = changed Data)
-       [Standard Deviation-Mean Plot] [Bruto schuld van ...] [2009-06-07 08:37:15] [2eea656d1ea82c4ced0e8e79cdac0617] [Current]
-   P     [Standard Deviation-Mean Plot] [Bruto schuld van ...] [2009-06-07 16:42:10] [74be16979710d4c4e7c6647856088456]
Feedback Forum

Post a new message
Dataseries X:
266433
267722
266003
262971
265521
264676
270223
269508
268457
265814
266680
263018
269285
269829
270911
266844
271244
269907
271296
270157
271322
267179
264101
265518
269419
268714
272482
268351
268175
270674
272764
272599
270333
270846
270491
269160
274027
273784
276663
274525
271344
271115
270798
273911
273985
271917
273338
270601
273547
275363
281229
277793
279913
282500
280041
282166
290304
283519
287816
285226
287595
289741
289148
288301
290155
289648
288225
289351
294735
305333
309030
310215
321935


Summary of computational transaction
Raw Inputview raw input (R code)
Raw Outputview raw output of R engine
Computing time1 seconds
R Server'George Udny Yule' @ 72.249.76.132

\begin{tabular}{lllllllll}
\hline
Summary of computational transaction \tabularnewline
Raw Input & view raw input (R code)  \tabularnewline
Raw Output & view raw output of R engine  \tabularnewline
Computing time & 1 seconds \tabularnewline
R Server & 'George Udny Yule' @ 72.249.76.132 \tabularnewline
\hline
\end{tabular}
%Source: https://freestatistics.org/blog/index.php?pk=42079&T=0

[TABLE]
[ROW][C]Summary of computational transaction[/C][/ROW]
[ROW][C]Raw Input[/C][C]view raw input (R code) [/C][/ROW]
[ROW][C]Raw Output[/C][C]view raw output of R engine [/C][/ROW]
[ROW][C]Computing time[/C][C]1 seconds[/C][/ROW]
[ROW][C]R Server[/C][C]'George Udny Yule' @ 72.249.76.132[/C][/ROW]
[/TABLE]
Source: https://freestatistics.org/blog/index.php?pk=42079&T=0

Globally Unique Identifier (entire table): ba.freestatistics.org/blog/index.php?pk=42079&T=0

As an alternative you can also use a QR Code:  

The GUIDs for individual cells are displayed in the table below:

Summary of computational transaction
Raw Inputview raw input (R code)
Raw Outputview raw output of R engine
Computing time1 seconds
R Server'George Udny Yule' @ 72.249.76.132


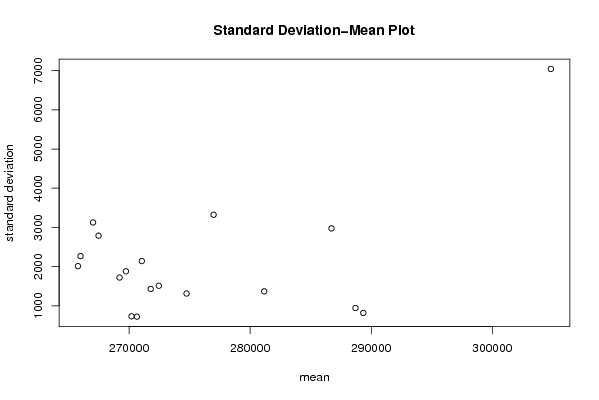
Standard Deviation-Mean Plot
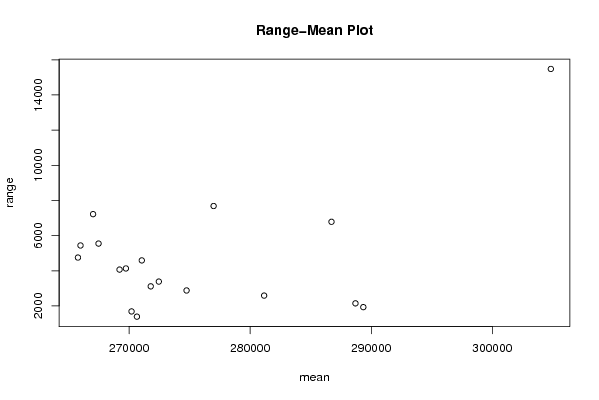
SectionMeanStandard DeviationRange
1265782.252011.464039781314751
22674822789.080732666835547
3265992.252267.592611118675439
4269217.251720.458538684774067
5270651722.3217196420631389
62670303125.627936911247221
7269741.51880.034840102704131
82710532140.417560508544589
9270207.5730.5388422253811686
10274749.751312.259978053132879
112717921430.294841399263113
12272460.251510.765672322043384
132769833322.404350266037682
142811551368.052874221852587
15286716.252973.474552887026785
16288696.25942.4356299857652146
17289344.75816.9750608188721930
18304828.257042.7325840187915480

\begin{tabular}{lllllllll}
\hline
Standard Deviation-Mean Plot \tabularnewline
Section & Mean & Standard Deviation & Range \tabularnewline
1 & 265782.25 & 2011.46403978131 & 4751 \tabularnewline
2 & 267482 & 2789.08073266683 & 5547 \tabularnewline
3 & 265992.25 & 2267.59261111867 & 5439 \tabularnewline
4 & 269217.25 & 1720.45853868477 & 4067 \tabularnewline
5 & 270651 & 722.321719642063 & 1389 \tabularnewline
6 & 267030 & 3125.62793691124 & 7221 \tabularnewline
7 & 269741.5 & 1880.03484010270 & 4131 \tabularnewline
8 & 271053 & 2140.41756050854 & 4589 \tabularnewline
9 & 270207.5 & 730.538842225381 & 1686 \tabularnewline
10 & 274749.75 & 1312.25997805313 & 2879 \tabularnewline
11 & 271792 & 1430.29484139926 & 3113 \tabularnewline
12 & 272460.25 & 1510.76567232204 & 3384 \tabularnewline
13 & 276983 & 3322.40435026603 & 7682 \tabularnewline
14 & 281155 & 1368.05287422185 & 2587 \tabularnewline
15 & 286716.25 & 2973.47455288702 & 6785 \tabularnewline
16 & 288696.25 & 942.435629985765 & 2146 \tabularnewline
17 & 289344.75 & 816.975060818872 & 1930 \tabularnewline
18 & 304828.25 & 7042.73258401879 & 15480 \tabularnewline
\hline
\end{tabular}
%Source: https://freestatistics.org/blog/index.php?pk=42079&T=1

[TABLE]
[ROW][C]Standard Deviation-Mean Plot[/C][/ROW]
[ROW][C]Section[/C][C]Mean[/C][C]Standard Deviation[/C][C]Range[/C][/ROW]
[ROW][C]1[/C][C]265782.25[/C][C]2011.46403978131[/C][C]4751[/C][/ROW]
[ROW][C]2[/C][C]267482[/C][C]2789.08073266683[/C][C]5547[/C][/ROW]
[ROW][C]3[/C][C]265992.25[/C][C]2267.59261111867[/C][C]5439[/C][/ROW]
[ROW][C]4[/C][C]269217.25[/C][C]1720.45853868477[/C][C]4067[/C][/ROW]
[ROW][C]5[/C][C]270651[/C][C]722.321719642063[/C][C]1389[/C][/ROW]
[ROW][C]6[/C][C]267030[/C][C]3125.62793691124[/C][C]7221[/C][/ROW]
[ROW][C]7[/C][C]269741.5[/C][C]1880.03484010270[/C][C]4131[/C][/ROW]
[ROW][C]8[/C][C]271053[/C][C]2140.41756050854[/C][C]4589[/C][/ROW]
[ROW][C]9[/C][C]270207.5[/C][C]730.538842225381[/C][C]1686[/C][/ROW]
[ROW][C]10[/C][C]274749.75[/C][C]1312.25997805313[/C][C]2879[/C][/ROW]
[ROW][C]11[/C][C]271792[/C][C]1430.29484139926[/C][C]3113[/C][/ROW]
[ROW][C]12[/C][C]272460.25[/C][C]1510.76567232204[/C][C]3384[/C][/ROW]
[ROW][C]13[/C][C]276983[/C][C]3322.40435026603[/C][C]7682[/C][/ROW]
[ROW][C]14[/C][C]281155[/C][C]1368.05287422185[/C][C]2587[/C][/ROW]
[ROW][C]15[/C][C]286716.25[/C][C]2973.47455288702[/C][C]6785[/C][/ROW]
[ROW][C]16[/C][C]288696.25[/C][C]942.435629985765[/C][C]2146[/C][/ROW]
[ROW][C]17[/C][C]289344.75[/C][C]816.975060818872[/C][C]1930[/C][/ROW]
[ROW][C]18[/C][C]304828.25[/C][C]7042.73258401879[/C][C]15480[/C][/ROW]
[/TABLE]
Source: https://freestatistics.org/blog/index.php?pk=42079&T=1

Globally Unique Identifier (entire table): ba.freestatistics.org/blog/index.php?pk=42079&T=1

As an alternative you can also use a QR Code:  

The GUIDs for individual cells are displayed in the table below:

Standard Deviation-Mean Plot
SectionMeanStandard DeviationRange
1265782.252011.464039781314751
22674822789.080732666835547
3265992.252267.592611118675439
4269217.251720.458538684774067
5270651722.3217196420631389
62670303125.627936911247221
7269741.51880.034840102704131
82710532140.417560508544589
9270207.5730.5388422253811686
10274749.751312.259978053132879
112717921430.294841399263113
12272460.251510.765672322043384
132769833322.404350266037682
142811551368.052874221852587
15286716.252973.474552887026785
16288696.25942.4356299857652146
17289344.75816.9750608188721930
18304828.257042.7325840187915480


Regression: S.E.(k) = alpha + beta * Mean(k)
alpha-16527.7084138216
beta0.0676095174929671
S.D.0.0308871260488135
T-STAT2.18892225149462
p-value0.0437760506815435

\begin{tabular}{lllllllll}
\hline
Regression: S.E.(k) = alpha + beta * Mean(k) \tabularnewline
alpha & -16527.7084138216 \tabularnewline
beta & 0.0676095174929671 \tabularnewline
S.D. & 0.0308871260488135 \tabularnewline
T-STAT & 2.18892225149462 \tabularnewline
p-value & 0.0437760506815435 \tabularnewline
\hline
\end{tabular}
%Source: https://freestatistics.org/blog/index.php?pk=42079&T=2

[TABLE]
[ROW][C]Regression: S.E.(k) = alpha + beta * Mean(k)[/C][/ROW]
[ROW][C]alpha[/C][C]-16527.7084138216[/C][/ROW]
[ROW][C]beta[/C][C]0.0676095174929671[/C][/ROW]
[ROW][C]S.D.[/C][C]0.0308871260488135[/C][/ROW]
[ROW][C]T-STAT[/C][C]2.18892225149462[/C][/ROW]
[ROW][C]p-value[/C][C]0.0437760506815435[/C][/ROW]
[/TABLE]
Source: https://freestatistics.org/blog/index.php?pk=42079&T=2

Globally Unique Identifier (entire table): ba.freestatistics.org/blog/index.php?pk=42079&T=2

As an alternative you can also use a QR Code:  

The GUIDs for individual cells are displayed in the table below:

Regression: S.E.(k) = alpha + beta * Mean(k)
alpha-16527.7084138216
beta0.0676095174929671
S.D.0.0308871260488135
T-STAT2.18892225149462
p-value0.0437760506815435


Regression: ln S.E.(k) = alpha + beta * ln Mean(k)
alpha-35.9997874638719
beta3.47104437066537
S.D.3.91105157278552
T-STAT0.887496445922145
p-value0.387958304265042
Lambda-2.47104437066537

\begin{tabular}{lllllllll}
\hline
Regression: ln S.E.(k) = alpha + beta * ln Mean(k) \tabularnewline
alpha & -35.9997874638719 \tabularnewline
beta & 3.47104437066537 \tabularnewline
S.D. & 3.91105157278552 \tabularnewline
T-STAT & 0.887496445922145 \tabularnewline
p-value & 0.387958304265042 \tabularnewline
Lambda & -2.47104437066537 \tabularnewline
\hline
\end{tabular}
%Source: https://freestatistics.org/blog/index.php?pk=42079&T=3

[TABLE]
[ROW][C]Regression: ln S.E.(k) = alpha + beta * ln Mean(k)[/C][/ROW]
[ROW][C]alpha[/C][C]-35.9997874638719[/C][/ROW]
[ROW][C]beta[/C][C]3.47104437066537[/C][/ROW]
[ROW][C]S.D.[/C][C]3.91105157278552[/C][/ROW]
[ROW][C]T-STAT[/C][C]0.887496445922145[/C][/ROW]
[ROW][C]p-value[/C][C]0.387958304265042[/C][/ROW]
[ROW][C]Lambda[/C][C]-2.47104437066537[/C][/ROW]
[/TABLE]
Source: https://freestatistics.org/blog/index.php?pk=42079&T=3

Globally Unique Identifier (entire table): ba.freestatistics.org/blog/index.php?pk=42079&T=3

As an alternative you can also use a QR Code:  

The GUIDs for individual cells are displayed in the table below:

Regression: ln S.E.(k) = alpha + beta * ln Mean(k)
alpha-35.9997874638719
beta3.47104437066537
S.D.3.91105157278552
T-STAT0.887496445922145
p-value0.387958304265042
Lambda-2.47104437066537


Parameters (Session):
par1 = 4 ;
Parameters (R input):
par1 = 4 ;
R code (references can be found in the software module):
par1 <- as.numeric(par1)
(n <- length(x))
(np <- floor(n / par1))
arr <- array(NA,dim=c(par1,np))
j <- 0
k <- 1
for (i in 1:(np*par1))
{
j = j + 1
arr[j,k] <- x[i]
if (j == par1) {
j = 0
k=k+1
}
}
arr
arr.mean <- array(NA,dim=np)
arr.sd <- array(NA,dim=np)
arr.range <- array(NA,dim=np)
for (j in 1:np)
{
arr.mean[j] <- mean(arr[,j],na.rm=TRUE)
arr.sd[j] <- sd(arr[,j],na.rm=TRUE)
arr.range[j] <- max(arr[,j],na.rm=TRUE) - min(arr[,j],na.rm=TRUE)
}
arr.mean
arr.sd
arr.range
(lm1 <- lm(arr.sd~arr.mean))
(lnlm1 <- lm(log(arr.sd)~log(arr.mean)))
(lm2 <- lm(arr.range~arr.mean))
bitmap(file='test1.png')
plot(arr.mean,arr.sd,main='Standard Deviation-Mean Plot',xlab='mean',ylab='standard deviation')
dev.off()
bitmap(file='test2.png')
plot(arr.mean,arr.range,main='Range-Mean Plot',xlab='mean',ylab='range')
dev.off()
load(file='createtable')
a<-table.start()
a<-table.row.start(a)
a<-table.element(a,'Standard Deviation-Mean Plot',4,TRUE)
a<-table.row.end(a)
a<-table.row.start(a)
a<-table.element(a,'Section',header=TRUE)
a<-table.element(a,'Mean',header=TRUE)
a<-table.element(a,'Standard Deviation',header=TRUE)
a<-table.element(a,'Range',header=TRUE)
a<-table.row.end(a)
for (j in 1:np) {
a<-table.row.start(a)
a<-table.element(a,j,header=TRUE)
a<-table.element(a,arr.mean[j])
a<-table.element(a,arr.sd[j] )
a<-table.element(a,arr.range[j] )
a<-table.row.end(a)
}
a<-table.end(a)
table.save(a,file='mytable.tab')
a<-table.start()
a<-table.row.start(a)
a<-table.element(a,'Regression: S.E.(k) = alpha + beta * Mean(k)',2,TRUE)
a<-table.row.end(a)
a<-table.row.start(a)
a<-table.element(a,'alpha',header=TRUE)
a<-table.element(a,lm1$coefficients[[1]])
a<-table.row.end(a)
a<-table.row.start(a)
a<-table.element(a,'beta',header=TRUE)
a<-table.element(a,lm1$coefficients[[2]])
a<-table.row.end(a)
a<-table.row.start(a)
a<-table.element(a,'S.D.',header=TRUE)
a<-table.element(a,summary(lm1)$coefficients[2,2])
a<-table.row.end(a)
a<-table.row.start(a)
a<-table.element(a,'T-STAT',header=TRUE)
a<-table.element(a,summary(lm1)$coefficients[2,3])
a<-table.row.end(a)
a<-table.row.start(a)
a<-table.element(a,'p-value',header=TRUE)
a<-table.element(a,summary(lm1)$coefficients[2,4])
a<-table.row.end(a)
a<-table.end(a)
table.save(a,file='mytable1.tab')
a<-table.start()
a<-table.row.start(a)
a<-table.element(a,'Regression: ln S.E.(k) = alpha + beta * ln Mean(k)',2,TRUE)
a<-table.row.end(a)
a<-table.row.start(a)
a<-table.element(a,'alpha',header=TRUE)
a<-table.element(a,lnlm1$coefficients[[1]])
a<-table.row.end(a)
a<-table.row.start(a)
a<-table.element(a,'beta',header=TRUE)
a<-table.element(a,lnlm1$coefficients[[2]])
a<-table.row.end(a)
a<-table.row.start(a)
a<-table.element(a,'S.D.',header=TRUE)
a<-table.element(a,summary(lnlm1)$coefficients[2,2])
a<-table.row.end(a)
a<-table.row.start(a)
a<-table.element(a,'T-STAT',header=TRUE)
a<-table.element(a,summary(lnlm1)$coefficients[2,3])
a<-table.row.end(a)
a<-table.row.start(a)
a<-table.element(a,'p-value',header=TRUE)
a<-table.element(a,summary(lnlm1)$coefficients[2,4])
a<-table.row.end(a)
a<-table.row.start(a)
a<-table.element(a,'Lambda',header=TRUE)
a<-table.element(a,1-lnlm1$coefficients[[2]])
a<-table.row.end(a)
a<-table.end(a)
table.save(a,file='mytable2.tab')