Free Statistics

of Irreproducible Research!

Author's title

Author*Unverified author*
R Software Modulerwasp_autocorrelation.wasp
Title produced by software(Partial) Autocorrelation Function
Date of computationSat, 06 Jun 2009 19:39:03 -0600
Cite this page as followsStatistical Computations at FreeStatistics.org, Office for Research Development and Education, URL https://freestatistics.org/blog/index.php?v=date/2009/Jun/07/t1244338838ncvsxorkeg44xrr.htm/, Retrieved Sun, 12 May 2024 15:53:02 +0000
Statistical Computations at FreeStatistics.org, Office for Research Development and Education, URL https://freestatistics.org/blog/index.php?pk=42065, Retrieved Sun, 12 May 2024 15:53:02 +0000
QR Codes:

Original text written by user:
IsPrivate?No (this computation is public)
User-defined keywords
Estimated Impact142
Family? (F = Feedback message, R = changed R code, M = changed R Module, P = changed Parameters, D = changed Data)
-       [(Partial) Autocorrelation Function] [Grondstof Autocor...] [2009-06-07 01:39:03] [f40d51a95968de218a79272805382c2a] [Current]
Feedback Forum

Post a new message
Dataseries X:
166.7
159.7
191
239.4
321.9
362.7
413.6
407.1
383.2
347.7
333.8
312.3
295.4
283.3
287.6
265.7
250.2
234.7
244
231.2
223.8
223.5
210.5
201.6
190.7
207.5
198.8
196.6
204.2
227.4
229.7
217.9
221.4
216.3
197
193.8
196.8
180.5
174.8
181.6
190
190.6
179
174.1
161.1
168.6
169.4
152.2
148.3
137.7
145
153.4
141.7
142.7
135.9
131.8
134.6
127.5
126.5
118.7
117.1
110.7
107.1
105.4
99
104
101.1
99.3
95.8
94.1
104.8
110.9


Summary of computational transaction
Raw Inputview raw input (R code)
Raw Outputview raw output of R engine
Computing time2 seconds
R Server'Sir Ronald Aylmer Fisher' @ 193.190.124.24

\begin{tabular}{lllllllll}
\hline
Summary of computational transaction \tabularnewline
Raw Input & view raw input (R code)  \tabularnewline
Raw Output & view raw output of R engine  \tabularnewline
Computing time & 2 seconds \tabularnewline
R Server & 'Sir Ronald Aylmer Fisher' @ 193.190.124.24 \tabularnewline
\hline
\end{tabular}
%Source: https://freestatistics.org/blog/index.php?pk=42065&T=0

[TABLE]
[ROW][C]Summary of computational transaction[/C][/ROW]
[ROW][C]Raw Input[/C][C]view raw input (R code) [/C][/ROW]
[ROW][C]Raw Output[/C][C]view raw output of R engine [/C][/ROW]
[ROW][C]Computing time[/C][C]2 seconds[/C][/ROW]
[ROW][C]R Server[/C][C]'Sir Ronald Aylmer Fisher' @ 193.190.124.24[/C][/ROW]
[/TABLE]
Source: https://freestatistics.org/blog/index.php?pk=42065&T=0

Globally Unique Identifier (entire table): ba.freestatistics.org/blog/index.php?pk=42065&T=0

As an alternative you can also use a QR Code:  

The GUIDs for individual cells are displayed in the table below:

Summary of computational transaction
Raw Inputview raw input (R code)
Raw Outputview raw output of R engine
Computing time2 seconds
R Server'Sir Ronald Aylmer Fisher' @ 193.190.124.24


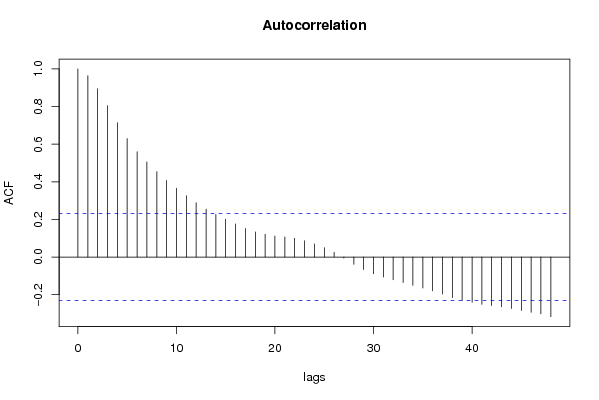
Autocorrelation Function
Time lag kACF(k)T-STATP-value
10.9640268.180
20.8949677.5940
30.8050536.83110
40.7137356.05620
50.629815.34411e-06
60.5602084.75355e-06
70.5052254.2872.8e-05
80.4541913.85390.000125
90.4073553.45650.000461
100.3661293.10670.001353
110.3266462.77170.003546
120.2888632.45110.008336
130.2539872.15520.017247
140.2268831.92520.029079
150.2016331.71090.045701
160.1756011.490.070292
170.1521411.2910.100424
180.1335931.13360.130367
190.1215761.03160.152855
200.1115620.94660.173496
210.107170.90940.183095
220.0994350.84370.200807
230.0861670.73120.23353
240.0697750.59210.277833
250.0496390.42120.337432
260.0257720.21870.413759
27-0.004982-0.04230.483198
28-0.038564-0.32720.372224
29-0.066587-0.5650.286912
30-0.089185-0.75680.225833
31-0.106554-0.90410.184468
32-0.120902-1.02590.15419
33-0.134839-1.14410.128176
34-0.149901-1.2720.103742
35-0.16497-1.39980.082932
36-0.179599-1.5240.065951
37-0.1967-1.66910.049724
38-0.21574-1.83060.035648
39-0.229758-1.94960.027562
40-0.24075-2.04280.022365
41-0.250732-2.12750.018401
42-0.257343-2.18360.016125
43-0.264629-2.24550.013905
44-0.27378-2.32310.011501
45-0.284046-2.41020.00925
46-0.293187-2.48780.007585
47-0.301762-2.56050.006274
48-0.316668-2.6870.004474

\begin{tabular}{lllllllll}
\hline
Autocorrelation Function \tabularnewline
Time lag k & ACF(k) & T-STAT & P-value \tabularnewline
1 & 0.964026 & 8.18 & 0 \tabularnewline
2 & 0.894967 & 7.594 & 0 \tabularnewline
3 & 0.805053 & 6.8311 & 0 \tabularnewline
4 & 0.713735 & 6.0562 & 0 \tabularnewline
5 & 0.62981 & 5.3441 & 1e-06 \tabularnewline
6 & 0.560208 & 4.7535 & 5e-06 \tabularnewline
7 & 0.505225 & 4.287 & 2.8e-05 \tabularnewline
8 & 0.454191 & 3.8539 & 0.000125 \tabularnewline
9 & 0.407355 & 3.4565 & 0.000461 \tabularnewline
10 & 0.366129 & 3.1067 & 0.001353 \tabularnewline
11 & 0.326646 & 2.7717 & 0.003546 \tabularnewline
12 & 0.288863 & 2.4511 & 0.008336 \tabularnewline
13 & 0.253987 & 2.1552 & 0.017247 \tabularnewline
14 & 0.226883 & 1.9252 & 0.029079 \tabularnewline
15 & 0.201633 & 1.7109 & 0.045701 \tabularnewline
16 & 0.175601 & 1.49 & 0.070292 \tabularnewline
17 & 0.152141 & 1.291 & 0.100424 \tabularnewline
18 & 0.133593 & 1.1336 & 0.130367 \tabularnewline
19 & 0.121576 & 1.0316 & 0.152855 \tabularnewline
20 & 0.111562 & 0.9466 & 0.173496 \tabularnewline
21 & 0.10717 & 0.9094 & 0.183095 \tabularnewline
22 & 0.099435 & 0.8437 & 0.200807 \tabularnewline
23 & 0.086167 & 0.7312 & 0.23353 \tabularnewline
24 & 0.069775 & 0.5921 & 0.277833 \tabularnewline
25 & 0.049639 & 0.4212 & 0.337432 \tabularnewline
26 & 0.025772 & 0.2187 & 0.413759 \tabularnewline
27 & -0.004982 & -0.0423 & 0.483198 \tabularnewline
28 & -0.038564 & -0.3272 & 0.372224 \tabularnewline
29 & -0.066587 & -0.565 & 0.286912 \tabularnewline
30 & -0.089185 & -0.7568 & 0.225833 \tabularnewline
31 & -0.106554 & -0.9041 & 0.184468 \tabularnewline
32 & -0.120902 & -1.0259 & 0.15419 \tabularnewline
33 & -0.134839 & -1.1441 & 0.128176 \tabularnewline
34 & -0.149901 & -1.272 & 0.103742 \tabularnewline
35 & -0.16497 & -1.3998 & 0.082932 \tabularnewline
36 & -0.179599 & -1.524 & 0.065951 \tabularnewline
37 & -0.1967 & -1.6691 & 0.049724 \tabularnewline
38 & -0.21574 & -1.8306 & 0.035648 \tabularnewline
39 & -0.229758 & -1.9496 & 0.027562 \tabularnewline
40 & -0.24075 & -2.0428 & 0.022365 \tabularnewline
41 & -0.250732 & -2.1275 & 0.018401 \tabularnewline
42 & -0.257343 & -2.1836 & 0.016125 \tabularnewline
43 & -0.264629 & -2.2455 & 0.013905 \tabularnewline
44 & -0.27378 & -2.3231 & 0.011501 \tabularnewline
45 & -0.284046 & -2.4102 & 0.00925 \tabularnewline
46 & -0.293187 & -2.4878 & 0.007585 \tabularnewline
47 & -0.301762 & -2.5605 & 0.006274 \tabularnewline
48 & -0.316668 & -2.687 & 0.004474 \tabularnewline
\hline
\end{tabular}
%Source: https://freestatistics.org/blog/index.php?pk=42065&T=1

[TABLE]
[ROW][C]Autocorrelation Function[/C][/ROW]
[ROW][C]Time lag k[/C][C]ACF(k)[/C][C]T-STAT[/C][C]P-value[/C][/ROW]
[ROW][C]1[/C][C]0.964026[/C][C]8.18[/C][C]0[/C][/ROW]
[ROW][C]2[/C][C]0.894967[/C][C]7.594[/C][C]0[/C][/ROW]
[ROW][C]3[/C][C]0.805053[/C][C]6.8311[/C][C]0[/C][/ROW]
[ROW][C]4[/C][C]0.713735[/C][C]6.0562[/C][C]0[/C][/ROW]
[ROW][C]5[/C][C]0.62981[/C][C]5.3441[/C][C]1e-06[/C][/ROW]
[ROW][C]6[/C][C]0.560208[/C][C]4.7535[/C][C]5e-06[/C][/ROW]
[ROW][C]7[/C][C]0.505225[/C][C]4.287[/C][C]2.8e-05[/C][/ROW]
[ROW][C]8[/C][C]0.454191[/C][C]3.8539[/C][C]0.000125[/C][/ROW]
[ROW][C]9[/C][C]0.407355[/C][C]3.4565[/C][C]0.000461[/C][/ROW]
[ROW][C]10[/C][C]0.366129[/C][C]3.1067[/C][C]0.001353[/C][/ROW]
[ROW][C]11[/C][C]0.326646[/C][C]2.7717[/C][C]0.003546[/C][/ROW]
[ROW][C]12[/C][C]0.288863[/C][C]2.4511[/C][C]0.008336[/C][/ROW]
[ROW][C]13[/C][C]0.253987[/C][C]2.1552[/C][C]0.017247[/C][/ROW]
[ROW][C]14[/C][C]0.226883[/C][C]1.9252[/C][C]0.029079[/C][/ROW]
[ROW][C]15[/C][C]0.201633[/C][C]1.7109[/C][C]0.045701[/C][/ROW]
[ROW][C]16[/C][C]0.175601[/C][C]1.49[/C][C]0.070292[/C][/ROW]
[ROW][C]17[/C][C]0.152141[/C][C]1.291[/C][C]0.100424[/C][/ROW]
[ROW][C]18[/C][C]0.133593[/C][C]1.1336[/C][C]0.130367[/C][/ROW]
[ROW][C]19[/C][C]0.121576[/C][C]1.0316[/C][C]0.152855[/C][/ROW]
[ROW][C]20[/C][C]0.111562[/C][C]0.9466[/C][C]0.173496[/C][/ROW]
[ROW][C]21[/C][C]0.10717[/C][C]0.9094[/C][C]0.183095[/C][/ROW]
[ROW][C]22[/C][C]0.099435[/C][C]0.8437[/C][C]0.200807[/C][/ROW]
[ROW][C]23[/C][C]0.086167[/C][C]0.7312[/C][C]0.23353[/C][/ROW]
[ROW][C]24[/C][C]0.069775[/C][C]0.5921[/C][C]0.277833[/C][/ROW]
[ROW][C]25[/C][C]0.049639[/C][C]0.4212[/C][C]0.337432[/C][/ROW]
[ROW][C]26[/C][C]0.025772[/C][C]0.2187[/C][C]0.413759[/C][/ROW]
[ROW][C]27[/C][C]-0.004982[/C][C]-0.0423[/C][C]0.483198[/C][/ROW]
[ROW][C]28[/C][C]-0.038564[/C][C]-0.3272[/C][C]0.372224[/C][/ROW]
[ROW][C]29[/C][C]-0.066587[/C][C]-0.565[/C][C]0.286912[/C][/ROW]
[ROW][C]30[/C][C]-0.089185[/C][C]-0.7568[/C][C]0.225833[/C][/ROW]
[ROW][C]31[/C][C]-0.106554[/C][C]-0.9041[/C][C]0.184468[/C][/ROW]
[ROW][C]32[/C][C]-0.120902[/C][C]-1.0259[/C][C]0.15419[/C][/ROW]
[ROW][C]33[/C][C]-0.134839[/C][C]-1.1441[/C][C]0.128176[/C][/ROW]
[ROW][C]34[/C][C]-0.149901[/C][C]-1.272[/C][C]0.103742[/C][/ROW]
[ROW][C]35[/C][C]-0.16497[/C][C]-1.3998[/C][C]0.082932[/C][/ROW]
[ROW][C]36[/C][C]-0.179599[/C][C]-1.524[/C][C]0.065951[/C][/ROW]
[ROW][C]37[/C][C]-0.1967[/C][C]-1.6691[/C][C]0.049724[/C][/ROW]
[ROW][C]38[/C][C]-0.21574[/C][C]-1.8306[/C][C]0.035648[/C][/ROW]
[ROW][C]39[/C][C]-0.229758[/C][C]-1.9496[/C][C]0.027562[/C][/ROW]
[ROW][C]40[/C][C]-0.24075[/C][C]-2.0428[/C][C]0.022365[/C][/ROW]
[ROW][C]41[/C][C]-0.250732[/C][C]-2.1275[/C][C]0.018401[/C][/ROW]
[ROW][C]42[/C][C]-0.257343[/C][C]-2.1836[/C][C]0.016125[/C][/ROW]
[ROW][C]43[/C][C]-0.264629[/C][C]-2.2455[/C][C]0.013905[/C][/ROW]
[ROW][C]44[/C][C]-0.27378[/C][C]-2.3231[/C][C]0.011501[/C][/ROW]
[ROW][C]45[/C][C]-0.284046[/C][C]-2.4102[/C][C]0.00925[/C][/ROW]
[ROW][C]46[/C][C]-0.293187[/C][C]-2.4878[/C][C]0.007585[/C][/ROW]
[ROW][C]47[/C][C]-0.301762[/C][C]-2.5605[/C][C]0.006274[/C][/ROW]
[ROW][C]48[/C][C]-0.316668[/C][C]-2.687[/C][C]0.004474[/C][/ROW]
[/TABLE]
Source: https://freestatistics.org/blog/index.php?pk=42065&T=1

Globally Unique Identifier (entire table): ba.freestatistics.org/blog/index.php?pk=42065&T=1

As an alternative you can also use a QR Code:  

The GUIDs for individual cells are displayed in the table below:

Autocorrelation Function
Time lag kACF(k)T-STATP-value
10.9640268.180
20.8949677.5940
30.8050536.83110
40.7137356.05620
50.629815.34411e-06
60.5602084.75355e-06
70.5052254.2872.8e-05
80.4541913.85390.000125
90.4073553.45650.000461
100.3661293.10670.001353
110.3266462.77170.003546
120.2888632.45110.008336
130.2539872.15520.017247
140.2268831.92520.029079
150.2016331.71090.045701
160.1756011.490.070292
170.1521411.2910.100424
180.1335931.13360.130367
190.1215761.03160.152855
200.1115620.94660.173496
210.107170.90940.183095
220.0994350.84370.200807
230.0861670.73120.23353
240.0697750.59210.277833
250.0496390.42120.337432
260.0257720.21870.413759
27-0.004982-0.04230.483198
28-0.038564-0.32720.372224
29-0.066587-0.5650.286912
30-0.089185-0.75680.225833
31-0.106554-0.90410.184468
32-0.120902-1.02590.15419
33-0.134839-1.14410.128176
34-0.149901-1.2720.103742
35-0.16497-1.39980.082932
36-0.179599-1.5240.065951
37-0.1967-1.66910.049724
38-0.21574-1.83060.035648
39-0.229758-1.94960.027562
40-0.24075-2.04280.022365
41-0.250732-2.12750.018401
42-0.257343-2.18360.016125
43-0.264629-2.24550.013905
44-0.27378-2.32310.011501
45-0.284046-2.41020.00925
46-0.293187-2.48780.007585
47-0.301762-2.56050.006274
48-0.316668-2.6870.004474


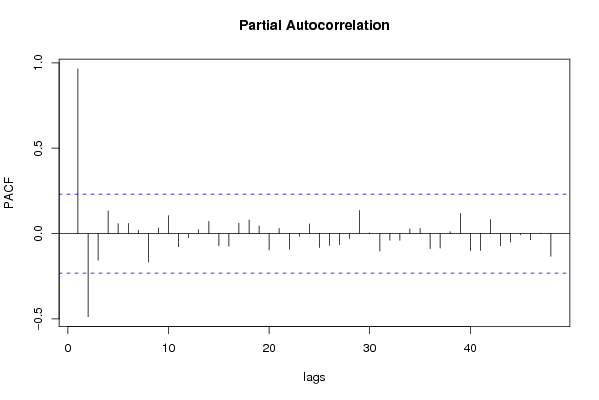
Partial Autocorrelation Function
Time lag kPACF(k)T-STATP-value
10.9640268.180
2-0.486565-4.12864.8e-05
3-0.156713-1.32980.093899
40.1321351.12120.132964
50.0575630.48840.313362
60.0594240.50420.307821
70.019970.16950.432958
8-0.166573-1.41340.080921
90.032780.27810.39085
100.1039660.88220.190306
11-0.077388-0.65670.256748
12-0.023866-0.20250.420043
130.0223890.190.42493
140.0703390.59680.276242
15-0.071989-0.61080.271613
16-0.07391-0.62720.266272
170.0606870.51490.304083
180.0792390.67240.251752
190.0447740.37990.352561
20-0.096532-0.81910.207715
210.0299440.25410.400078
22-0.092566-0.78540.217384
23-0.015572-0.13210.447623
240.0561330.47630.31765
25-0.081927-0.69520.244591
26-0.06929-0.58790.279204
27-0.064863-0.55040.29188
28-0.029239-0.24810.40238
290.1352761.14790.127415
300.0031850.0270.489257
31-0.101865-0.86440.195132
32-0.038506-0.32670.372408
33-0.039282-0.33330.369932
340.0275440.23370.407934
350.0298410.25320.400413
36-0.08753-0.74270.230034
37-0.085035-0.72150.236455
380.0103520.08780.465124
390.1191131.01070.15777
40-0.100965-0.85670.197221
41-0.098624-0.83690.202722
420.0818950.69490.244677
43-0.070839-0.60110.274835
44-0.048765-0.41380.34013
45-0.007236-0.06140.475606
46-0.036577-0.31040.37859
470.0009280.00790.496871
48-0.132598-1.12510.132135

\begin{tabular}{lllllllll}
\hline
Partial Autocorrelation Function \tabularnewline
Time lag k & PACF(k) & T-STAT & P-value \tabularnewline
1 & 0.964026 & 8.18 & 0 \tabularnewline
2 & -0.486565 & -4.1286 & 4.8e-05 \tabularnewline
3 & -0.156713 & -1.3298 & 0.093899 \tabularnewline
4 & 0.132135 & 1.1212 & 0.132964 \tabularnewline
5 & 0.057563 & 0.4884 & 0.313362 \tabularnewline
6 & 0.059424 & 0.5042 & 0.307821 \tabularnewline
7 & 0.01997 & 0.1695 & 0.432958 \tabularnewline
8 & -0.166573 & -1.4134 & 0.080921 \tabularnewline
9 & 0.03278 & 0.2781 & 0.39085 \tabularnewline
10 & 0.103966 & 0.8822 & 0.190306 \tabularnewline
11 & -0.077388 & -0.6567 & 0.256748 \tabularnewline
12 & -0.023866 & -0.2025 & 0.420043 \tabularnewline
13 & 0.022389 & 0.19 & 0.42493 \tabularnewline
14 & 0.070339 & 0.5968 & 0.276242 \tabularnewline
15 & -0.071989 & -0.6108 & 0.271613 \tabularnewline
16 & -0.07391 & -0.6272 & 0.266272 \tabularnewline
17 & 0.060687 & 0.5149 & 0.304083 \tabularnewline
18 & 0.079239 & 0.6724 & 0.251752 \tabularnewline
19 & 0.044774 & 0.3799 & 0.352561 \tabularnewline
20 & -0.096532 & -0.8191 & 0.207715 \tabularnewline
21 & 0.029944 & 0.2541 & 0.400078 \tabularnewline
22 & -0.092566 & -0.7854 & 0.217384 \tabularnewline
23 & -0.015572 & -0.1321 & 0.447623 \tabularnewline
24 & 0.056133 & 0.4763 & 0.31765 \tabularnewline
25 & -0.081927 & -0.6952 & 0.244591 \tabularnewline
26 & -0.06929 & -0.5879 & 0.279204 \tabularnewline
27 & -0.064863 & -0.5504 & 0.29188 \tabularnewline
28 & -0.029239 & -0.2481 & 0.40238 \tabularnewline
29 & 0.135276 & 1.1479 & 0.127415 \tabularnewline
30 & 0.003185 & 0.027 & 0.489257 \tabularnewline
31 & -0.101865 & -0.8644 & 0.195132 \tabularnewline
32 & -0.038506 & -0.3267 & 0.372408 \tabularnewline
33 & -0.039282 & -0.3333 & 0.369932 \tabularnewline
34 & 0.027544 & 0.2337 & 0.407934 \tabularnewline
35 & 0.029841 & 0.2532 & 0.400413 \tabularnewline
36 & -0.08753 & -0.7427 & 0.230034 \tabularnewline
37 & -0.085035 & -0.7215 & 0.236455 \tabularnewline
38 & 0.010352 & 0.0878 & 0.465124 \tabularnewline
39 & 0.119113 & 1.0107 & 0.15777 \tabularnewline
40 & -0.100965 & -0.8567 & 0.197221 \tabularnewline
41 & -0.098624 & -0.8369 & 0.202722 \tabularnewline
42 & 0.081895 & 0.6949 & 0.244677 \tabularnewline
43 & -0.070839 & -0.6011 & 0.274835 \tabularnewline
44 & -0.048765 & -0.4138 & 0.34013 \tabularnewline
45 & -0.007236 & -0.0614 & 0.475606 \tabularnewline
46 & -0.036577 & -0.3104 & 0.37859 \tabularnewline
47 & 0.000928 & 0.0079 & 0.496871 \tabularnewline
48 & -0.132598 & -1.1251 & 0.132135 \tabularnewline
\hline
\end{tabular}
%Source: https://freestatistics.org/blog/index.php?pk=42065&T=2

[TABLE]
[ROW][C]Partial Autocorrelation Function[/C][/ROW]
[ROW][C]Time lag k[/C][C]PACF(k)[/C][C]T-STAT[/C][C]P-value[/C][/ROW]
[ROW][C]1[/C][C]0.964026[/C][C]8.18[/C][C]0[/C][/ROW]
[ROW][C]2[/C][C]-0.486565[/C][C]-4.1286[/C][C]4.8e-05[/C][/ROW]
[ROW][C]3[/C][C]-0.156713[/C][C]-1.3298[/C][C]0.093899[/C][/ROW]
[ROW][C]4[/C][C]0.132135[/C][C]1.1212[/C][C]0.132964[/C][/ROW]
[ROW][C]5[/C][C]0.057563[/C][C]0.4884[/C][C]0.313362[/C][/ROW]
[ROW][C]6[/C][C]0.059424[/C][C]0.5042[/C][C]0.307821[/C][/ROW]
[ROW][C]7[/C][C]0.01997[/C][C]0.1695[/C][C]0.432958[/C][/ROW]
[ROW][C]8[/C][C]-0.166573[/C][C]-1.4134[/C][C]0.080921[/C][/ROW]
[ROW][C]9[/C][C]0.03278[/C][C]0.2781[/C][C]0.39085[/C][/ROW]
[ROW][C]10[/C][C]0.103966[/C][C]0.8822[/C][C]0.190306[/C][/ROW]
[ROW][C]11[/C][C]-0.077388[/C][C]-0.6567[/C][C]0.256748[/C][/ROW]
[ROW][C]12[/C][C]-0.023866[/C][C]-0.2025[/C][C]0.420043[/C][/ROW]
[ROW][C]13[/C][C]0.022389[/C][C]0.19[/C][C]0.42493[/C][/ROW]
[ROW][C]14[/C][C]0.070339[/C][C]0.5968[/C][C]0.276242[/C][/ROW]
[ROW][C]15[/C][C]-0.071989[/C][C]-0.6108[/C][C]0.271613[/C][/ROW]
[ROW][C]16[/C][C]-0.07391[/C][C]-0.6272[/C][C]0.266272[/C][/ROW]
[ROW][C]17[/C][C]0.060687[/C][C]0.5149[/C][C]0.304083[/C][/ROW]
[ROW][C]18[/C][C]0.079239[/C][C]0.6724[/C][C]0.251752[/C][/ROW]
[ROW][C]19[/C][C]0.044774[/C][C]0.3799[/C][C]0.352561[/C][/ROW]
[ROW][C]20[/C][C]-0.096532[/C][C]-0.8191[/C][C]0.207715[/C][/ROW]
[ROW][C]21[/C][C]0.029944[/C][C]0.2541[/C][C]0.400078[/C][/ROW]
[ROW][C]22[/C][C]-0.092566[/C][C]-0.7854[/C][C]0.217384[/C][/ROW]
[ROW][C]23[/C][C]-0.015572[/C][C]-0.1321[/C][C]0.447623[/C][/ROW]
[ROW][C]24[/C][C]0.056133[/C][C]0.4763[/C][C]0.31765[/C][/ROW]
[ROW][C]25[/C][C]-0.081927[/C][C]-0.6952[/C][C]0.244591[/C][/ROW]
[ROW][C]26[/C][C]-0.06929[/C][C]-0.5879[/C][C]0.279204[/C][/ROW]
[ROW][C]27[/C][C]-0.064863[/C][C]-0.5504[/C][C]0.29188[/C][/ROW]
[ROW][C]28[/C][C]-0.029239[/C][C]-0.2481[/C][C]0.40238[/C][/ROW]
[ROW][C]29[/C][C]0.135276[/C][C]1.1479[/C][C]0.127415[/C][/ROW]
[ROW][C]30[/C][C]0.003185[/C][C]0.027[/C][C]0.489257[/C][/ROW]
[ROW][C]31[/C][C]-0.101865[/C][C]-0.8644[/C][C]0.195132[/C][/ROW]
[ROW][C]32[/C][C]-0.038506[/C][C]-0.3267[/C][C]0.372408[/C][/ROW]
[ROW][C]33[/C][C]-0.039282[/C][C]-0.3333[/C][C]0.369932[/C][/ROW]
[ROW][C]34[/C][C]0.027544[/C][C]0.2337[/C][C]0.407934[/C][/ROW]
[ROW][C]35[/C][C]0.029841[/C][C]0.2532[/C][C]0.400413[/C][/ROW]
[ROW][C]36[/C][C]-0.08753[/C][C]-0.7427[/C][C]0.230034[/C][/ROW]
[ROW][C]37[/C][C]-0.085035[/C][C]-0.7215[/C][C]0.236455[/C][/ROW]
[ROW][C]38[/C][C]0.010352[/C][C]0.0878[/C][C]0.465124[/C][/ROW]
[ROW][C]39[/C][C]0.119113[/C][C]1.0107[/C][C]0.15777[/C][/ROW]
[ROW][C]40[/C][C]-0.100965[/C][C]-0.8567[/C][C]0.197221[/C][/ROW]
[ROW][C]41[/C][C]-0.098624[/C][C]-0.8369[/C][C]0.202722[/C][/ROW]
[ROW][C]42[/C][C]0.081895[/C][C]0.6949[/C][C]0.244677[/C][/ROW]
[ROW][C]43[/C][C]-0.070839[/C][C]-0.6011[/C][C]0.274835[/C][/ROW]
[ROW][C]44[/C][C]-0.048765[/C][C]-0.4138[/C][C]0.34013[/C][/ROW]
[ROW][C]45[/C][C]-0.007236[/C][C]-0.0614[/C][C]0.475606[/C][/ROW]
[ROW][C]46[/C][C]-0.036577[/C][C]-0.3104[/C][C]0.37859[/C][/ROW]
[ROW][C]47[/C][C]0.000928[/C][C]0.0079[/C][C]0.496871[/C][/ROW]
[ROW][C]48[/C][C]-0.132598[/C][C]-1.1251[/C][C]0.132135[/C][/ROW]
[/TABLE]
Source: https://freestatistics.org/blog/index.php?pk=42065&T=2

Globally Unique Identifier (entire table): ba.freestatistics.org/blog/index.php?pk=42065&T=2

As an alternative you can also use a QR Code:  

The GUIDs for individual cells are displayed in the table below:

Partial Autocorrelation Function
Time lag kPACF(k)T-STATP-value
10.9640268.180
2-0.486565-4.12864.8e-05
3-0.156713-1.32980.093899
40.1321351.12120.132964
50.0575630.48840.313362
60.0594240.50420.307821
70.019970.16950.432958
8-0.166573-1.41340.080921
90.032780.27810.39085
100.1039660.88220.190306
11-0.077388-0.65670.256748
12-0.023866-0.20250.420043
130.0223890.190.42493
140.0703390.59680.276242
15-0.071989-0.61080.271613
16-0.07391-0.62720.266272
170.0606870.51490.304083
180.0792390.67240.251752
190.0447740.37990.352561
20-0.096532-0.81910.207715
210.0299440.25410.400078
22-0.092566-0.78540.217384
23-0.015572-0.13210.447623
240.0561330.47630.31765
25-0.081927-0.69520.244591
26-0.06929-0.58790.279204
27-0.064863-0.55040.29188
28-0.029239-0.24810.40238
290.1352761.14790.127415
300.0031850.0270.489257
31-0.101865-0.86440.195132
32-0.038506-0.32670.372408
33-0.039282-0.33330.369932
340.0275440.23370.407934
350.0298410.25320.400413
36-0.08753-0.74270.230034
37-0.085035-0.72150.236455
380.0103520.08780.465124
390.1191131.01070.15777
40-0.100965-0.85670.197221
41-0.098624-0.83690.202722
420.0818950.69490.244677
43-0.070839-0.60110.274835
44-0.048765-0.41380.34013
45-0.007236-0.06140.475606
46-0.036577-0.31040.37859
470.0009280.00790.496871
48-0.132598-1.12510.132135


Parameters (Session):
par1 = 48 ; par2 = 1 ; par3 = 0 ; par4 = 0 ; par5 = 12 ;
Parameters (R input):
par1 = 48 ; par2 = 1 ; par3 = 0 ; par4 = 0 ; par5 = 12 ;
R code (references can be found in the software module):
if (par1 == 'Default') {
par1 = 10*log10(length(x))
} else {
par1 <- as.numeric(par1)
}
par2 <- as.numeric(par2)
par3 <- as.numeric(par3)
par4 <- as.numeric(par4)
par5 <- as.numeric(par5)
if (par2 == 0) {
x <- log(x)
} else {
x <- (x ^ par2 - 1) / par2
}
if (par3 > 0) x <- diff(x,lag=1,difference=par3)
if (par4 > 0) x <- diff(x,lag=par5,difference=par4)
bitmap(file='pic1.png')
racf <- acf(x,par1,main='Autocorrelation',xlab='lags',ylab='ACF')
dev.off()
bitmap(file='pic2.png')
rpacf <- pacf(x,par1,main='Partial Autocorrelation',xlab='lags',ylab='PACF')
dev.off()
(myacf <- c(racf$acf))
(mypacf <- c(rpacf$acf))
lengthx <- length(x)
sqrtn <- sqrt(lengthx)
load(file='createtable')
a<-table.start()
a<-table.row.start(a)
a<-table.element(a,'Autocorrelation Function',4,TRUE)
a<-table.row.end(a)
a<-table.row.start(a)
a<-table.element(a,'Time lag k',header=TRUE)
a<-table.element(a,hyperlink('basics.htm','ACF(k)','click here for more information about the Autocorrelation Function'),header=TRUE)
a<-table.element(a,'T-STAT',header=TRUE)
a<-table.element(a,'P-value',header=TRUE)
a<-table.row.end(a)
for (i in 2:(par1+1)) {
a<-table.row.start(a)
a<-table.element(a,i-1,header=TRUE)
a<-table.element(a,round(myacf[i],6))
mytstat <- myacf[i]*sqrtn
a<-table.element(a,round(mytstat,4))
a<-table.element(a,round(1-pt(abs(mytstat),lengthx),6))
a<-table.row.end(a)
}
a<-table.end(a)
table.save(a,file='mytable.tab')
a<-table.start()
a<-table.row.start(a)
a<-table.element(a,'Partial Autocorrelation Function',4,TRUE)
a<-table.row.end(a)
a<-table.row.start(a)
a<-table.element(a,'Time lag k',header=TRUE)
a<-table.element(a,hyperlink('basics.htm','PACF(k)','click here for more information about the Partial Autocorrelation Function'),header=TRUE)
a<-table.element(a,'T-STAT',header=TRUE)
a<-table.element(a,'P-value',header=TRUE)
a<-table.row.end(a)
for (i in 1:par1) {
a<-table.row.start(a)
a<-table.element(a,i,header=TRUE)
a<-table.element(a,round(mypacf[i],6))
mytstat <- mypacf[i]*sqrtn
a<-table.element(a,round(mytstat,4))
a<-table.element(a,round(1-pt(abs(mytstat),lengthx),6))
a<-table.row.end(a)
}
a<-table.end(a)
table.save(a,file='mytable1.tab')