Free Statistics

of Irreproducible Research!

Author's title

Author*Unverified author*
R Software Modulerwasp_exponentialsmoothing.wasp
Title produced by softwareExponential Smoothing
Date of computationFri, 05 Jun 2009 14:08:29 -0600
Cite this page as followsStatistical Computations at FreeStatistics.org, Office for Research Development and Education, URL https://freestatistics.org/blog/index.php?v=date/2009/Jun/05/t1244232553jv9ly0hisujd4i2.htm/, Retrieved Fri, 10 May 2024 21:55:38 +0000
Statistical Computations at FreeStatistics.org, Office for Research Development and Education, URL https://freestatistics.org/blog/index.php?pk=41912, Retrieved Fri, 10 May 2024 21:55:38 +0000
QR Codes:

Original text written by user:
IsPrivate?No (this computation is public)
User-defined keywords
Estimated Impact152
Family? (F = Feedback message, R = changed R code, M = changed R Module, P = changed Parameters, D = changed Data)
-     [Exponential Smoothing] [Exponential Smoot...] [2009-06-04 15:24:33] [2ce3c91abef806693ba7bf55b08cc4e2]
-    D  [Exponential Smoothing] [Kim Van Assche We...] [2009-06-05 20:03:06] [74be16979710d4c4e7c6647856088456]
-   P       [Exponential Smoothing] [Kim Van Assche We...] [2009-06-05 20:08:29] [d41d8cd98f00b204e9800998ecf8427e] [Current]
-   P         [Exponential Smoothing] [Kim Van Assche We...] [2009-06-06 09:06:29] [74be16979710d4c4e7c6647856088456]
Feedback Forum

Post a new message
Dataseries X:
519
517
510
509
501
507
569
580
578
565
547
555
562
561
555
544
537
543
594
611
613
611
594
595
591
589
584
573
567
569
621
629
628
612
595
597
593
590
580
574
573
573
620
626
620
588
566
557
561
549
532
526
511
499
555
565
542
527
510
514
517
508
493
490
469
478
528
534
518
506
502
516


Summary of computational transaction
Raw Inputview raw input (R code)
Raw Outputview raw output of R engine
Computing time2 seconds
R Server'Sir Ronald Aylmer Fisher' @ 193.190.124.24

\begin{tabular}{lllllllll}
\hline
Summary of computational transaction \tabularnewline
Raw Input & view raw input (R code)  \tabularnewline
Raw Output & view raw output of R engine  \tabularnewline
Computing time & 2 seconds \tabularnewline
R Server & 'Sir Ronald Aylmer Fisher' @ 193.190.124.24 \tabularnewline
\hline
\end{tabular}
%Source: https://freestatistics.org/blog/index.php?pk=41912&T=0

[TABLE]
[ROW][C]Summary of computational transaction[/C][/ROW]
[ROW][C]Raw Input[/C][C]view raw input (R code) [/C][/ROW]
[ROW][C]Raw Output[/C][C]view raw output of R engine [/C][/ROW]
[ROW][C]Computing time[/C][C]2 seconds[/C][/ROW]
[ROW][C]R Server[/C][C]'Sir Ronald Aylmer Fisher' @ 193.190.124.24[/C][/ROW]
[/TABLE]
Source: https://freestatistics.org/blog/index.php?pk=41912&T=0

Globally Unique Identifier (entire table): ba.freestatistics.org/blog/index.php?pk=41912&T=0

As an alternative you can also use a QR Code:  

The GUIDs for individual cells are displayed in the table below:

Summary of computational transaction
Raw Inputview raw input (R code)
Raw Outputview raw output of R engine
Computing time2 seconds
R Server'Sir Ronald Aylmer Fisher' @ 193.190.124.24


Estimated Parameters of Exponential Smoothing
ParameterValue
alpha1
beta0
gamma0

\begin{tabular}{lllllllll}
\hline
Estimated Parameters of Exponential Smoothing \tabularnewline
Parameter & Value \tabularnewline
alpha & 1 \tabularnewline
beta & 0 \tabularnewline
gamma & 0 \tabularnewline
\hline
\end{tabular}
%Source: https://freestatistics.org/blog/index.php?pk=41912&T=1

[TABLE]
[ROW][C]Estimated Parameters of Exponential Smoothing[/C][/ROW]
[ROW][C]Parameter[/C][C]Value[/C][/ROW]
[ROW][C]alpha[/C][C]1[/C][/ROW]
[ROW][C]beta[/C][C]0[/C][/ROW]
[ROW][C]gamma[/C][C]0[/C][/ROW]
[/TABLE]
Source: https://freestatistics.org/blog/index.php?pk=41912&T=1

Globally Unique Identifier (entire table): ba.freestatistics.org/blog/index.php?pk=41912&T=1

As an alternative you can also use a QR Code:  

The GUIDs for individual cells are displayed in the table below:

Estimated Parameters of Exponential Smoothing
ParameterValue
alpha1
beta0
gamma0


Interpolation Forecasts of Exponential Smoothing
tObservedFittedResiduals
3510517-7
4509510-1
5501509-8
65075016
756950762
858056911
9578580-2
10565578-13
11547565-18
125555478
135625557
14561562-1
15555561-6
16544555-11
17537544-7
185435376
1959454351
2061159417
216136112
22611613-2
23594611-17
245955941
25591595-4
26589591-2
27584589-5
28573584-11
29567573-6
305695672
3162156952
326296218
33628629-1
34612628-16
35595612-17
365975952
37593597-4
38590593-3
39580590-10
40574580-6
41573574-1
425735730
4362057347
446266206
45620626-6
46588620-32
47566588-22
48557566-9
495615574
50549561-12
51532549-17
52526532-6
53511526-15
54499511-12
5555549956
5656555510
57542565-23
58527542-15
59510527-17
605145104
615175143
62508517-9
63493508-15
64490493-3
65469490-21
664784699
6752847850
685345286
69518534-16
70506518-12
71502506-4
7251650214

\begin{tabular}{lllllllll}
\hline
Interpolation Forecasts of Exponential Smoothing \tabularnewline
t & Observed & Fitted & Residuals \tabularnewline
3 & 510 & 517 & -7 \tabularnewline
4 & 509 & 510 & -1 \tabularnewline
5 & 501 & 509 & -8 \tabularnewline
6 & 507 & 501 & 6 \tabularnewline
7 & 569 & 507 & 62 \tabularnewline
8 & 580 & 569 & 11 \tabularnewline
9 & 578 & 580 & -2 \tabularnewline
10 & 565 & 578 & -13 \tabularnewline
11 & 547 & 565 & -18 \tabularnewline
12 & 555 & 547 & 8 \tabularnewline
13 & 562 & 555 & 7 \tabularnewline
14 & 561 & 562 & -1 \tabularnewline
15 & 555 & 561 & -6 \tabularnewline
16 & 544 & 555 & -11 \tabularnewline
17 & 537 & 544 & -7 \tabularnewline
18 & 543 & 537 & 6 \tabularnewline
19 & 594 & 543 & 51 \tabularnewline
20 & 611 & 594 & 17 \tabularnewline
21 & 613 & 611 & 2 \tabularnewline
22 & 611 & 613 & -2 \tabularnewline
23 & 594 & 611 & -17 \tabularnewline
24 & 595 & 594 & 1 \tabularnewline
25 & 591 & 595 & -4 \tabularnewline
26 & 589 & 591 & -2 \tabularnewline
27 & 584 & 589 & -5 \tabularnewline
28 & 573 & 584 & -11 \tabularnewline
29 & 567 & 573 & -6 \tabularnewline
30 & 569 & 567 & 2 \tabularnewline
31 & 621 & 569 & 52 \tabularnewline
32 & 629 & 621 & 8 \tabularnewline
33 & 628 & 629 & -1 \tabularnewline
34 & 612 & 628 & -16 \tabularnewline
35 & 595 & 612 & -17 \tabularnewline
36 & 597 & 595 & 2 \tabularnewline
37 & 593 & 597 & -4 \tabularnewline
38 & 590 & 593 & -3 \tabularnewline
39 & 580 & 590 & -10 \tabularnewline
40 & 574 & 580 & -6 \tabularnewline
41 & 573 & 574 & -1 \tabularnewline
42 & 573 & 573 & 0 \tabularnewline
43 & 620 & 573 & 47 \tabularnewline
44 & 626 & 620 & 6 \tabularnewline
45 & 620 & 626 & -6 \tabularnewline
46 & 588 & 620 & -32 \tabularnewline
47 & 566 & 588 & -22 \tabularnewline
48 & 557 & 566 & -9 \tabularnewline
49 & 561 & 557 & 4 \tabularnewline
50 & 549 & 561 & -12 \tabularnewline
51 & 532 & 549 & -17 \tabularnewline
52 & 526 & 532 & -6 \tabularnewline
53 & 511 & 526 & -15 \tabularnewline
54 & 499 & 511 & -12 \tabularnewline
55 & 555 & 499 & 56 \tabularnewline
56 & 565 & 555 & 10 \tabularnewline
57 & 542 & 565 & -23 \tabularnewline
58 & 527 & 542 & -15 \tabularnewline
59 & 510 & 527 & -17 \tabularnewline
60 & 514 & 510 & 4 \tabularnewline
61 & 517 & 514 & 3 \tabularnewline
62 & 508 & 517 & -9 \tabularnewline
63 & 493 & 508 & -15 \tabularnewline
64 & 490 & 493 & -3 \tabularnewline
65 & 469 & 490 & -21 \tabularnewline
66 & 478 & 469 & 9 \tabularnewline
67 & 528 & 478 & 50 \tabularnewline
68 & 534 & 528 & 6 \tabularnewline
69 & 518 & 534 & -16 \tabularnewline
70 & 506 & 518 & -12 \tabularnewline
71 & 502 & 506 & -4 \tabularnewline
72 & 516 & 502 & 14 \tabularnewline
\hline
\end{tabular}
%Source: https://freestatistics.org/blog/index.php?pk=41912&T=2

[TABLE]
[ROW][C]Interpolation Forecasts of Exponential Smoothing[/C][/ROW]
[ROW][C]t[/C][C]Observed[/C][C]Fitted[/C][C]Residuals[/C][/ROW]
[ROW][C]3[/C][C]510[/C][C]517[/C][C]-7[/C][/ROW]
[ROW][C]4[/C][C]509[/C][C]510[/C][C]-1[/C][/ROW]
[ROW][C]5[/C][C]501[/C][C]509[/C][C]-8[/C][/ROW]
[ROW][C]6[/C][C]507[/C][C]501[/C][C]6[/C][/ROW]
[ROW][C]7[/C][C]569[/C][C]507[/C][C]62[/C][/ROW]
[ROW][C]8[/C][C]580[/C][C]569[/C][C]11[/C][/ROW]
[ROW][C]9[/C][C]578[/C][C]580[/C][C]-2[/C][/ROW]
[ROW][C]10[/C][C]565[/C][C]578[/C][C]-13[/C][/ROW]
[ROW][C]11[/C][C]547[/C][C]565[/C][C]-18[/C][/ROW]
[ROW][C]12[/C][C]555[/C][C]547[/C][C]8[/C][/ROW]
[ROW][C]13[/C][C]562[/C][C]555[/C][C]7[/C][/ROW]
[ROW][C]14[/C][C]561[/C][C]562[/C][C]-1[/C][/ROW]
[ROW][C]15[/C][C]555[/C][C]561[/C][C]-6[/C][/ROW]
[ROW][C]16[/C][C]544[/C][C]555[/C][C]-11[/C][/ROW]
[ROW][C]17[/C][C]537[/C][C]544[/C][C]-7[/C][/ROW]
[ROW][C]18[/C][C]543[/C][C]537[/C][C]6[/C][/ROW]
[ROW][C]19[/C][C]594[/C][C]543[/C][C]51[/C][/ROW]
[ROW][C]20[/C][C]611[/C][C]594[/C][C]17[/C][/ROW]
[ROW][C]21[/C][C]613[/C][C]611[/C][C]2[/C][/ROW]
[ROW][C]22[/C][C]611[/C][C]613[/C][C]-2[/C][/ROW]
[ROW][C]23[/C][C]594[/C][C]611[/C][C]-17[/C][/ROW]
[ROW][C]24[/C][C]595[/C][C]594[/C][C]1[/C][/ROW]
[ROW][C]25[/C][C]591[/C][C]595[/C][C]-4[/C][/ROW]
[ROW][C]26[/C][C]589[/C][C]591[/C][C]-2[/C][/ROW]
[ROW][C]27[/C][C]584[/C][C]589[/C][C]-5[/C][/ROW]
[ROW][C]28[/C][C]573[/C][C]584[/C][C]-11[/C][/ROW]
[ROW][C]29[/C][C]567[/C][C]573[/C][C]-6[/C][/ROW]
[ROW][C]30[/C][C]569[/C][C]567[/C][C]2[/C][/ROW]
[ROW][C]31[/C][C]621[/C][C]569[/C][C]52[/C][/ROW]
[ROW][C]32[/C][C]629[/C][C]621[/C][C]8[/C][/ROW]
[ROW][C]33[/C][C]628[/C][C]629[/C][C]-1[/C][/ROW]
[ROW][C]34[/C][C]612[/C][C]628[/C][C]-16[/C][/ROW]
[ROW][C]35[/C][C]595[/C][C]612[/C][C]-17[/C][/ROW]
[ROW][C]36[/C][C]597[/C][C]595[/C][C]2[/C][/ROW]
[ROW][C]37[/C][C]593[/C][C]597[/C][C]-4[/C][/ROW]
[ROW][C]38[/C][C]590[/C][C]593[/C][C]-3[/C][/ROW]
[ROW][C]39[/C][C]580[/C][C]590[/C][C]-10[/C][/ROW]
[ROW][C]40[/C][C]574[/C][C]580[/C][C]-6[/C][/ROW]
[ROW][C]41[/C][C]573[/C][C]574[/C][C]-1[/C][/ROW]
[ROW][C]42[/C][C]573[/C][C]573[/C][C]0[/C][/ROW]
[ROW][C]43[/C][C]620[/C][C]573[/C][C]47[/C][/ROW]
[ROW][C]44[/C][C]626[/C][C]620[/C][C]6[/C][/ROW]
[ROW][C]45[/C][C]620[/C][C]626[/C][C]-6[/C][/ROW]
[ROW][C]46[/C][C]588[/C][C]620[/C][C]-32[/C][/ROW]
[ROW][C]47[/C][C]566[/C][C]588[/C][C]-22[/C][/ROW]
[ROW][C]48[/C][C]557[/C][C]566[/C][C]-9[/C][/ROW]
[ROW][C]49[/C][C]561[/C][C]557[/C][C]4[/C][/ROW]
[ROW][C]50[/C][C]549[/C][C]561[/C][C]-12[/C][/ROW]
[ROW][C]51[/C][C]532[/C][C]549[/C][C]-17[/C][/ROW]
[ROW][C]52[/C][C]526[/C][C]532[/C][C]-6[/C][/ROW]
[ROW][C]53[/C][C]511[/C][C]526[/C][C]-15[/C][/ROW]
[ROW][C]54[/C][C]499[/C][C]511[/C][C]-12[/C][/ROW]
[ROW][C]55[/C][C]555[/C][C]499[/C][C]56[/C][/ROW]
[ROW][C]56[/C][C]565[/C][C]555[/C][C]10[/C][/ROW]
[ROW][C]57[/C][C]542[/C][C]565[/C][C]-23[/C][/ROW]
[ROW][C]58[/C][C]527[/C][C]542[/C][C]-15[/C][/ROW]
[ROW][C]59[/C][C]510[/C][C]527[/C][C]-17[/C][/ROW]
[ROW][C]60[/C][C]514[/C][C]510[/C][C]4[/C][/ROW]
[ROW][C]61[/C][C]517[/C][C]514[/C][C]3[/C][/ROW]
[ROW][C]62[/C][C]508[/C][C]517[/C][C]-9[/C][/ROW]
[ROW][C]63[/C][C]493[/C][C]508[/C][C]-15[/C][/ROW]
[ROW][C]64[/C][C]490[/C][C]493[/C][C]-3[/C][/ROW]
[ROW][C]65[/C][C]469[/C][C]490[/C][C]-21[/C][/ROW]
[ROW][C]66[/C][C]478[/C][C]469[/C][C]9[/C][/ROW]
[ROW][C]67[/C][C]528[/C][C]478[/C][C]50[/C][/ROW]
[ROW][C]68[/C][C]534[/C][C]528[/C][C]6[/C][/ROW]
[ROW][C]69[/C][C]518[/C][C]534[/C][C]-16[/C][/ROW]
[ROW][C]70[/C][C]506[/C][C]518[/C][C]-12[/C][/ROW]
[ROW][C]71[/C][C]502[/C][C]506[/C][C]-4[/C][/ROW]
[ROW][C]72[/C][C]516[/C][C]502[/C][C]14[/C][/ROW]
[/TABLE]
Source: https://freestatistics.org/blog/index.php?pk=41912&T=2

Globally Unique Identifier (entire table): ba.freestatistics.org/blog/index.php?pk=41912&T=2

As an alternative you can also use a QR Code:  

The GUIDs for individual cells are displayed in the table below:

Interpolation Forecasts of Exponential Smoothing
tObservedFittedResiduals
3510517-7
4509510-1
5501509-8
65075016
756950762
858056911
9578580-2
10565578-13
11547565-18
125555478
135625557
14561562-1
15555561-6
16544555-11
17537544-7
185435376
1959454351
2061159417
216136112
22611613-2
23594611-17
245955941
25591595-4
26589591-2
27584589-5
28573584-11
29567573-6
305695672
3162156952
326296218
33628629-1
34612628-16
35595612-17
365975952
37593597-4
38590593-3
39580590-10
40574580-6
41573574-1
425735730
4362057347
446266206
45620626-6
46588620-32
47566588-22
48557566-9
495615574
50549561-12
51532549-17
52526532-6
53511526-15
54499511-12
5555549956
5656555510
57542565-23
58527542-15
59510527-17
605145104
615175143
62508517-9
63493508-15
64490493-3
65469490-21
664784699
6752847850
685345286
69518534-16
70506518-12
71502506-4
7251650214


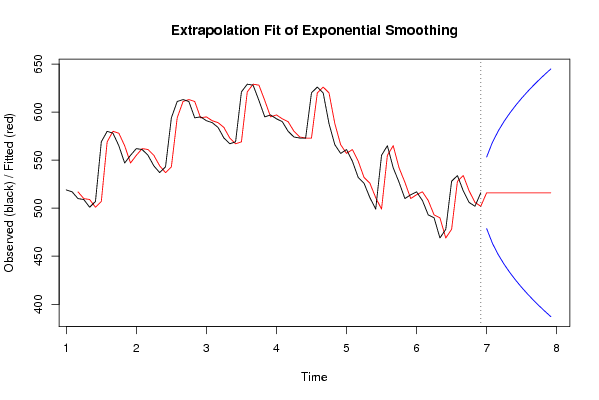
Extrapolation Forecasts of Exponential Smoothing
tForecast95% Lower Bound95% Upper Bound
73516478.801082275684553.198917724316
74516463.392786048672568.607213951329
75516451.56958451491580.43041548509
76516441.602164551368590.397835448632
77516432.820691279008599.179308720992
78516424.881632591653607.118367408347
79516417.580914660707614.419085339293
80516410.785572097343621.214427902657
81516404.403246827052627.596753172948
82516398.366693497954633.633306502046
83516392.625147301143639.374852698857
84516387.139169029821644.860830970179

\begin{tabular}{lllllllll}
\hline
Extrapolation Forecasts of Exponential Smoothing \tabularnewline
t & Forecast & 95% Lower Bound & 95% Upper Bound \tabularnewline
73 & 516 & 478.801082275684 & 553.198917724316 \tabularnewline
74 & 516 & 463.392786048672 & 568.607213951329 \tabularnewline
75 & 516 & 451.56958451491 & 580.43041548509 \tabularnewline
76 & 516 & 441.602164551368 & 590.397835448632 \tabularnewline
77 & 516 & 432.820691279008 & 599.179308720992 \tabularnewline
78 & 516 & 424.881632591653 & 607.118367408347 \tabularnewline
79 & 516 & 417.580914660707 & 614.419085339293 \tabularnewline
80 & 516 & 410.785572097343 & 621.214427902657 \tabularnewline
81 & 516 & 404.403246827052 & 627.596753172948 \tabularnewline
82 & 516 & 398.366693497954 & 633.633306502046 \tabularnewline
83 & 516 & 392.625147301143 & 639.374852698857 \tabularnewline
84 & 516 & 387.139169029821 & 644.860830970179 \tabularnewline
\hline
\end{tabular}
%Source: https://freestatistics.org/blog/index.php?pk=41912&T=3

[TABLE]
[ROW][C]Extrapolation Forecasts of Exponential Smoothing[/C][/ROW]
[ROW][C]t[/C][C]Forecast[/C][C]95% Lower Bound[/C][C]95% Upper Bound[/C][/ROW]
[ROW][C]73[/C][C]516[/C][C]478.801082275684[/C][C]553.198917724316[/C][/ROW]
[ROW][C]74[/C][C]516[/C][C]463.392786048672[/C][C]568.607213951329[/C][/ROW]
[ROW][C]75[/C][C]516[/C][C]451.56958451491[/C][C]580.43041548509[/C][/ROW]
[ROW][C]76[/C][C]516[/C][C]441.602164551368[/C][C]590.397835448632[/C][/ROW]
[ROW][C]77[/C][C]516[/C][C]432.820691279008[/C][C]599.179308720992[/C][/ROW]
[ROW][C]78[/C][C]516[/C][C]424.881632591653[/C][C]607.118367408347[/C][/ROW]
[ROW][C]79[/C][C]516[/C][C]417.580914660707[/C][C]614.419085339293[/C][/ROW]
[ROW][C]80[/C][C]516[/C][C]410.785572097343[/C][C]621.214427902657[/C][/ROW]
[ROW][C]81[/C][C]516[/C][C]404.403246827052[/C][C]627.596753172948[/C][/ROW]
[ROW][C]82[/C][C]516[/C][C]398.366693497954[/C][C]633.633306502046[/C][/ROW]
[ROW][C]83[/C][C]516[/C][C]392.625147301143[/C][C]639.374852698857[/C][/ROW]
[ROW][C]84[/C][C]516[/C][C]387.139169029821[/C][C]644.860830970179[/C][/ROW]
[/TABLE]
Source: https://freestatistics.org/blog/index.php?pk=41912&T=3

Globally Unique Identifier (entire table): ba.freestatistics.org/blog/index.php?pk=41912&T=3

As an alternative you can also use a QR Code:  

The GUIDs for individual cells are displayed in the table below:

Extrapolation Forecasts of Exponential Smoothing
tForecast95% Lower Bound95% Upper Bound
73516478.801082275684553.198917724316
74516463.392786048672568.607213951329
75516451.56958451491580.43041548509
76516441.602164551368590.397835448632
77516432.820691279008599.179308720992
78516424.881632591653607.118367408347
79516417.580914660707614.419085339293
80516410.785572097343621.214427902657
81516404.403246827052627.596753172948
82516398.366693497954633.633306502046
83516392.625147301143639.374852698857
84516387.139169029821644.860830970179


Parameters (Session):
par1 = 12 ; par2 = Double ; par3 = additive ;
Parameters (R input):
par1 = 12 ; par2 = Double ; par3 = additive ;
R code (references can be found in the software module):
par1 <- as.numeric(par1)
if (par2 == 'Single') K <- 1
if (par2 == 'Double') K <- 2
if (par2 == 'Triple') K <- par1
nx <- length(x)
nxmK <- nx - K
x <- ts(x, frequency = par1)
if (par2 == 'Single') fit <- HoltWinters(x, gamma=0, beta=0)
if (par2 == 'Double') fit <- HoltWinters(x, gamma=0)
if (par2 == 'Triple') fit <- HoltWinters(x, seasonal=par3)
fit
myresid <- x - fit$fitted[,'xhat']
bitmap(file='test1.png')
op <- par(mfrow=c(2,1))
plot(fit,ylab='Observed (black) / Fitted (red)',main='Interpolation Fit of Exponential Smoothing')
plot(myresid,ylab='Residuals',main='Interpolation Prediction Errors')
par(op)
dev.off()
bitmap(file='test2.png')
p <- predict(fit, par1, prediction.interval=TRUE)
np <- length(p[,1])
plot(fit,p,ylab='Observed (black) / Fitted (red)',main='Extrapolation Fit of Exponential Smoothing')
dev.off()
bitmap(file='test3.png')
op <- par(mfrow = c(2,2))
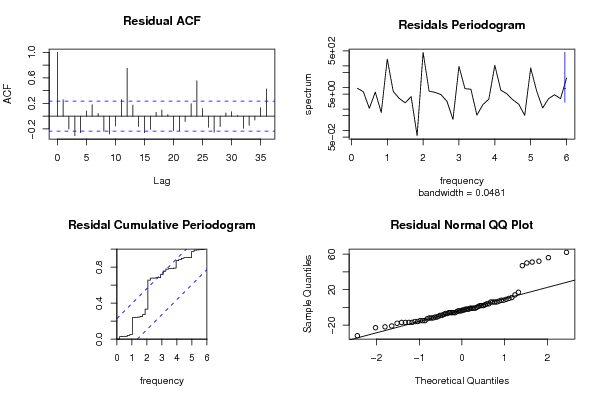
acf(as.numeric(myresid),lag.max = nx/2,main='Residual ACF')
spectrum(myresid,main='Residals Periodogram')
cpgram(myresid,main='Residal Cumulative Periodogram')
qqnorm(myresid,main='Residual Normal QQ Plot')
qqline(myresid)
par(op)
dev.off()
load(file='createtable')
a<-table.start()
a<-table.row.start(a)
a<-table.element(a,'Estimated Parameters of Exponential Smoothing',2,TRUE)
a<-table.row.end(a)
a<-table.row.start(a)
a<-table.element(a,'Parameter',header=TRUE)
a<-table.element(a,'Value',header=TRUE)
a<-table.row.end(a)
a<-table.row.start(a)
a<-table.element(a,'alpha',header=TRUE)
a<-table.element(a,fit$alpha)
a<-table.row.end(a)
a<-table.row.start(a)
a<-table.element(a,'beta',header=TRUE)
a<-table.element(a,fit$beta)
a<-table.row.end(a)
a<-table.row.start(a)
a<-table.element(a,'gamma',header=TRUE)
a<-table.element(a,fit$gamma)
a<-table.row.end(a)
a<-table.end(a)
table.save(a,file='mytable.tab')
a<-table.start()
a<-table.row.start(a)
a<-table.element(a,'Interpolation Forecasts of Exponential Smoothing',4,TRUE)
a<-table.row.end(a)
a<-table.row.start(a)
a<-table.element(a,'t',header=TRUE)
a<-table.element(a,'Observed',header=TRUE)
a<-table.element(a,'Fitted',header=TRUE)
a<-table.element(a,'Residuals',header=TRUE)
a<-table.row.end(a)
for (i in 1:nxmK) {
a<-table.row.start(a)
a<-table.element(a,i+K,header=TRUE)
a<-table.element(a,x[i+K])
a<-table.element(a,fit$fitted[i,'xhat'])
a<-table.element(a,myresid[i])
a<-table.row.end(a)
}
a<-table.end(a)
table.save(a,file='mytable1.tab')
a<-table.start()
a<-table.row.start(a)
a<-table.element(a,'Extrapolation Forecasts of Exponential Smoothing',4,TRUE)
a<-table.row.end(a)
a<-table.row.start(a)
a<-table.element(a,'t',header=TRUE)
a<-table.element(a,'Forecast',header=TRUE)
a<-table.element(a,'95% Lower Bound',header=TRUE)
a<-table.element(a,'95% Upper Bound',header=TRUE)
a<-table.row.end(a)
for (i in 1:np) {
a<-table.row.start(a)
a<-table.element(a,nx+i,header=TRUE)
a<-table.element(a,p[i,'fit'])
a<-table.element(a,p[i,'lwr'])
a<-table.element(a,p[i,'upr'])
a<-table.row.end(a)
}
a<-table.end(a)
table.save(a,file='mytable2.tab')