Free Statistics

of Irreproducible Research!

Author's title

Author*Unverified author*
R Software Modulerwasp_exponentialsmoothing.wasp
Title produced by softwareExponential Smoothing
Date of computationFri, 05 Jun 2009 09:15:35 -0600
Cite this page as followsStatistical Computations at FreeStatistics.org, Office for Research Development and Education, URL https://freestatistics.org/blog/index.php?v=date/2009/Jun/05/t1244214964c8ocxo4a8s5tu11.htm/, Retrieved Fri, 10 May 2024 21:58:57 +0000
Statistical Computations at FreeStatistics.org, Office for Research Development and Education, URL https://freestatistics.org/blog/index.php?pk=41867, Retrieved Fri, 10 May 2024 21:58:57 +0000
QR Codes:

Original text written by user:
IsPrivate?No (this computation is public)
User-defined keywords
Estimated Impact146
Family? (F = Feedback message, R = changed R code, M = changed R Module, P = changed Parameters, D = changed Data)
-     [Bootstrap Plot - Central Tendency] [bootstrapplot] [2009-06-04 15:33:12] [74be16979710d4c4e7c6647856088456]
- RMP     [Exponential Smoothing] [opgave10bW.Verlinden] [2009-06-05 15:15:35] [d41d8cd98f00b204e9800998ecf8427e] [Current]
Feedback Forum

Post a new message
Dataseries X:
665272
661735
621014
574889
677734
717075
653612
690697
665864
830701
789303
617808
805775
909449
599973
955874
799494
876097
823300
900079
860754
923882
1121084
741757
966066
901978
648659
852732
706036
835792
722489
714262
739459
816834
743082
683375
1006000
866000
644000
703000
699000
713000
688000
672000
600000
847000
697000
687000
973000
796000
658000
709000
798000
820000
776000
699000
828433
942131
792916
864942
982689
948143
874863
735794
854605
1284216
961585
818379
1079498
1095091
1008925
967118
1127715


Summary of computational transaction
Raw Inputview raw input (R code)
Raw Outputview raw output of R engine
Computing time1 seconds
R Server'Gwilym Jenkins' @ 72.249.127.135

\begin{tabular}{lllllllll}
\hline
Summary of computational transaction \tabularnewline
Raw Input & view raw input (R code)  \tabularnewline
Raw Output & view raw output of R engine  \tabularnewline
Computing time & 1 seconds \tabularnewline
R Server & 'Gwilym Jenkins' @ 72.249.127.135 \tabularnewline
\hline
\end{tabular}
%Source: https://freestatistics.org/blog/index.php?pk=41867&T=0

[TABLE]
[ROW][C]Summary of computational transaction[/C][/ROW]
[ROW][C]Raw Input[/C][C]view raw input (R code) [/C][/ROW]
[ROW][C]Raw Output[/C][C]view raw output of R engine [/C][/ROW]
[ROW][C]Computing time[/C][C]1 seconds[/C][/ROW]
[ROW][C]R Server[/C][C]'Gwilym Jenkins' @ 72.249.127.135[/C][/ROW]
[/TABLE]
Source: https://freestatistics.org/blog/index.php?pk=41867&T=0

Globally Unique Identifier (entire table): ba.freestatistics.org/blog/index.php?pk=41867&T=0

As an alternative you can also use a QR Code:  

The GUIDs for individual cells are displayed in the table below:

Summary of computational transaction
Raw Inputview raw input (R code)
Raw Outputview raw output of R engine
Computing time1 seconds
R Server'Gwilym Jenkins' @ 72.249.127.135


Estimated Parameters of Exponential Smoothing
ParameterValue
alpha0.380224313860241
beta0.020939568714286
gamma0.880171901277375

\begin{tabular}{lllllllll}
\hline
Estimated Parameters of Exponential Smoothing \tabularnewline
Parameter & Value \tabularnewline
alpha & 0.380224313860241 \tabularnewline
beta & 0.020939568714286 \tabularnewline
gamma & 0.880171901277375 \tabularnewline
\hline
\end{tabular}
%Source: https://freestatistics.org/blog/index.php?pk=41867&T=1

[TABLE]
[ROW][C]Estimated Parameters of Exponential Smoothing[/C][/ROW]
[ROW][C]Parameter[/C][C]Value[/C][/ROW]
[ROW][C]alpha[/C][C]0.380224313860241[/C][/ROW]
[ROW][C]beta[/C][C]0.020939568714286[/C][/ROW]
[ROW][C]gamma[/C][C]0.880171901277375[/C][/ROW]
[/TABLE]
Source: https://freestatistics.org/blog/index.php?pk=41867&T=1

Globally Unique Identifier (entire table): ba.freestatistics.org/blog/index.php?pk=41867&T=1

As an alternative you can also use a QR Code:  

The GUIDs for individual cells are displayed in the table below:

Estimated Parameters of Exponential Smoothing
ParameterValue
alpha0.380224313860241
beta0.020939568714286
gamma0.880171901277375


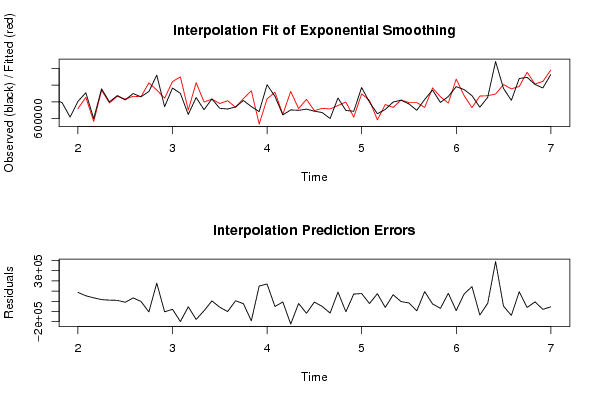
Interpolation Forecasts of Exponential Smoothing
tObservedFittedResiduals
13805775718406.61057692387368.3894230766
14909449855318.56049858554130.4395014151
15599973565823.52249826434149.4775017363
16955874939221.83429165616652.1657083437
17799494788115.03114702911378.9688529712
18876097866794.8266597129302.17334028834
19823300832958.785445379-9658.78544537851
20900079866931.7176810633147.2823189399
21860754862257.467477854-1503.46747785353
229238821028513.23116823-104631.231168231
231121084942539.224061432178544.775938568
24741757844808.604152631-103051.604152631
259660661044312.97979541-78246.9797954111
269019781100442.50086780-198464.500867802
27648659702314.000881889-53655.0008818891
288527321030391.96910099-177659.969100993
29706036798589.326908614-92553.3269086143
30835792831854.080618523937.91938148078
31722489780827.78945107-58338.7894510698
32714262814447.67097411-100185.67097411
33739459733918.2968579745540.70314202609
34816834840394.978828436-23560.9788284361
35743082934166.10519183-191084.105191829
36683375533782.461942105149592.538057895
371006000836393.182487073169606.817512927
38866000916670.082232239-50670.0822322386
39644000650395.315443437-6395.31544343662
40703000925836.78545995-222836.785459951
41699000719963.649440517-20963.6494405171
42713000830335.752865224-117335.752865224
43688000695510.556683143-7510.55668314267
44672000722318.200373803-50318.2003738035
456e+05715510.875149156-115510.875149156
46847000756208.31008960990791.6899103915
47697000799106.889516008-102106.889516008
48687000616138.36926738070861.6307326205
49973000896846.42074410376153.579255897
50796000817797.778014666-21797.7780146664
51658000583253.84095177674746.1590482239
52709000768723.085689035-59723.0856890354
53798000733538.6679289964461.33207101
54820000823044.97564338-3044.97564338031
55776000791721.926199214-15721.9261992142
56699000792125.435374473-93125.4353744728
57828433733207.72749009895225.2725099018
58942131967979.09934044-25848.0993404402
59792916861778.795188115-68862.795188115
60864942786549.41713527878392.5828647225
619826891073810.70527378-91121.705273784
62948143877197.74926445970945.250735541
63874863730792.14045647144070.859543529
64735794870027.637357362-134233.637357362
65854605874424.516599558-19819.5165995579
661284216894557.15164276389658.84835724
679615851008258.11815969-46673.118159687
68818379957046.350818993-138667.350818993
691079498985574.38148737593923.6185126251
7010950911155808.68664253-60717.686642533
7110089251014612.07056818-5687.07056818123
729671181045962.64545584-78844.6454558376
7311277151181944.89242415-54229.892424149

\begin{tabular}{lllllllll}
\hline
Interpolation Forecasts of Exponential Smoothing \tabularnewline
t & Observed & Fitted & Residuals \tabularnewline
13 & 805775 & 718406.610576923 & 87368.3894230766 \tabularnewline
14 & 909449 & 855318.560498585 & 54130.4395014151 \tabularnewline
15 & 599973 & 565823.522498264 & 34149.4775017363 \tabularnewline
16 & 955874 & 939221.834291656 & 16652.1657083437 \tabularnewline
17 & 799494 & 788115.031147029 & 11378.9688529712 \tabularnewline
18 & 876097 & 866794.826659712 & 9302.17334028834 \tabularnewline
19 & 823300 & 832958.785445379 & -9658.78544537851 \tabularnewline
20 & 900079 & 866931.71768106 & 33147.2823189399 \tabularnewline
21 & 860754 & 862257.467477854 & -1503.46747785353 \tabularnewline
22 & 923882 & 1028513.23116823 & -104631.231168231 \tabularnewline
23 & 1121084 & 942539.224061432 & 178544.775938568 \tabularnewline
24 & 741757 & 844808.604152631 & -103051.604152631 \tabularnewline
25 & 966066 & 1044312.97979541 & -78246.9797954111 \tabularnewline
26 & 901978 & 1100442.50086780 & -198464.500867802 \tabularnewline
27 & 648659 & 702314.000881889 & -53655.0008818891 \tabularnewline
28 & 852732 & 1030391.96910099 & -177659.969100993 \tabularnewline
29 & 706036 & 798589.326908614 & -92553.3269086143 \tabularnewline
30 & 835792 & 831854.08061852 & 3937.91938148078 \tabularnewline
31 & 722489 & 780827.78945107 & -58338.7894510698 \tabularnewline
32 & 714262 & 814447.67097411 & -100185.67097411 \tabularnewline
33 & 739459 & 733918.296857974 & 5540.70314202609 \tabularnewline
34 & 816834 & 840394.978828436 & -23560.9788284361 \tabularnewline
35 & 743082 & 934166.10519183 & -191084.105191829 \tabularnewline
36 & 683375 & 533782.461942105 & 149592.538057895 \tabularnewline
37 & 1006000 & 836393.182487073 & 169606.817512927 \tabularnewline
38 & 866000 & 916670.082232239 & -50670.0822322386 \tabularnewline
39 & 644000 & 650395.315443437 & -6395.31544343662 \tabularnewline
40 & 703000 & 925836.78545995 & -222836.785459951 \tabularnewline
41 & 699000 & 719963.649440517 & -20963.6494405171 \tabularnewline
42 & 713000 & 830335.752865224 & -117335.752865224 \tabularnewline
43 & 688000 & 695510.556683143 & -7510.55668314267 \tabularnewline
44 & 672000 & 722318.200373803 & -50318.2003738035 \tabularnewline
45 & 6e+05 & 715510.875149156 & -115510.875149156 \tabularnewline
46 & 847000 & 756208.310089609 & 90791.6899103915 \tabularnewline
47 & 697000 & 799106.889516008 & -102106.889516008 \tabularnewline
48 & 687000 & 616138.369267380 & 70861.6307326205 \tabularnewline
49 & 973000 & 896846.420744103 & 76153.579255897 \tabularnewline
50 & 796000 & 817797.778014666 & -21797.7780146664 \tabularnewline
51 & 658000 & 583253.840951776 & 74746.1590482239 \tabularnewline
52 & 709000 & 768723.085689035 & -59723.0856890354 \tabularnewline
53 & 798000 & 733538.66792899 & 64461.33207101 \tabularnewline
54 & 820000 & 823044.97564338 & -3044.97564338031 \tabularnewline
55 & 776000 & 791721.926199214 & -15721.9261992142 \tabularnewline
56 & 699000 & 792125.435374473 & -93125.4353744728 \tabularnewline
57 & 828433 & 733207.727490098 & 95225.2725099018 \tabularnewline
58 & 942131 & 967979.09934044 & -25848.0993404402 \tabularnewline
59 & 792916 & 861778.795188115 & -68862.795188115 \tabularnewline
60 & 864942 & 786549.417135278 & 78392.5828647225 \tabularnewline
61 & 982689 & 1073810.70527378 & -91121.705273784 \tabularnewline
62 & 948143 & 877197.749264459 & 70945.250735541 \tabularnewline
63 & 874863 & 730792.14045647 & 144070.859543529 \tabularnewline
64 & 735794 & 870027.637357362 & -134233.637357362 \tabularnewline
65 & 854605 & 874424.516599558 & -19819.5165995579 \tabularnewline
66 & 1284216 & 894557.15164276 & 389658.84835724 \tabularnewline
67 & 961585 & 1008258.11815969 & -46673.118159687 \tabularnewline
68 & 818379 & 957046.350818993 & -138667.350818993 \tabularnewline
69 & 1079498 & 985574.381487375 & 93923.6185126251 \tabularnewline
70 & 1095091 & 1155808.68664253 & -60717.686642533 \tabularnewline
71 & 1008925 & 1014612.07056818 & -5687.07056818123 \tabularnewline
72 & 967118 & 1045962.64545584 & -78844.6454558376 \tabularnewline
73 & 1127715 & 1181944.89242415 & -54229.892424149 \tabularnewline
\hline
\end{tabular}
%Source: https://freestatistics.org/blog/index.php?pk=41867&T=2

[TABLE]
[ROW][C]Interpolation Forecasts of Exponential Smoothing[/C][/ROW]
[ROW][C]t[/C][C]Observed[/C][C]Fitted[/C][C]Residuals[/C][/ROW]
[ROW][C]13[/C][C]805775[/C][C]718406.610576923[/C][C]87368.3894230766[/C][/ROW]
[ROW][C]14[/C][C]909449[/C][C]855318.560498585[/C][C]54130.4395014151[/C][/ROW]
[ROW][C]15[/C][C]599973[/C][C]565823.522498264[/C][C]34149.4775017363[/C][/ROW]
[ROW][C]16[/C][C]955874[/C][C]939221.834291656[/C][C]16652.1657083437[/C][/ROW]
[ROW][C]17[/C][C]799494[/C][C]788115.031147029[/C][C]11378.9688529712[/C][/ROW]
[ROW][C]18[/C][C]876097[/C][C]866794.826659712[/C][C]9302.17334028834[/C][/ROW]
[ROW][C]19[/C][C]823300[/C][C]832958.785445379[/C][C]-9658.78544537851[/C][/ROW]
[ROW][C]20[/C][C]900079[/C][C]866931.71768106[/C][C]33147.2823189399[/C][/ROW]
[ROW][C]21[/C][C]860754[/C][C]862257.467477854[/C][C]-1503.46747785353[/C][/ROW]
[ROW][C]22[/C][C]923882[/C][C]1028513.23116823[/C][C]-104631.231168231[/C][/ROW]
[ROW][C]23[/C][C]1121084[/C][C]942539.224061432[/C][C]178544.775938568[/C][/ROW]
[ROW][C]24[/C][C]741757[/C][C]844808.604152631[/C][C]-103051.604152631[/C][/ROW]
[ROW][C]25[/C][C]966066[/C][C]1044312.97979541[/C][C]-78246.9797954111[/C][/ROW]
[ROW][C]26[/C][C]901978[/C][C]1100442.50086780[/C][C]-198464.500867802[/C][/ROW]
[ROW][C]27[/C][C]648659[/C][C]702314.000881889[/C][C]-53655.0008818891[/C][/ROW]
[ROW][C]28[/C][C]852732[/C][C]1030391.96910099[/C][C]-177659.969100993[/C][/ROW]
[ROW][C]29[/C][C]706036[/C][C]798589.326908614[/C][C]-92553.3269086143[/C][/ROW]
[ROW][C]30[/C][C]835792[/C][C]831854.08061852[/C][C]3937.91938148078[/C][/ROW]
[ROW][C]31[/C][C]722489[/C][C]780827.78945107[/C][C]-58338.7894510698[/C][/ROW]
[ROW][C]32[/C][C]714262[/C][C]814447.67097411[/C][C]-100185.67097411[/C][/ROW]
[ROW][C]33[/C][C]739459[/C][C]733918.296857974[/C][C]5540.70314202609[/C][/ROW]
[ROW][C]34[/C][C]816834[/C][C]840394.978828436[/C][C]-23560.9788284361[/C][/ROW]
[ROW][C]35[/C][C]743082[/C][C]934166.10519183[/C][C]-191084.105191829[/C][/ROW]
[ROW][C]36[/C][C]683375[/C][C]533782.461942105[/C][C]149592.538057895[/C][/ROW]
[ROW][C]37[/C][C]1006000[/C][C]836393.182487073[/C][C]169606.817512927[/C][/ROW]
[ROW][C]38[/C][C]866000[/C][C]916670.082232239[/C][C]-50670.0822322386[/C][/ROW]
[ROW][C]39[/C][C]644000[/C][C]650395.315443437[/C][C]-6395.31544343662[/C][/ROW]
[ROW][C]40[/C][C]703000[/C][C]925836.78545995[/C][C]-222836.785459951[/C][/ROW]
[ROW][C]41[/C][C]699000[/C][C]719963.649440517[/C][C]-20963.6494405171[/C][/ROW]
[ROW][C]42[/C][C]713000[/C][C]830335.752865224[/C][C]-117335.752865224[/C][/ROW]
[ROW][C]43[/C][C]688000[/C][C]695510.556683143[/C][C]-7510.55668314267[/C][/ROW]
[ROW][C]44[/C][C]672000[/C][C]722318.200373803[/C][C]-50318.2003738035[/C][/ROW]
[ROW][C]45[/C][C]6e+05[/C][C]715510.875149156[/C][C]-115510.875149156[/C][/ROW]
[ROW][C]46[/C][C]847000[/C][C]756208.310089609[/C][C]90791.6899103915[/C][/ROW]
[ROW][C]47[/C][C]697000[/C][C]799106.889516008[/C][C]-102106.889516008[/C][/ROW]
[ROW][C]48[/C][C]687000[/C][C]616138.369267380[/C][C]70861.6307326205[/C][/ROW]
[ROW][C]49[/C][C]973000[/C][C]896846.420744103[/C][C]76153.579255897[/C][/ROW]
[ROW][C]50[/C][C]796000[/C][C]817797.778014666[/C][C]-21797.7780146664[/C][/ROW]
[ROW][C]51[/C][C]658000[/C][C]583253.840951776[/C][C]74746.1590482239[/C][/ROW]
[ROW][C]52[/C][C]709000[/C][C]768723.085689035[/C][C]-59723.0856890354[/C][/ROW]
[ROW][C]53[/C][C]798000[/C][C]733538.66792899[/C][C]64461.33207101[/C][/ROW]
[ROW][C]54[/C][C]820000[/C][C]823044.97564338[/C][C]-3044.97564338031[/C][/ROW]
[ROW][C]55[/C][C]776000[/C][C]791721.926199214[/C][C]-15721.9261992142[/C][/ROW]
[ROW][C]56[/C][C]699000[/C][C]792125.435374473[/C][C]-93125.4353744728[/C][/ROW]
[ROW][C]57[/C][C]828433[/C][C]733207.727490098[/C][C]95225.2725099018[/C][/ROW]
[ROW][C]58[/C][C]942131[/C][C]967979.09934044[/C][C]-25848.0993404402[/C][/ROW]
[ROW][C]59[/C][C]792916[/C][C]861778.795188115[/C][C]-68862.795188115[/C][/ROW]
[ROW][C]60[/C][C]864942[/C][C]786549.417135278[/C][C]78392.5828647225[/C][/ROW]
[ROW][C]61[/C][C]982689[/C][C]1073810.70527378[/C][C]-91121.705273784[/C][/ROW]
[ROW][C]62[/C][C]948143[/C][C]877197.749264459[/C][C]70945.250735541[/C][/ROW]
[ROW][C]63[/C][C]874863[/C][C]730792.14045647[/C][C]144070.859543529[/C][/ROW]
[ROW][C]64[/C][C]735794[/C][C]870027.637357362[/C][C]-134233.637357362[/C][/ROW]
[ROW][C]65[/C][C]854605[/C][C]874424.516599558[/C][C]-19819.5165995579[/C][/ROW]
[ROW][C]66[/C][C]1284216[/C][C]894557.15164276[/C][C]389658.84835724[/C][/ROW]
[ROW][C]67[/C][C]961585[/C][C]1008258.11815969[/C][C]-46673.118159687[/C][/ROW]
[ROW][C]68[/C][C]818379[/C][C]957046.350818993[/C][C]-138667.350818993[/C][/ROW]
[ROW][C]69[/C][C]1079498[/C][C]985574.381487375[/C][C]93923.6185126251[/C][/ROW]
[ROW][C]70[/C][C]1095091[/C][C]1155808.68664253[/C][C]-60717.686642533[/C][/ROW]
[ROW][C]71[/C][C]1008925[/C][C]1014612.07056818[/C][C]-5687.07056818123[/C][/ROW]
[ROW][C]72[/C][C]967118[/C][C]1045962.64545584[/C][C]-78844.6454558376[/C][/ROW]
[ROW][C]73[/C][C]1127715[/C][C]1181944.89242415[/C][C]-54229.892424149[/C][/ROW]
[/TABLE]
Source: https://freestatistics.org/blog/index.php?pk=41867&T=2

Globally Unique Identifier (entire table): ba.freestatistics.org/blog/index.php?pk=41867&T=2

As an alternative you can also use a QR Code:  

The GUIDs for individual cells are displayed in the table below:

Interpolation Forecasts of Exponential Smoothing
tObservedFittedResiduals
13805775718406.61057692387368.3894230766
14909449855318.56049858554130.4395014151
15599973565823.52249826434149.4775017363
16955874939221.83429165616652.1657083437
17799494788115.03114702911378.9688529712
18876097866794.8266597129302.17334028834
19823300832958.785445379-9658.78544537851
20900079866931.7176810633147.2823189399
21860754862257.467477854-1503.46747785353
229238821028513.23116823-104631.231168231
231121084942539.224061432178544.775938568
24741757844808.604152631-103051.604152631
259660661044312.97979541-78246.9797954111
269019781100442.50086780-198464.500867802
27648659702314.000881889-53655.0008818891
288527321030391.96910099-177659.969100993
29706036798589.326908614-92553.3269086143
30835792831854.080618523937.91938148078
31722489780827.78945107-58338.7894510698
32714262814447.67097411-100185.67097411
33739459733918.2968579745540.70314202609
34816834840394.978828436-23560.9788284361
35743082934166.10519183-191084.105191829
36683375533782.461942105149592.538057895
371006000836393.182487073169606.817512927
38866000916670.082232239-50670.0822322386
39644000650395.315443437-6395.31544343662
40703000925836.78545995-222836.785459951
41699000719963.649440517-20963.6494405171
42713000830335.752865224-117335.752865224
43688000695510.556683143-7510.55668314267
44672000722318.200373803-50318.2003738035
456e+05715510.875149156-115510.875149156
46847000756208.31008960990791.6899103915
47697000799106.889516008-102106.889516008
48687000616138.36926738070861.6307326205
49973000896846.42074410376153.579255897
50796000817797.778014666-21797.7780146664
51658000583253.84095177674746.1590482239
52709000768723.085689035-59723.0856890354
53798000733538.6679289964461.33207101
54820000823044.97564338-3044.97564338031
55776000791721.926199214-15721.9261992142
56699000792125.435374473-93125.4353744728
57828433733207.72749009895225.2725099018
58942131967979.09934044-25848.0993404402
59792916861778.795188115-68862.795188115
60864942786549.41713527878392.5828647225
619826891073810.70527378-91121.705273784
62948143877197.74926445970945.250735541
63874863730792.14045647144070.859543529
64735794870027.637357362-134233.637357362
65854605874424.516599558-19819.5165995579
661284216894557.15164276389658.84835724
679615851008258.11815969-46673.118159687
68818379957046.350818993-138667.350818993
691079498985574.38148737593923.6185126251
7010950911155808.68664253-60717.686642533
7110089251014612.07056818-5687.07056818123
729671181045962.64545584-78844.6454558376
7311277151181944.89242415-54229.892424149


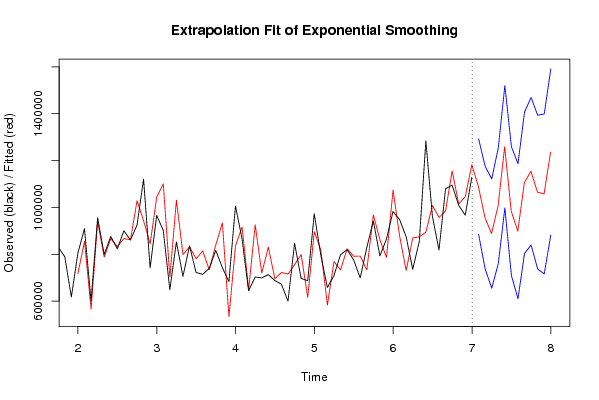
Extrapolation Forecasts of Exponential Smoothing
tForecast95% Lower Bound95% Upper Bound
741089039.80016631885163.5428395361292916.05749309
75956256.616263905737558.2588141161174954.97371369
76888455.013744392655319.9085955031121590.11889328
771006933.25931018759668.5933812351254197.92523912
781258762.27110654997615.2733170351519909.26889604
79983966.35431306709137.1979702991258795.51065582
80898372.707613736610023.9313158391186721.48391163
811105665.53106342803929.091576131407401.97055071
821154241.34589083839224.0112047521469258.68057691
831065045.99193226736833.5407394521393258.44312507
841057591.29930868716251.8430177121398930.75559965
851236548.00642188882134.6535801461590961.35926360

\begin{tabular}{lllllllll}
\hline
Extrapolation Forecasts of Exponential Smoothing \tabularnewline
t & Forecast & 95% Lower Bound & 95% Upper Bound \tabularnewline
74 & 1089039.80016631 & 885163.542839536 & 1292916.05749309 \tabularnewline
75 & 956256.616263905 & 737558.258814116 & 1174954.97371369 \tabularnewline
76 & 888455.013744392 & 655319.908595503 & 1121590.11889328 \tabularnewline
77 & 1006933.25931018 & 759668.593381235 & 1254197.92523912 \tabularnewline
78 & 1258762.27110654 & 997615.273317035 & 1519909.26889604 \tabularnewline
79 & 983966.35431306 & 709137.197970299 & 1258795.51065582 \tabularnewline
80 & 898372.707613736 & 610023.931315839 & 1186721.48391163 \tabularnewline
81 & 1105665.53106342 & 803929.09157613 & 1407401.97055071 \tabularnewline
82 & 1154241.34589083 & 839224.011204752 & 1469258.68057691 \tabularnewline
83 & 1065045.99193226 & 736833.540739452 & 1393258.44312507 \tabularnewline
84 & 1057591.29930868 & 716251.843017712 & 1398930.75559965 \tabularnewline
85 & 1236548.00642188 & 882134.653580146 & 1590961.35926360 \tabularnewline
\hline
\end{tabular}
%Source: https://freestatistics.org/blog/index.php?pk=41867&T=3

[TABLE]
[ROW][C]Extrapolation Forecasts of Exponential Smoothing[/C][/ROW]
[ROW][C]t[/C][C]Forecast[/C][C]95% Lower Bound[/C][C]95% Upper Bound[/C][/ROW]
[ROW][C]74[/C][C]1089039.80016631[/C][C]885163.542839536[/C][C]1292916.05749309[/C][/ROW]
[ROW][C]75[/C][C]956256.616263905[/C][C]737558.258814116[/C][C]1174954.97371369[/C][/ROW]
[ROW][C]76[/C][C]888455.013744392[/C][C]655319.908595503[/C][C]1121590.11889328[/C][/ROW]
[ROW][C]77[/C][C]1006933.25931018[/C][C]759668.593381235[/C][C]1254197.92523912[/C][/ROW]
[ROW][C]78[/C][C]1258762.27110654[/C][C]997615.273317035[/C][C]1519909.26889604[/C][/ROW]
[ROW][C]79[/C][C]983966.35431306[/C][C]709137.197970299[/C][C]1258795.51065582[/C][/ROW]
[ROW][C]80[/C][C]898372.707613736[/C][C]610023.931315839[/C][C]1186721.48391163[/C][/ROW]
[ROW][C]81[/C][C]1105665.53106342[/C][C]803929.09157613[/C][C]1407401.97055071[/C][/ROW]
[ROW][C]82[/C][C]1154241.34589083[/C][C]839224.011204752[/C][C]1469258.68057691[/C][/ROW]
[ROW][C]83[/C][C]1065045.99193226[/C][C]736833.540739452[/C][C]1393258.44312507[/C][/ROW]
[ROW][C]84[/C][C]1057591.29930868[/C][C]716251.843017712[/C][C]1398930.75559965[/C][/ROW]
[ROW][C]85[/C][C]1236548.00642188[/C][C]882134.653580146[/C][C]1590961.35926360[/C][/ROW]
[/TABLE]
Source: https://freestatistics.org/blog/index.php?pk=41867&T=3

Globally Unique Identifier (entire table): ba.freestatistics.org/blog/index.php?pk=41867&T=3

As an alternative you can also use a QR Code:  

The GUIDs for individual cells are displayed in the table below:

Extrapolation Forecasts of Exponential Smoothing
tForecast95% Lower Bound95% Upper Bound
741089039.80016631885163.5428395361292916.05749309
75956256.616263905737558.2588141161174954.97371369
76888455.013744392655319.9085955031121590.11889328
771006933.25931018759668.5933812351254197.92523912
781258762.27110654997615.2733170351519909.26889604
79983966.35431306709137.1979702991258795.51065582
80898372.707613736610023.9313158391186721.48391163
811105665.53106342803929.091576131407401.97055071
821154241.34589083839224.0112047521469258.68057691
831065045.99193226736833.5407394521393258.44312507
841057591.29930868716251.8430177121398930.75559965
851236548.00642188882134.6535801461590961.35926360


Parameters (Session):
par1 = 12 ; par2 = Triple ; par3 = additive ;
Parameters (R input):
par1 = 12 ; par2 = Triple ; par3 = additive ;
R code (references can be found in the software module):
par1 <- as.numeric(par1)
if (par2 == 'Single') K <- 1
if (par2 == 'Double') K <- 2
if (par2 == 'Triple') K <- par1
nx <- length(x)
nxmK <- nx - K
x <- ts(x, frequency = par1)
if (par2 == 'Single') fit <- HoltWinters(x, gamma=0, beta=0)
if (par2 == 'Double') fit <- HoltWinters(x, gamma=0)
if (par2 == 'Triple') fit <- HoltWinters(x, seasonal=par3)
fit
myresid <- x - fit$fitted[,'xhat']
bitmap(file='test1.png')
op <- par(mfrow=c(2,1))
plot(fit,ylab='Observed (black) / Fitted (red)',main='Interpolation Fit of Exponential Smoothing')
plot(myresid,ylab='Residuals',main='Interpolation Prediction Errors')
par(op)
dev.off()
bitmap(file='test2.png')
p <- predict(fit, par1, prediction.interval=TRUE)
np <- length(p[,1])
plot(fit,p,ylab='Observed (black) / Fitted (red)',main='Extrapolation Fit of Exponential Smoothing')
dev.off()
bitmap(file='test3.png')
op <- par(mfrow = c(2,2))
acf(as.numeric(myresid),lag.max = nx/2,main='Residual ACF')
spectrum(myresid,main='Residals Periodogram')
cpgram(myresid,main='Residal Cumulative Periodogram')
qqnorm(myresid,main='Residual Normal QQ Plot')
qqline(myresid)
par(op)
dev.off()
load(file='createtable')
a<-table.start()
a<-table.row.start(a)
a<-table.element(a,'Estimated Parameters of Exponential Smoothing',2,TRUE)
a<-table.row.end(a)
a<-table.row.start(a)
a<-table.element(a,'Parameter',header=TRUE)
a<-table.element(a,'Value',header=TRUE)
a<-table.row.end(a)
a<-table.row.start(a)
a<-table.element(a,'alpha',header=TRUE)
a<-table.element(a,fit$alpha)
a<-table.row.end(a)
a<-table.row.start(a)
a<-table.element(a,'beta',header=TRUE)
a<-table.element(a,fit$beta)
a<-table.row.end(a)
a<-table.row.start(a)
a<-table.element(a,'gamma',header=TRUE)
a<-table.element(a,fit$gamma)
a<-table.row.end(a)
a<-table.end(a)
table.save(a,file='mytable.tab')
a<-table.start()
a<-table.row.start(a)
a<-table.element(a,'Interpolation Forecasts of Exponential Smoothing',4,TRUE)
a<-table.row.end(a)
a<-table.row.start(a)
a<-table.element(a,'t',header=TRUE)
a<-table.element(a,'Observed',header=TRUE)
a<-table.element(a,'Fitted',header=TRUE)
a<-table.element(a,'Residuals',header=TRUE)
a<-table.row.end(a)
for (i in 1:nxmK) {
a<-table.row.start(a)
a<-table.element(a,i+K,header=TRUE)
a<-table.element(a,x[i+K])
a<-table.element(a,fit$fitted[i,'xhat'])
a<-table.element(a,myresid[i])
a<-table.row.end(a)
}
a<-table.end(a)
table.save(a,file='mytable1.tab')
a<-table.start()
a<-table.row.start(a)
a<-table.element(a,'Extrapolation Forecasts of Exponential Smoothing',4,TRUE)
a<-table.row.end(a)
a<-table.row.start(a)
a<-table.element(a,'t',header=TRUE)
a<-table.element(a,'Forecast',header=TRUE)
a<-table.element(a,'95% Lower Bound',header=TRUE)
a<-table.element(a,'95% Upper Bound',header=TRUE)
a<-table.row.end(a)
for (i in 1:np) {
a<-table.row.start(a)
a<-table.element(a,nx+i,header=TRUE)
a<-table.element(a,p[i,'fit'])
a<-table.element(a,p[i,'lwr'])
a<-table.element(a,p[i,'upr'])
a<-table.row.end(a)
}
a<-table.end(a)
table.save(a,file='mytable2.tab')