Free Statistics

of Irreproducible Research!

Author's title

Author*Unverified author*
R Software Modulerwasp_autocorrelation.wasp
Title produced by software(Partial) Autocorrelation Function
Date of computationFri, 05 Jun 2009 06:33:28 -0600
Cite this page as followsStatistical Computations at FreeStatistics.org, Office for Research Development and Education, URL https://freestatistics.org/blog/index.php?v=date/2009/Jun/05/t1244205259f1xfmnquj1s1os1.htm/, Retrieved Thu, 09 May 2024 21:42:26 +0000
Statistical Computations at FreeStatistics.org, Office for Research Development and Education, URL https://freestatistics.org/blog/index.php?pk=41819, Retrieved Thu, 09 May 2024 21:42:26 +0000
QR Codes:

Original text written by user:Wesley De Bondt
IsPrivate?No (this computation is public)
User-defined keywordsWesley De Bondt
Estimated Impact125
Family? (F = Feedback message, R = changed R code, M = changed R Module, P = changed Parameters, D = changed Data)
-       [(Partial) Autocorrelation Function] [Koers € t.o.v. £] [2009-06-05 12:33:28] [52abb83916effba29fe89a1e0cad1e5e] [Current]
Feedback Forum

Post a new message
Dataseries X:
0.63709
0.64218
0.65711
0.66977
0.68255
0.68902
0.71322
0.70224
0.70045
0.69919
0.69693
0.69763
0.69278
0.70196
0.69215
0.6769
0.67124
0.66533
0.67157
0.66428
0.66576
0.66942
0.68130
0.69144
0.69862
0.695
0.69867
0.68968
0.69233
0.68293
0.68399
0.66895
0.68756
0.68527
0.6776
0.68137
0.67933
0.67922
0.68598
0.68297
0.68935
0.69463
0.6833
0.68666
0.68782
0.67669
0.67511
0.67254
0.67397
0.67286
0.66341
0.668
0.68021
0.67934
0.68136
0.67562
0.6744
0.67766
0.68887
0.69614
0.70896
0.72064
0.74725
0.75094
0.77494
0.79487
0.79209
0.79152
0.79308
0.79279
0.79924
0.78668


Summary of computational transaction
Raw Inputview raw input (R code)
Raw Outputview raw output of R engine
Computing time1 seconds
R Server'Gwilym Jenkins' @ 72.249.127.135

\begin{tabular}{lllllllll}
\hline
Summary of computational transaction \tabularnewline
Raw Input & view raw input (R code)  \tabularnewline
Raw Output & view raw output of R engine  \tabularnewline
Computing time & 1 seconds \tabularnewline
R Server & 'Gwilym Jenkins' @ 72.249.127.135 \tabularnewline
\hline
\end{tabular}
%Source: https://freestatistics.org/blog/index.php?pk=41819&T=0

[TABLE]
[ROW][C]Summary of computational transaction[/C][/ROW]
[ROW][C]Raw Input[/C][C]view raw input (R code) [/C][/ROW]
[ROW][C]Raw Output[/C][C]view raw output of R engine [/C][/ROW]
[ROW][C]Computing time[/C][C]1 seconds[/C][/ROW]
[ROW][C]R Server[/C][C]'Gwilym Jenkins' @ 72.249.127.135[/C][/ROW]
[/TABLE]
Source: https://freestatistics.org/blog/index.php?pk=41819&T=0

Globally Unique Identifier (entire table): ba.freestatistics.org/blog/index.php?pk=41819&T=0

As an alternative you can also use a QR Code:  

The GUIDs for individual cells are displayed in the table below:

Summary of computational transaction
Raw Inputview raw input (R code)
Raw Outputview raw output of R engine
Computing time1 seconds
R Server'Gwilym Jenkins' @ 72.249.127.135


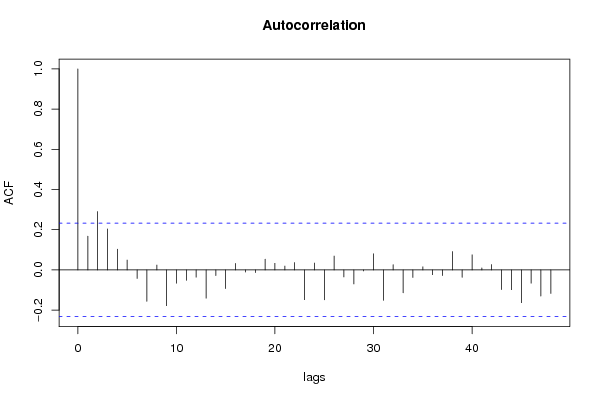
Autocorrelation Function
Time lag kACF(k)T-STATP-value
10.1675161.41150.08123
20.2905282.4480.008419
30.20411.71980.044915
40.1033590.87090.193367
50.0488420.41150.340955
6-0.042228-0.35580.361516
7-0.156483-1.31860.095778
80.0240320.20250.420053
9-0.177859-1.49870.069196
10-0.065833-0.55470.290415
11-0.05168-0.43550.332275
12-0.036222-0.30520.38055
13-0.140603-1.18470.120035
14-0.028136-0.23710.406639
15-0.09294-0.78310.218078
160.0324340.27330.392711
17-0.010849-0.09140.463711
18-0.012968-0.10930.456647
190.0535340.45110.326652
200.0325670.27440.39228
210.0189940.160.436648
220.0363350.30620.380187
23-0.148226-1.2490.107888
240.0342890.28890.386739
25-0.148586-1.2520.107338
260.0688170.57990.281922
27-0.035011-0.2950.384426
28-0.069688-0.58720.279465
29-0.004926-0.04150.483504
300.0801350.67520.250861
31-0.151324-1.27510.103219
320.0260540.21950.413431
33-0.113759-0.95850.170519
34-0.037299-0.31430.377113
350.0153720.12950.448654
36-0.024069-0.20280.419933
37-0.028436-0.23960.405662
380.0910210.7670.222824
39-0.036615-0.30850.379294
400.0748790.63090.265052
410.0099390.08370.466746
420.0263210.22180.412559
43-0.097783-0.82390.206369
44-0.098426-0.82940.204842
45-0.163351-1.37640.086509
46-0.065964-0.55580.290041
47-0.130239-1.09740.138085
48-0.116916-0.98520.163947

\begin{tabular}{lllllllll}
\hline
Autocorrelation Function \tabularnewline
Time lag k & ACF(k) & T-STAT & P-value \tabularnewline
1 & 0.167516 & 1.4115 & 0.08123 \tabularnewline
2 & 0.290528 & 2.448 & 0.008419 \tabularnewline
3 & 0.2041 & 1.7198 & 0.044915 \tabularnewline
4 & 0.103359 & 0.8709 & 0.193367 \tabularnewline
5 & 0.048842 & 0.4115 & 0.340955 \tabularnewline
6 & -0.042228 & -0.3558 & 0.361516 \tabularnewline
7 & -0.156483 & -1.3186 & 0.095778 \tabularnewline
8 & 0.024032 & 0.2025 & 0.420053 \tabularnewline
9 & -0.177859 & -1.4987 & 0.069196 \tabularnewline
10 & -0.065833 & -0.5547 & 0.290415 \tabularnewline
11 & -0.05168 & -0.4355 & 0.332275 \tabularnewline
12 & -0.036222 & -0.3052 & 0.38055 \tabularnewline
13 & -0.140603 & -1.1847 & 0.120035 \tabularnewline
14 & -0.028136 & -0.2371 & 0.406639 \tabularnewline
15 & -0.09294 & -0.7831 & 0.218078 \tabularnewline
16 & 0.032434 & 0.2733 & 0.392711 \tabularnewline
17 & -0.010849 & -0.0914 & 0.463711 \tabularnewline
18 & -0.012968 & -0.1093 & 0.456647 \tabularnewline
19 & 0.053534 & 0.4511 & 0.326652 \tabularnewline
20 & 0.032567 & 0.2744 & 0.39228 \tabularnewline
21 & 0.018994 & 0.16 & 0.436648 \tabularnewline
22 & 0.036335 & 0.3062 & 0.380187 \tabularnewline
23 & -0.148226 & -1.249 & 0.107888 \tabularnewline
24 & 0.034289 & 0.2889 & 0.386739 \tabularnewline
25 & -0.148586 & -1.252 & 0.107338 \tabularnewline
26 & 0.068817 & 0.5799 & 0.281922 \tabularnewline
27 & -0.035011 & -0.295 & 0.384426 \tabularnewline
28 & -0.069688 & -0.5872 & 0.279465 \tabularnewline
29 & -0.004926 & -0.0415 & 0.483504 \tabularnewline
30 & 0.080135 & 0.6752 & 0.250861 \tabularnewline
31 & -0.151324 & -1.2751 & 0.103219 \tabularnewline
32 & 0.026054 & 0.2195 & 0.413431 \tabularnewline
33 & -0.113759 & -0.9585 & 0.170519 \tabularnewline
34 & -0.037299 & -0.3143 & 0.377113 \tabularnewline
35 & 0.015372 & 0.1295 & 0.448654 \tabularnewline
36 & -0.024069 & -0.2028 & 0.419933 \tabularnewline
37 & -0.028436 & -0.2396 & 0.405662 \tabularnewline
38 & 0.091021 & 0.767 & 0.222824 \tabularnewline
39 & -0.036615 & -0.3085 & 0.379294 \tabularnewline
40 & 0.074879 & 0.6309 & 0.265052 \tabularnewline
41 & 0.009939 & 0.0837 & 0.466746 \tabularnewline
42 & 0.026321 & 0.2218 & 0.412559 \tabularnewline
43 & -0.097783 & -0.8239 & 0.206369 \tabularnewline
44 & -0.098426 & -0.8294 & 0.204842 \tabularnewline
45 & -0.163351 & -1.3764 & 0.086509 \tabularnewline
46 & -0.065964 & -0.5558 & 0.290041 \tabularnewline
47 & -0.130239 & -1.0974 & 0.138085 \tabularnewline
48 & -0.116916 & -0.9852 & 0.163947 \tabularnewline
\hline
\end{tabular}
%Source: https://freestatistics.org/blog/index.php?pk=41819&T=1

[TABLE]
[ROW][C]Autocorrelation Function[/C][/ROW]
[ROW][C]Time lag k[/C][C]ACF(k)[/C][C]T-STAT[/C][C]P-value[/C][/ROW]
[ROW][C]1[/C][C]0.167516[/C][C]1.4115[/C][C]0.08123[/C][/ROW]
[ROW][C]2[/C][C]0.290528[/C][C]2.448[/C][C]0.008419[/C][/ROW]
[ROW][C]3[/C][C]0.2041[/C][C]1.7198[/C][C]0.044915[/C][/ROW]
[ROW][C]4[/C][C]0.103359[/C][C]0.8709[/C][C]0.193367[/C][/ROW]
[ROW][C]5[/C][C]0.048842[/C][C]0.4115[/C][C]0.340955[/C][/ROW]
[ROW][C]6[/C][C]-0.042228[/C][C]-0.3558[/C][C]0.361516[/C][/ROW]
[ROW][C]7[/C][C]-0.156483[/C][C]-1.3186[/C][C]0.095778[/C][/ROW]
[ROW][C]8[/C][C]0.024032[/C][C]0.2025[/C][C]0.420053[/C][/ROW]
[ROW][C]9[/C][C]-0.177859[/C][C]-1.4987[/C][C]0.069196[/C][/ROW]
[ROW][C]10[/C][C]-0.065833[/C][C]-0.5547[/C][C]0.290415[/C][/ROW]
[ROW][C]11[/C][C]-0.05168[/C][C]-0.4355[/C][C]0.332275[/C][/ROW]
[ROW][C]12[/C][C]-0.036222[/C][C]-0.3052[/C][C]0.38055[/C][/ROW]
[ROW][C]13[/C][C]-0.140603[/C][C]-1.1847[/C][C]0.120035[/C][/ROW]
[ROW][C]14[/C][C]-0.028136[/C][C]-0.2371[/C][C]0.406639[/C][/ROW]
[ROW][C]15[/C][C]-0.09294[/C][C]-0.7831[/C][C]0.218078[/C][/ROW]
[ROW][C]16[/C][C]0.032434[/C][C]0.2733[/C][C]0.392711[/C][/ROW]
[ROW][C]17[/C][C]-0.010849[/C][C]-0.0914[/C][C]0.463711[/C][/ROW]
[ROW][C]18[/C][C]-0.012968[/C][C]-0.1093[/C][C]0.456647[/C][/ROW]
[ROW][C]19[/C][C]0.053534[/C][C]0.4511[/C][C]0.326652[/C][/ROW]
[ROW][C]20[/C][C]0.032567[/C][C]0.2744[/C][C]0.39228[/C][/ROW]
[ROW][C]21[/C][C]0.018994[/C][C]0.16[/C][C]0.436648[/C][/ROW]
[ROW][C]22[/C][C]0.036335[/C][C]0.3062[/C][C]0.380187[/C][/ROW]
[ROW][C]23[/C][C]-0.148226[/C][C]-1.249[/C][C]0.107888[/C][/ROW]
[ROW][C]24[/C][C]0.034289[/C][C]0.2889[/C][C]0.386739[/C][/ROW]
[ROW][C]25[/C][C]-0.148586[/C][C]-1.252[/C][C]0.107338[/C][/ROW]
[ROW][C]26[/C][C]0.068817[/C][C]0.5799[/C][C]0.281922[/C][/ROW]
[ROW][C]27[/C][C]-0.035011[/C][C]-0.295[/C][C]0.384426[/C][/ROW]
[ROW][C]28[/C][C]-0.069688[/C][C]-0.5872[/C][C]0.279465[/C][/ROW]
[ROW][C]29[/C][C]-0.004926[/C][C]-0.0415[/C][C]0.483504[/C][/ROW]
[ROW][C]30[/C][C]0.080135[/C][C]0.6752[/C][C]0.250861[/C][/ROW]
[ROW][C]31[/C][C]-0.151324[/C][C]-1.2751[/C][C]0.103219[/C][/ROW]
[ROW][C]32[/C][C]0.026054[/C][C]0.2195[/C][C]0.413431[/C][/ROW]
[ROW][C]33[/C][C]-0.113759[/C][C]-0.9585[/C][C]0.170519[/C][/ROW]
[ROW][C]34[/C][C]-0.037299[/C][C]-0.3143[/C][C]0.377113[/C][/ROW]
[ROW][C]35[/C][C]0.015372[/C][C]0.1295[/C][C]0.448654[/C][/ROW]
[ROW][C]36[/C][C]-0.024069[/C][C]-0.2028[/C][C]0.419933[/C][/ROW]
[ROW][C]37[/C][C]-0.028436[/C][C]-0.2396[/C][C]0.405662[/C][/ROW]
[ROW][C]38[/C][C]0.091021[/C][C]0.767[/C][C]0.222824[/C][/ROW]
[ROW][C]39[/C][C]-0.036615[/C][C]-0.3085[/C][C]0.379294[/C][/ROW]
[ROW][C]40[/C][C]0.074879[/C][C]0.6309[/C][C]0.265052[/C][/ROW]
[ROW][C]41[/C][C]0.009939[/C][C]0.0837[/C][C]0.466746[/C][/ROW]
[ROW][C]42[/C][C]0.026321[/C][C]0.2218[/C][C]0.412559[/C][/ROW]
[ROW][C]43[/C][C]-0.097783[/C][C]-0.8239[/C][C]0.206369[/C][/ROW]
[ROW][C]44[/C][C]-0.098426[/C][C]-0.8294[/C][C]0.204842[/C][/ROW]
[ROW][C]45[/C][C]-0.163351[/C][C]-1.3764[/C][C]0.086509[/C][/ROW]
[ROW][C]46[/C][C]-0.065964[/C][C]-0.5558[/C][C]0.290041[/C][/ROW]
[ROW][C]47[/C][C]-0.130239[/C][C]-1.0974[/C][C]0.138085[/C][/ROW]
[ROW][C]48[/C][C]-0.116916[/C][C]-0.9852[/C][C]0.163947[/C][/ROW]
[/TABLE]
Source: https://freestatistics.org/blog/index.php?pk=41819&T=1

Globally Unique Identifier (entire table): ba.freestatistics.org/blog/index.php?pk=41819&T=1

As an alternative you can also use a QR Code:  

The GUIDs for individual cells are displayed in the table below:

Autocorrelation Function
Time lag kACF(k)T-STATP-value
10.1675161.41150.08123
20.2905282.4480.008419
30.20411.71980.044915
40.1033590.87090.193367
50.0488420.41150.340955
6-0.042228-0.35580.361516
7-0.156483-1.31860.095778
80.0240320.20250.420053
9-0.177859-1.49870.069196
10-0.065833-0.55470.290415
11-0.05168-0.43550.332275
12-0.036222-0.30520.38055
13-0.140603-1.18470.120035
14-0.028136-0.23710.406639
15-0.09294-0.78310.218078
160.0324340.27330.392711
17-0.010849-0.09140.463711
18-0.012968-0.10930.456647
190.0535340.45110.326652
200.0325670.27440.39228
210.0189940.160.436648
220.0363350.30620.380187
23-0.148226-1.2490.107888
240.0342890.28890.386739
25-0.148586-1.2520.107338
260.0688170.57990.281922
27-0.035011-0.2950.384426
28-0.069688-0.58720.279465
29-0.004926-0.04150.483504
300.0801350.67520.250861
31-0.151324-1.27510.103219
320.0260540.21950.413431
33-0.113759-0.95850.170519
34-0.037299-0.31430.377113
350.0153720.12950.448654
36-0.024069-0.20280.419933
37-0.028436-0.23960.405662
380.0910210.7670.222824
39-0.036615-0.30850.379294
400.0748790.63090.265052
410.0099390.08370.466746
420.0263210.22180.412559
43-0.097783-0.82390.206369
44-0.098426-0.82940.204842
45-0.163351-1.37640.086509
46-0.065964-0.55580.290041
47-0.130239-1.09740.138085
48-0.116916-0.98520.163947


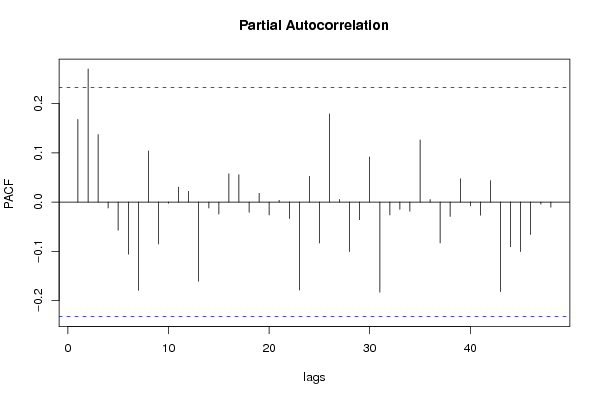
Partial Autocorrelation Function
Time lag kPACF(k)T-STATP-value
10.1675161.41150.08123
20.2700442.27540.01295
30.1368811.15340.126312
4-0.011962-0.10080.46
5-0.057151-0.48160.3158
6-0.105861-0.8920.187702
7-0.179044-1.50860.067913
80.1036530.87340.192695
9-0.084938-0.71570.238263
10-0.002347-0.01980.492139
110.0301430.2540.400119
120.0218270.18390.4273
13-0.160709-1.35420.089991
14-0.012036-0.10140.459751
15-0.024516-0.20660.418467
160.0573010.48280.315352
170.0555650.46820.320539
18-0.020959-0.17660.430161
190.0177970.150.440612
20-0.026228-0.2210.412864
210.0034020.02870.488605
22-0.033684-0.28380.388685
23-0.178697-1.50570.068287
240.0522390.44020.330574
25-0.083216-0.70120.242739
260.178831.50680.068143
270.0052110.04390.482551
28-0.100411-0.84610.200176
29-0.035898-0.30250.381585
300.0914790.77080.221687
31-0.182926-1.54140.063837
32-0.026118-0.22010.413222
33-0.014756-0.12430.4507
34-0.018694-0.15750.437642
350.1259131.0610.146152
360.0050550.04260.483074
37-0.082924-0.69870.243502
38-0.029324-0.24710.402778
390.0472160.39790.345966
40-0.007716-0.0650.474173
41-0.026643-0.22450.411507
420.0436550.36780.357041
43-0.181583-1.530.065225
44-0.090879-0.76580.22318
45-0.10049-0.84670.199991
46-0.065993-0.55610.289957
47-0.004303-0.03630.485589
48-0.010397-0.08760.465218

\begin{tabular}{lllllllll}
\hline
Partial Autocorrelation Function \tabularnewline
Time lag k & PACF(k) & T-STAT & P-value \tabularnewline
1 & 0.167516 & 1.4115 & 0.08123 \tabularnewline
2 & 0.270044 & 2.2754 & 0.01295 \tabularnewline
3 & 0.136881 & 1.1534 & 0.126312 \tabularnewline
4 & -0.011962 & -0.1008 & 0.46 \tabularnewline
5 & -0.057151 & -0.4816 & 0.3158 \tabularnewline
6 & -0.105861 & -0.892 & 0.187702 \tabularnewline
7 & -0.179044 & -1.5086 & 0.067913 \tabularnewline
8 & 0.103653 & 0.8734 & 0.192695 \tabularnewline
9 & -0.084938 & -0.7157 & 0.238263 \tabularnewline
10 & -0.002347 & -0.0198 & 0.492139 \tabularnewline
11 & 0.030143 & 0.254 & 0.400119 \tabularnewline
12 & 0.021827 & 0.1839 & 0.4273 \tabularnewline
13 & -0.160709 & -1.3542 & 0.089991 \tabularnewline
14 & -0.012036 & -0.1014 & 0.459751 \tabularnewline
15 & -0.024516 & -0.2066 & 0.418467 \tabularnewline
16 & 0.057301 & 0.4828 & 0.315352 \tabularnewline
17 & 0.055565 & 0.4682 & 0.320539 \tabularnewline
18 & -0.020959 & -0.1766 & 0.430161 \tabularnewline
19 & 0.017797 & 0.15 & 0.440612 \tabularnewline
20 & -0.026228 & -0.221 & 0.412864 \tabularnewline
21 & 0.003402 & 0.0287 & 0.488605 \tabularnewline
22 & -0.033684 & -0.2838 & 0.388685 \tabularnewline
23 & -0.178697 & -1.5057 & 0.068287 \tabularnewline
24 & 0.052239 & 0.4402 & 0.330574 \tabularnewline
25 & -0.083216 & -0.7012 & 0.242739 \tabularnewline
26 & 0.17883 & 1.5068 & 0.068143 \tabularnewline
27 & 0.005211 & 0.0439 & 0.482551 \tabularnewline
28 & -0.100411 & -0.8461 & 0.200176 \tabularnewline
29 & -0.035898 & -0.3025 & 0.381585 \tabularnewline
30 & 0.091479 & 0.7708 & 0.221687 \tabularnewline
31 & -0.182926 & -1.5414 & 0.063837 \tabularnewline
32 & -0.026118 & -0.2201 & 0.413222 \tabularnewline
33 & -0.014756 & -0.1243 & 0.4507 \tabularnewline
34 & -0.018694 & -0.1575 & 0.437642 \tabularnewline
35 & 0.125913 & 1.061 & 0.146152 \tabularnewline
36 & 0.005055 & 0.0426 & 0.483074 \tabularnewline
37 & -0.082924 & -0.6987 & 0.243502 \tabularnewline
38 & -0.029324 & -0.2471 & 0.402778 \tabularnewline
39 & 0.047216 & 0.3979 & 0.345966 \tabularnewline
40 & -0.007716 & -0.065 & 0.474173 \tabularnewline
41 & -0.026643 & -0.2245 & 0.411507 \tabularnewline
42 & 0.043655 & 0.3678 & 0.357041 \tabularnewline
43 & -0.181583 & -1.53 & 0.065225 \tabularnewline
44 & -0.090879 & -0.7658 & 0.22318 \tabularnewline
45 & -0.10049 & -0.8467 & 0.199991 \tabularnewline
46 & -0.065993 & -0.5561 & 0.289957 \tabularnewline
47 & -0.004303 & -0.0363 & 0.485589 \tabularnewline
48 & -0.010397 & -0.0876 & 0.465218 \tabularnewline
\hline
\end{tabular}
%Source: https://freestatistics.org/blog/index.php?pk=41819&T=2

[TABLE]
[ROW][C]Partial Autocorrelation Function[/C][/ROW]
[ROW][C]Time lag k[/C][C]PACF(k)[/C][C]T-STAT[/C][C]P-value[/C][/ROW]
[ROW][C]1[/C][C]0.167516[/C][C]1.4115[/C][C]0.08123[/C][/ROW]
[ROW][C]2[/C][C]0.270044[/C][C]2.2754[/C][C]0.01295[/C][/ROW]
[ROW][C]3[/C][C]0.136881[/C][C]1.1534[/C][C]0.126312[/C][/ROW]
[ROW][C]4[/C][C]-0.011962[/C][C]-0.1008[/C][C]0.46[/C][/ROW]
[ROW][C]5[/C][C]-0.057151[/C][C]-0.4816[/C][C]0.3158[/C][/ROW]
[ROW][C]6[/C][C]-0.105861[/C][C]-0.892[/C][C]0.187702[/C][/ROW]
[ROW][C]7[/C][C]-0.179044[/C][C]-1.5086[/C][C]0.067913[/C][/ROW]
[ROW][C]8[/C][C]0.103653[/C][C]0.8734[/C][C]0.192695[/C][/ROW]
[ROW][C]9[/C][C]-0.084938[/C][C]-0.7157[/C][C]0.238263[/C][/ROW]
[ROW][C]10[/C][C]-0.002347[/C][C]-0.0198[/C][C]0.492139[/C][/ROW]
[ROW][C]11[/C][C]0.030143[/C][C]0.254[/C][C]0.400119[/C][/ROW]
[ROW][C]12[/C][C]0.021827[/C][C]0.1839[/C][C]0.4273[/C][/ROW]
[ROW][C]13[/C][C]-0.160709[/C][C]-1.3542[/C][C]0.089991[/C][/ROW]
[ROW][C]14[/C][C]-0.012036[/C][C]-0.1014[/C][C]0.459751[/C][/ROW]
[ROW][C]15[/C][C]-0.024516[/C][C]-0.2066[/C][C]0.418467[/C][/ROW]
[ROW][C]16[/C][C]0.057301[/C][C]0.4828[/C][C]0.315352[/C][/ROW]
[ROW][C]17[/C][C]0.055565[/C][C]0.4682[/C][C]0.320539[/C][/ROW]
[ROW][C]18[/C][C]-0.020959[/C][C]-0.1766[/C][C]0.430161[/C][/ROW]
[ROW][C]19[/C][C]0.017797[/C][C]0.15[/C][C]0.440612[/C][/ROW]
[ROW][C]20[/C][C]-0.026228[/C][C]-0.221[/C][C]0.412864[/C][/ROW]
[ROW][C]21[/C][C]0.003402[/C][C]0.0287[/C][C]0.488605[/C][/ROW]
[ROW][C]22[/C][C]-0.033684[/C][C]-0.2838[/C][C]0.388685[/C][/ROW]
[ROW][C]23[/C][C]-0.178697[/C][C]-1.5057[/C][C]0.068287[/C][/ROW]
[ROW][C]24[/C][C]0.052239[/C][C]0.4402[/C][C]0.330574[/C][/ROW]
[ROW][C]25[/C][C]-0.083216[/C][C]-0.7012[/C][C]0.242739[/C][/ROW]
[ROW][C]26[/C][C]0.17883[/C][C]1.5068[/C][C]0.068143[/C][/ROW]
[ROW][C]27[/C][C]0.005211[/C][C]0.0439[/C][C]0.482551[/C][/ROW]
[ROW][C]28[/C][C]-0.100411[/C][C]-0.8461[/C][C]0.200176[/C][/ROW]
[ROW][C]29[/C][C]-0.035898[/C][C]-0.3025[/C][C]0.381585[/C][/ROW]
[ROW][C]30[/C][C]0.091479[/C][C]0.7708[/C][C]0.221687[/C][/ROW]
[ROW][C]31[/C][C]-0.182926[/C][C]-1.5414[/C][C]0.063837[/C][/ROW]
[ROW][C]32[/C][C]-0.026118[/C][C]-0.2201[/C][C]0.413222[/C][/ROW]
[ROW][C]33[/C][C]-0.014756[/C][C]-0.1243[/C][C]0.4507[/C][/ROW]
[ROW][C]34[/C][C]-0.018694[/C][C]-0.1575[/C][C]0.437642[/C][/ROW]
[ROW][C]35[/C][C]0.125913[/C][C]1.061[/C][C]0.146152[/C][/ROW]
[ROW][C]36[/C][C]0.005055[/C][C]0.0426[/C][C]0.483074[/C][/ROW]
[ROW][C]37[/C][C]-0.082924[/C][C]-0.6987[/C][C]0.243502[/C][/ROW]
[ROW][C]38[/C][C]-0.029324[/C][C]-0.2471[/C][C]0.402778[/C][/ROW]
[ROW][C]39[/C][C]0.047216[/C][C]0.3979[/C][C]0.345966[/C][/ROW]
[ROW][C]40[/C][C]-0.007716[/C][C]-0.065[/C][C]0.474173[/C][/ROW]
[ROW][C]41[/C][C]-0.026643[/C][C]-0.2245[/C][C]0.411507[/C][/ROW]
[ROW][C]42[/C][C]0.043655[/C][C]0.3678[/C][C]0.357041[/C][/ROW]
[ROW][C]43[/C][C]-0.181583[/C][C]-1.53[/C][C]0.065225[/C][/ROW]
[ROW][C]44[/C][C]-0.090879[/C][C]-0.7658[/C][C]0.22318[/C][/ROW]
[ROW][C]45[/C][C]-0.10049[/C][C]-0.8467[/C][C]0.199991[/C][/ROW]
[ROW][C]46[/C][C]-0.065993[/C][C]-0.5561[/C][C]0.289957[/C][/ROW]
[ROW][C]47[/C][C]-0.004303[/C][C]-0.0363[/C][C]0.485589[/C][/ROW]
[ROW][C]48[/C][C]-0.010397[/C][C]-0.0876[/C][C]0.465218[/C][/ROW]
[/TABLE]
Source: https://freestatistics.org/blog/index.php?pk=41819&T=2

Globally Unique Identifier (entire table): ba.freestatistics.org/blog/index.php?pk=41819&T=2

As an alternative you can also use a QR Code:  

The GUIDs for individual cells are displayed in the table below:

Partial Autocorrelation Function
Time lag kPACF(k)T-STATP-value
10.1675161.41150.08123
20.2700442.27540.01295
30.1368811.15340.126312
4-0.011962-0.10080.46
5-0.057151-0.48160.3158
6-0.105861-0.8920.187702
7-0.179044-1.50860.067913
80.1036530.87340.192695
9-0.084938-0.71570.238263
10-0.002347-0.01980.492139
110.0301430.2540.400119
120.0218270.18390.4273
13-0.160709-1.35420.089991
14-0.012036-0.10140.459751
15-0.024516-0.20660.418467
160.0573010.48280.315352
170.0555650.46820.320539
18-0.020959-0.17660.430161
190.0177970.150.440612
20-0.026228-0.2210.412864
210.0034020.02870.488605
22-0.033684-0.28380.388685
23-0.178697-1.50570.068287
240.0522390.44020.330574
25-0.083216-0.70120.242739
260.178831.50680.068143
270.0052110.04390.482551
28-0.100411-0.84610.200176
29-0.035898-0.30250.381585
300.0914790.77080.221687
31-0.182926-1.54140.063837
32-0.026118-0.22010.413222
33-0.014756-0.12430.4507
34-0.018694-0.15750.437642
350.1259131.0610.146152
360.0050550.04260.483074
37-0.082924-0.69870.243502
38-0.029324-0.24710.402778
390.0472160.39790.345966
40-0.007716-0.0650.474173
41-0.026643-0.22450.411507
420.0436550.36780.357041
43-0.181583-1.530.065225
44-0.090879-0.76580.22318
45-0.10049-0.84670.199991
46-0.065993-0.55610.289957
47-0.004303-0.03630.485589
48-0.010397-0.08760.465218


Parameters (Session):
par1 = 48 ; par2 = 1 ; par3 = 1 ; par4 = 0 ; par5 = 12 ;
Parameters (R input):
par1 = 48 ; par2 = 1 ; par3 = 1 ; par4 = 0 ; par5 = 12 ;
R code (references can be found in the software module):
if (par1 == 'Default') {
par1 = 10*log10(length(x))
} else {
par1 <- as.numeric(par1)
}
par2 <- as.numeric(par2)
par3 <- as.numeric(par3)
par4 <- as.numeric(par4)
par5 <- as.numeric(par5)
if (par2 == 0) {
x <- log(x)
} else {
x <- (x ^ par2 - 1) / par2
}
if (par3 > 0) x <- diff(x,lag=1,difference=par3)
if (par4 > 0) x <- diff(x,lag=par5,difference=par4)
bitmap(file='pic1.png')
racf <- acf(x,par1,main='Autocorrelation',xlab='lags',ylab='ACF')
dev.off()
bitmap(file='pic2.png')
rpacf <- pacf(x,par1,main='Partial Autocorrelation',xlab='lags',ylab='PACF')
dev.off()
(myacf <- c(racf$acf))
(mypacf <- c(rpacf$acf))
lengthx <- length(x)
sqrtn <- sqrt(lengthx)
load(file='createtable')
a<-table.start()
a<-table.row.start(a)
a<-table.element(a,'Autocorrelation Function',4,TRUE)
a<-table.row.end(a)
a<-table.row.start(a)
a<-table.element(a,'Time lag k',header=TRUE)
a<-table.element(a,hyperlink('basics.htm','ACF(k)','click here for more information about the Autocorrelation Function'),header=TRUE)
a<-table.element(a,'T-STAT',header=TRUE)
a<-table.element(a,'P-value',header=TRUE)
a<-table.row.end(a)
for (i in 2:(par1+1)) {
a<-table.row.start(a)
a<-table.element(a,i-1,header=TRUE)
a<-table.element(a,round(myacf[i],6))
mytstat <- myacf[i]*sqrtn
a<-table.element(a,round(mytstat,4))
a<-table.element(a,round(1-pt(abs(mytstat),lengthx),6))
a<-table.row.end(a)
}
a<-table.end(a)
table.save(a,file='mytable.tab')
a<-table.start()
a<-table.row.start(a)
a<-table.element(a,'Partial Autocorrelation Function',4,TRUE)
a<-table.row.end(a)
a<-table.row.start(a)
a<-table.element(a,'Time lag k',header=TRUE)
a<-table.element(a,hyperlink('basics.htm','PACF(k)','click here for more information about the Partial Autocorrelation Function'),header=TRUE)
a<-table.element(a,'T-STAT',header=TRUE)
a<-table.element(a,'P-value',header=TRUE)
a<-table.row.end(a)
for (i in 1:par1) {
a<-table.row.start(a)
a<-table.element(a,i,header=TRUE)
a<-table.element(a,round(mypacf[i],6))
mytstat <- mypacf[i]*sqrtn
a<-table.element(a,round(mytstat,4))
a<-table.element(a,round(1-pt(abs(mytstat),lengthx),6))
a<-table.row.end(a)
}
a<-table.end(a)
table.save(a,file='mytable1.tab')