Free Statistics

of Irreproducible Research!

Author's title

Author*Unverified author*
R Software Modulerwasp_exponentialsmoothing.wasp
Title produced by softwareExponential Smoothing
Date of computationThu, 04 Jun 2009 13:44:00 -0600
Cite this page as followsStatistical Computations at FreeStatistics.org, Office for Research Development and Education, URL https://freestatistics.org/blog/index.php?v=date/2009/Jun/04/t124414469005fe0s0hjzu5ja1.htm/, Retrieved Tue, 14 May 2024 10:25:04 +0000
Statistical Computations at FreeStatistics.org, Office for Research Development and Education, URL https://freestatistics.org/blog/index.php?pk=41739, Retrieved Tue, 14 May 2024 10:25:04 +0000
QR Codes:

Original text written by user:
IsPrivate?No (this computation is public)
User-defined keywords
Estimated Impact103
Family? (F = Feedback message, R = changed R code, M = changed R Module, P = changed Parameters, D = changed Data)
-     [Exponential Smoothing] [nen trippel veu d...] [2009-06-04 19:19:24] [74be16979710d4c4e7c6647856088456]
-   PD    [Exponential Smoothing] [nen dobbele voor ...] [2009-06-04 19:44:00] [d41d8cd98f00b204e9800998ecf8427e] [Current]
Feedback Forum

Post a new message
Dataseries X:
9,3700
9,3300
9,3100
9,2600
9,3500
9,3800
9,4300
9,2700
9,2900
9,2700
9,2900
9,3100
9,3300
9,3500
9,3400
9,4700
9,6300
9,6200
9,6300
9,5000
9,5500
9,5800
9,6100
9,5700
9,6100
9,6500
9,6200
9,6500
9,9600
10,0300
10,0300
9,7200
9,7500
9,7700
9,7800
9,8200
9,8400
9,9000
9,9400
10,1200
10,5200
10,5700
10,5700
10,1200
10,0500
10,1400
10,1700
10,2000
10,2000
10,3500
10,4300
10,5700
10,8200
10,9000
10,8300
10,6500
10,5700
10,6100
10,6300
10,6100
10,7200
10,7700
10,7900
10,9200
10,9000
11,0000
10,9900
10,9100
10,8800
10,8700
11,0000
10,9900
11,0300
11,0400
10,9900


Summary of computational transaction
Raw Inputview raw input (R code)
Raw Outputview raw output of R engine
Computing time2 seconds
R Server'Sir Ronald Aylmer Fisher' @ 193.190.124.24

\begin{tabular}{lllllllll}
\hline
Summary of computational transaction \tabularnewline
Raw Input & view raw input (R code)  \tabularnewline
Raw Output & view raw output of R engine  \tabularnewline
Computing time & 2 seconds \tabularnewline
R Server & 'Sir Ronald Aylmer Fisher' @ 193.190.124.24 \tabularnewline
\hline
\end{tabular}
%Source: https://freestatistics.org/blog/index.php?pk=41739&T=0

[TABLE]
[ROW][C]Summary of computational transaction[/C][/ROW]
[ROW][C]Raw Input[/C][C]view raw input (R code) [/C][/ROW]
[ROW][C]Raw Output[/C][C]view raw output of R engine [/C][/ROW]
[ROW][C]Computing time[/C][C]2 seconds[/C][/ROW]
[ROW][C]R Server[/C][C]'Sir Ronald Aylmer Fisher' @ 193.190.124.24[/C][/ROW]
[/TABLE]
Source: https://freestatistics.org/blog/index.php?pk=41739&T=0

Globally Unique Identifier (entire table): ba.freestatistics.org/blog/index.php?pk=41739&T=0

As an alternative you can also use a QR Code:  

The GUIDs for individual cells are displayed in the table below:

Summary of computational transaction
Raw Inputview raw input (R code)
Raw Outputview raw output of R engine
Computing time2 seconds
R Server'Sir Ronald Aylmer Fisher' @ 193.190.124.24


Estimated Parameters of Exponential Smoothing
ParameterValue
alpha1
beta0
gamma0

\begin{tabular}{lllllllll}
\hline
Estimated Parameters of Exponential Smoothing \tabularnewline
Parameter & Value \tabularnewline
alpha & 1 \tabularnewline
beta & 0 \tabularnewline
gamma & 0 \tabularnewline
\hline
\end{tabular}
%Source: https://freestatistics.org/blog/index.php?pk=41739&T=1

[TABLE]
[ROW][C]Estimated Parameters of Exponential Smoothing[/C][/ROW]
[ROW][C]Parameter[/C][C]Value[/C][/ROW]
[ROW][C]alpha[/C][C]1[/C][/ROW]
[ROW][C]beta[/C][C]0[/C][/ROW]
[ROW][C]gamma[/C][C]0[/C][/ROW]
[/TABLE]
Source: https://freestatistics.org/blog/index.php?pk=41739&T=1

Globally Unique Identifier (entire table): ba.freestatistics.org/blog/index.php?pk=41739&T=1

As an alternative you can also use a QR Code:  

The GUIDs for individual cells are displayed in the table below:

Estimated Parameters of Exponential Smoothing
ParameterValue
alpha1
beta0
gamma0


Interpolation Forecasts of Exponential Smoothing
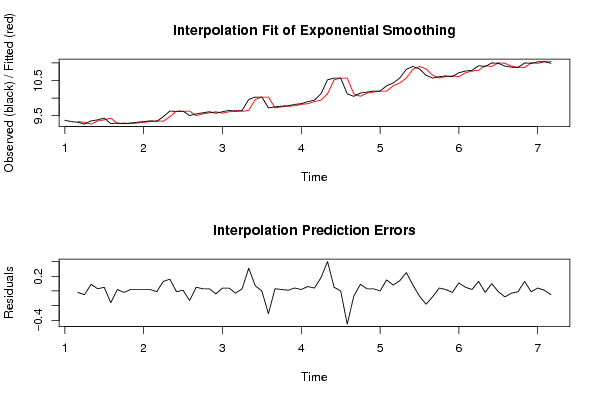
tObservedFittedResiduals
39.319.33-0.0199999999999996
49.269.31-0.0500000000000007
59.359.260.0899999999999999
69.389.350.0300000000000011
79.439.380.0499999999999989
89.279.43-0.16
99.299.270.0199999999999996
109.279.29-0.0199999999999996
119.299.270.0199999999999996
129.319.290.0200000000000014
139.339.310.0199999999999996
149.359.330.0199999999999996
159.349.35-0.00999999999999979
169.479.340.130000000000001
179.639.470.16
189.629.63-0.0100000000000016
199.639.620.0100000000000016
209.59.63-0.130000000000001
219.559.50.0500000000000007
229.589.550.0299999999999994
239.619.580.0299999999999994
249.579.61-0.0399999999999991
259.619.570.0399999999999991
269.659.610.0400000000000009
279.629.65-0.0300000000000011
289.659.620.0300000000000011
299.969.650.310000000000000
3010.039.960.0699999999999985
3110.0310.030
329.7210.03-0.309999999999999
339.759.720.0299999999999994
349.779.750.0199999999999996
359.789.770.00999999999999979
369.829.780.0400000000000009
379.849.820.0199999999999996
389.99.840.0600000000000005
399.949.90.0399999999999991
4010.129.940.180000000000000
4110.5210.120.4
4210.5710.520.0500000000000007
4310.5710.570
4410.1210.57-0.450000000000001
4510.0510.12-0.0699999999999985
4610.1410.050.0899999999999999
4710.1710.140.0299999999999994
4810.210.170.0299999999999994
4910.210.20
5010.3510.20.150000000000000
5110.4310.350.08
5210.5710.430.140000000000001
5310.8210.570.25
5410.910.820.08
5510.8310.9-0.0700000000000003
5610.6510.83-0.180000000000000
5710.5710.65-0.08
5810.6110.570.0399999999999991
5910.6310.610.0200000000000014
6010.6110.63-0.0200000000000014
6110.7210.610.110000000000001
6210.7710.720.0499999999999989
6310.7910.770.0199999999999996
6410.9210.790.130000000000001
6510.910.92-0.0199999999999996
661110.90.0999999999999996
6710.9911-0.00999999999999979
6810.9110.99-0.08
6910.8810.91-0.0299999999999994
7010.8710.88-0.0100000000000016
711110.870.130000000000001
7210.9911-0.00999999999999979
7311.0310.990.0399999999999991
7411.0411.030.00999999999999979
7510.9911.04-0.0499999999999989

\begin{tabular}{lllllllll}
\hline
Interpolation Forecasts of Exponential Smoothing \tabularnewline
t & Observed & Fitted & Residuals \tabularnewline
3 & 9.31 & 9.33 & -0.0199999999999996 \tabularnewline
4 & 9.26 & 9.31 & -0.0500000000000007 \tabularnewline
5 & 9.35 & 9.26 & 0.0899999999999999 \tabularnewline
6 & 9.38 & 9.35 & 0.0300000000000011 \tabularnewline
7 & 9.43 & 9.38 & 0.0499999999999989 \tabularnewline
8 & 9.27 & 9.43 & -0.16 \tabularnewline
9 & 9.29 & 9.27 & 0.0199999999999996 \tabularnewline
10 & 9.27 & 9.29 & -0.0199999999999996 \tabularnewline
11 & 9.29 & 9.27 & 0.0199999999999996 \tabularnewline
12 & 9.31 & 9.29 & 0.0200000000000014 \tabularnewline
13 & 9.33 & 9.31 & 0.0199999999999996 \tabularnewline
14 & 9.35 & 9.33 & 0.0199999999999996 \tabularnewline
15 & 9.34 & 9.35 & -0.00999999999999979 \tabularnewline
16 & 9.47 & 9.34 & 0.130000000000001 \tabularnewline
17 & 9.63 & 9.47 & 0.16 \tabularnewline
18 & 9.62 & 9.63 & -0.0100000000000016 \tabularnewline
19 & 9.63 & 9.62 & 0.0100000000000016 \tabularnewline
20 & 9.5 & 9.63 & -0.130000000000001 \tabularnewline
21 & 9.55 & 9.5 & 0.0500000000000007 \tabularnewline
22 & 9.58 & 9.55 & 0.0299999999999994 \tabularnewline
23 & 9.61 & 9.58 & 0.0299999999999994 \tabularnewline
24 & 9.57 & 9.61 & -0.0399999999999991 \tabularnewline
25 & 9.61 & 9.57 & 0.0399999999999991 \tabularnewline
26 & 9.65 & 9.61 & 0.0400000000000009 \tabularnewline
27 & 9.62 & 9.65 & -0.0300000000000011 \tabularnewline
28 & 9.65 & 9.62 & 0.0300000000000011 \tabularnewline
29 & 9.96 & 9.65 & 0.310000000000000 \tabularnewline
30 & 10.03 & 9.96 & 0.0699999999999985 \tabularnewline
31 & 10.03 & 10.03 & 0 \tabularnewline
32 & 9.72 & 10.03 & -0.309999999999999 \tabularnewline
33 & 9.75 & 9.72 & 0.0299999999999994 \tabularnewline
34 & 9.77 & 9.75 & 0.0199999999999996 \tabularnewline
35 & 9.78 & 9.77 & 0.00999999999999979 \tabularnewline
36 & 9.82 & 9.78 & 0.0400000000000009 \tabularnewline
37 & 9.84 & 9.82 & 0.0199999999999996 \tabularnewline
38 & 9.9 & 9.84 & 0.0600000000000005 \tabularnewline
39 & 9.94 & 9.9 & 0.0399999999999991 \tabularnewline
40 & 10.12 & 9.94 & 0.180000000000000 \tabularnewline
41 & 10.52 & 10.12 & 0.4 \tabularnewline
42 & 10.57 & 10.52 & 0.0500000000000007 \tabularnewline
43 & 10.57 & 10.57 & 0 \tabularnewline
44 & 10.12 & 10.57 & -0.450000000000001 \tabularnewline
45 & 10.05 & 10.12 & -0.0699999999999985 \tabularnewline
46 & 10.14 & 10.05 & 0.0899999999999999 \tabularnewline
47 & 10.17 & 10.14 & 0.0299999999999994 \tabularnewline
48 & 10.2 & 10.17 & 0.0299999999999994 \tabularnewline
49 & 10.2 & 10.2 & 0 \tabularnewline
50 & 10.35 & 10.2 & 0.150000000000000 \tabularnewline
51 & 10.43 & 10.35 & 0.08 \tabularnewline
52 & 10.57 & 10.43 & 0.140000000000001 \tabularnewline
53 & 10.82 & 10.57 & 0.25 \tabularnewline
54 & 10.9 & 10.82 & 0.08 \tabularnewline
55 & 10.83 & 10.9 & -0.0700000000000003 \tabularnewline
56 & 10.65 & 10.83 & -0.180000000000000 \tabularnewline
57 & 10.57 & 10.65 & -0.08 \tabularnewline
58 & 10.61 & 10.57 & 0.0399999999999991 \tabularnewline
59 & 10.63 & 10.61 & 0.0200000000000014 \tabularnewline
60 & 10.61 & 10.63 & -0.0200000000000014 \tabularnewline
61 & 10.72 & 10.61 & 0.110000000000001 \tabularnewline
62 & 10.77 & 10.72 & 0.0499999999999989 \tabularnewline
63 & 10.79 & 10.77 & 0.0199999999999996 \tabularnewline
64 & 10.92 & 10.79 & 0.130000000000001 \tabularnewline
65 & 10.9 & 10.92 & -0.0199999999999996 \tabularnewline
66 & 11 & 10.9 & 0.0999999999999996 \tabularnewline
67 & 10.99 & 11 & -0.00999999999999979 \tabularnewline
68 & 10.91 & 10.99 & -0.08 \tabularnewline
69 & 10.88 & 10.91 & -0.0299999999999994 \tabularnewline
70 & 10.87 & 10.88 & -0.0100000000000016 \tabularnewline
71 & 11 & 10.87 & 0.130000000000001 \tabularnewline
72 & 10.99 & 11 & -0.00999999999999979 \tabularnewline
73 & 11.03 & 10.99 & 0.0399999999999991 \tabularnewline
74 & 11.04 & 11.03 & 0.00999999999999979 \tabularnewline
75 & 10.99 & 11.04 & -0.0499999999999989 \tabularnewline
\hline
\end{tabular}
%Source: https://freestatistics.org/blog/index.php?pk=41739&T=2

[TABLE]
[ROW][C]Interpolation Forecasts of Exponential Smoothing[/C][/ROW]
[ROW][C]t[/C][C]Observed[/C][C]Fitted[/C][C]Residuals[/C][/ROW]
[ROW][C]3[/C][C]9.31[/C][C]9.33[/C][C]-0.0199999999999996[/C][/ROW]
[ROW][C]4[/C][C]9.26[/C][C]9.31[/C][C]-0.0500000000000007[/C][/ROW]
[ROW][C]5[/C][C]9.35[/C][C]9.26[/C][C]0.0899999999999999[/C][/ROW]
[ROW][C]6[/C][C]9.38[/C][C]9.35[/C][C]0.0300000000000011[/C][/ROW]
[ROW][C]7[/C][C]9.43[/C][C]9.38[/C][C]0.0499999999999989[/C][/ROW]
[ROW][C]8[/C][C]9.27[/C][C]9.43[/C][C]-0.16[/C][/ROW]
[ROW][C]9[/C][C]9.29[/C][C]9.27[/C][C]0.0199999999999996[/C][/ROW]
[ROW][C]10[/C][C]9.27[/C][C]9.29[/C][C]-0.0199999999999996[/C][/ROW]
[ROW][C]11[/C][C]9.29[/C][C]9.27[/C][C]0.0199999999999996[/C][/ROW]
[ROW][C]12[/C][C]9.31[/C][C]9.29[/C][C]0.0200000000000014[/C][/ROW]
[ROW][C]13[/C][C]9.33[/C][C]9.31[/C][C]0.0199999999999996[/C][/ROW]
[ROW][C]14[/C][C]9.35[/C][C]9.33[/C][C]0.0199999999999996[/C][/ROW]
[ROW][C]15[/C][C]9.34[/C][C]9.35[/C][C]-0.00999999999999979[/C][/ROW]
[ROW][C]16[/C][C]9.47[/C][C]9.34[/C][C]0.130000000000001[/C][/ROW]
[ROW][C]17[/C][C]9.63[/C][C]9.47[/C][C]0.16[/C][/ROW]
[ROW][C]18[/C][C]9.62[/C][C]9.63[/C][C]-0.0100000000000016[/C][/ROW]
[ROW][C]19[/C][C]9.63[/C][C]9.62[/C][C]0.0100000000000016[/C][/ROW]
[ROW][C]20[/C][C]9.5[/C][C]9.63[/C][C]-0.130000000000001[/C][/ROW]
[ROW][C]21[/C][C]9.55[/C][C]9.5[/C][C]0.0500000000000007[/C][/ROW]
[ROW][C]22[/C][C]9.58[/C][C]9.55[/C][C]0.0299999999999994[/C][/ROW]
[ROW][C]23[/C][C]9.61[/C][C]9.58[/C][C]0.0299999999999994[/C][/ROW]
[ROW][C]24[/C][C]9.57[/C][C]9.61[/C][C]-0.0399999999999991[/C][/ROW]
[ROW][C]25[/C][C]9.61[/C][C]9.57[/C][C]0.0399999999999991[/C][/ROW]
[ROW][C]26[/C][C]9.65[/C][C]9.61[/C][C]0.0400000000000009[/C][/ROW]
[ROW][C]27[/C][C]9.62[/C][C]9.65[/C][C]-0.0300000000000011[/C][/ROW]
[ROW][C]28[/C][C]9.65[/C][C]9.62[/C][C]0.0300000000000011[/C][/ROW]
[ROW][C]29[/C][C]9.96[/C][C]9.65[/C][C]0.310000000000000[/C][/ROW]
[ROW][C]30[/C][C]10.03[/C][C]9.96[/C][C]0.0699999999999985[/C][/ROW]
[ROW][C]31[/C][C]10.03[/C][C]10.03[/C][C]0[/C][/ROW]
[ROW][C]32[/C][C]9.72[/C][C]10.03[/C][C]-0.309999999999999[/C][/ROW]
[ROW][C]33[/C][C]9.75[/C][C]9.72[/C][C]0.0299999999999994[/C][/ROW]
[ROW][C]34[/C][C]9.77[/C][C]9.75[/C][C]0.0199999999999996[/C][/ROW]
[ROW][C]35[/C][C]9.78[/C][C]9.77[/C][C]0.00999999999999979[/C][/ROW]
[ROW][C]36[/C][C]9.82[/C][C]9.78[/C][C]0.0400000000000009[/C][/ROW]
[ROW][C]37[/C][C]9.84[/C][C]9.82[/C][C]0.0199999999999996[/C][/ROW]
[ROW][C]38[/C][C]9.9[/C][C]9.84[/C][C]0.0600000000000005[/C][/ROW]
[ROW][C]39[/C][C]9.94[/C][C]9.9[/C][C]0.0399999999999991[/C][/ROW]
[ROW][C]40[/C][C]10.12[/C][C]9.94[/C][C]0.180000000000000[/C][/ROW]
[ROW][C]41[/C][C]10.52[/C][C]10.12[/C][C]0.4[/C][/ROW]
[ROW][C]42[/C][C]10.57[/C][C]10.52[/C][C]0.0500000000000007[/C][/ROW]
[ROW][C]43[/C][C]10.57[/C][C]10.57[/C][C]0[/C][/ROW]
[ROW][C]44[/C][C]10.12[/C][C]10.57[/C][C]-0.450000000000001[/C][/ROW]
[ROW][C]45[/C][C]10.05[/C][C]10.12[/C][C]-0.0699999999999985[/C][/ROW]
[ROW][C]46[/C][C]10.14[/C][C]10.05[/C][C]0.0899999999999999[/C][/ROW]
[ROW][C]47[/C][C]10.17[/C][C]10.14[/C][C]0.0299999999999994[/C][/ROW]
[ROW][C]48[/C][C]10.2[/C][C]10.17[/C][C]0.0299999999999994[/C][/ROW]
[ROW][C]49[/C][C]10.2[/C][C]10.2[/C][C]0[/C][/ROW]
[ROW][C]50[/C][C]10.35[/C][C]10.2[/C][C]0.150000000000000[/C][/ROW]
[ROW][C]51[/C][C]10.43[/C][C]10.35[/C][C]0.08[/C][/ROW]
[ROW][C]52[/C][C]10.57[/C][C]10.43[/C][C]0.140000000000001[/C][/ROW]
[ROW][C]53[/C][C]10.82[/C][C]10.57[/C][C]0.25[/C][/ROW]
[ROW][C]54[/C][C]10.9[/C][C]10.82[/C][C]0.08[/C][/ROW]
[ROW][C]55[/C][C]10.83[/C][C]10.9[/C][C]-0.0700000000000003[/C][/ROW]
[ROW][C]56[/C][C]10.65[/C][C]10.83[/C][C]-0.180000000000000[/C][/ROW]
[ROW][C]57[/C][C]10.57[/C][C]10.65[/C][C]-0.08[/C][/ROW]
[ROW][C]58[/C][C]10.61[/C][C]10.57[/C][C]0.0399999999999991[/C][/ROW]
[ROW][C]59[/C][C]10.63[/C][C]10.61[/C][C]0.0200000000000014[/C][/ROW]
[ROW][C]60[/C][C]10.61[/C][C]10.63[/C][C]-0.0200000000000014[/C][/ROW]
[ROW][C]61[/C][C]10.72[/C][C]10.61[/C][C]0.110000000000001[/C][/ROW]
[ROW][C]62[/C][C]10.77[/C][C]10.72[/C][C]0.0499999999999989[/C][/ROW]
[ROW][C]63[/C][C]10.79[/C][C]10.77[/C][C]0.0199999999999996[/C][/ROW]
[ROW][C]64[/C][C]10.92[/C][C]10.79[/C][C]0.130000000000001[/C][/ROW]
[ROW][C]65[/C][C]10.9[/C][C]10.92[/C][C]-0.0199999999999996[/C][/ROW]
[ROW][C]66[/C][C]11[/C][C]10.9[/C][C]0.0999999999999996[/C][/ROW]
[ROW][C]67[/C][C]10.99[/C][C]11[/C][C]-0.00999999999999979[/C][/ROW]
[ROW][C]68[/C][C]10.91[/C][C]10.99[/C][C]-0.08[/C][/ROW]
[ROW][C]69[/C][C]10.88[/C][C]10.91[/C][C]-0.0299999999999994[/C][/ROW]
[ROW][C]70[/C][C]10.87[/C][C]10.88[/C][C]-0.0100000000000016[/C][/ROW]
[ROW][C]71[/C][C]11[/C][C]10.87[/C][C]0.130000000000001[/C][/ROW]
[ROW][C]72[/C][C]10.99[/C][C]11[/C][C]-0.00999999999999979[/C][/ROW]
[ROW][C]73[/C][C]11.03[/C][C]10.99[/C][C]0.0399999999999991[/C][/ROW]
[ROW][C]74[/C][C]11.04[/C][C]11.03[/C][C]0.00999999999999979[/C][/ROW]
[ROW][C]75[/C][C]10.99[/C][C]11.04[/C][C]-0.0499999999999989[/C][/ROW]
[/TABLE]
Source: https://freestatistics.org/blog/index.php?pk=41739&T=2

Globally Unique Identifier (entire table): ba.freestatistics.org/blog/index.php?pk=41739&T=2

As an alternative you can also use a QR Code:  

The GUIDs for individual cells are displayed in the table below:

Interpolation Forecasts of Exponential Smoothing
tObservedFittedResiduals
39.319.33-0.0199999999999996
49.269.31-0.0500000000000007
59.359.260.0899999999999999
69.389.350.0300000000000011
79.439.380.0499999999999989
89.279.43-0.16
99.299.270.0199999999999996
109.279.29-0.0199999999999996
119.299.270.0199999999999996
129.319.290.0200000000000014
139.339.310.0199999999999996
149.359.330.0199999999999996
159.349.35-0.00999999999999979
169.479.340.130000000000001
179.639.470.16
189.629.63-0.0100000000000016
199.639.620.0100000000000016
209.59.63-0.130000000000001
219.559.50.0500000000000007
229.589.550.0299999999999994
239.619.580.0299999999999994
249.579.61-0.0399999999999991
259.619.570.0399999999999991
269.659.610.0400000000000009
279.629.65-0.0300000000000011
289.659.620.0300000000000011
299.969.650.310000000000000
3010.039.960.0699999999999985
3110.0310.030
329.7210.03-0.309999999999999
339.759.720.0299999999999994
349.779.750.0199999999999996
359.789.770.00999999999999979
369.829.780.0400000000000009
379.849.820.0199999999999996
389.99.840.0600000000000005
399.949.90.0399999999999991
4010.129.940.180000000000000
4110.5210.120.4
4210.5710.520.0500000000000007
4310.5710.570
4410.1210.57-0.450000000000001
4510.0510.12-0.0699999999999985
4610.1410.050.0899999999999999
4710.1710.140.0299999999999994
4810.210.170.0299999999999994
4910.210.20
5010.3510.20.150000000000000
5110.4310.350.08
5210.5710.430.140000000000001
5310.8210.570.25
5410.910.820.08
5510.8310.9-0.0700000000000003
5610.6510.83-0.180000000000000
5710.5710.65-0.08
5810.6110.570.0399999999999991
5910.6310.610.0200000000000014
6010.6110.63-0.0200000000000014
6110.7210.610.110000000000001
6210.7710.720.0499999999999989
6310.7910.770.0199999999999996
6410.9210.790.130000000000001
6510.910.92-0.0199999999999996
661110.90.0999999999999996
6710.9911-0.00999999999999979
6810.9110.99-0.08
6910.8810.91-0.0299999999999994
7010.8710.88-0.0100000000000016
711110.870.130000000000001
7210.9911-0.00999999999999979
7311.0310.990.0399999999999991
7411.0411.030.00999999999999979
7510.9911.04-0.0499999999999989


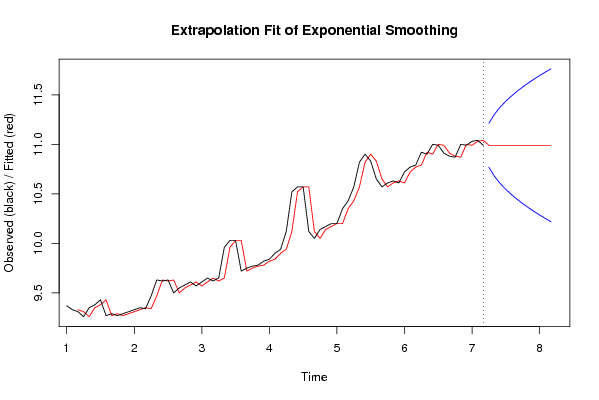
Extrapolation Forecasts of Exponential Smoothing
tForecast95% Lower Bound95% Upper Bound
7610.9910.767528492198011.2124715078020
7710.9910.675377776424811.3046222235752
7810.9910.604668045250511.3753319547495
7910.9910.545056984396011.4349430156040
8010.9910.492538585497911.4874614145021
8110.9910.445058323577511.5349416764225
8210.9910.401395716558411.5786042834416
8310.9910.360755552849711.6192444471503
8410.9910.322585476594111.6574145234059
8510.9910.286483320853811.6935166791462
8610.9910.252145482076211.7278545179238
8710.9910.219336090501011.7606639094990

\begin{tabular}{lllllllll}
\hline
Extrapolation Forecasts of Exponential Smoothing \tabularnewline
t & Forecast & 95% Lower Bound & 95% Upper Bound \tabularnewline
76 & 10.99 & 10.7675284921980 & 11.2124715078020 \tabularnewline
77 & 10.99 & 10.6753777764248 & 11.3046222235752 \tabularnewline
78 & 10.99 & 10.6046680452505 & 11.3753319547495 \tabularnewline
79 & 10.99 & 10.5450569843960 & 11.4349430156040 \tabularnewline
80 & 10.99 & 10.4925385854979 & 11.4874614145021 \tabularnewline
81 & 10.99 & 10.4450583235775 & 11.5349416764225 \tabularnewline
82 & 10.99 & 10.4013957165584 & 11.5786042834416 \tabularnewline
83 & 10.99 & 10.3607555528497 & 11.6192444471503 \tabularnewline
84 & 10.99 & 10.3225854765941 & 11.6574145234059 \tabularnewline
85 & 10.99 & 10.2864833208538 & 11.6935166791462 \tabularnewline
86 & 10.99 & 10.2521454820762 & 11.7278545179238 \tabularnewline
87 & 10.99 & 10.2193360905010 & 11.7606639094990 \tabularnewline
\hline
\end{tabular}
%Source: https://freestatistics.org/blog/index.php?pk=41739&T=3

[TABLE]
[ROW][C]Extrapolation Forecasts of Exponential Smoothing[/C][/ROW]
[ROW][C]t[/C][C]Forecast[/C][C]95% Lower Bound[/C][C]95% Upper Bound[/C][/ROW]
[ROW][C]76[/C][C]10.99[/C][C]10.7675284921980[/C][C]11.2124715078020[/C][/ROW]
[ROW][C]77[/C][C]10.99[/C][C]10.6753777764248[/C][C]11.3046222235752[/C][/ROW]
[ROW][C]78[/C][C]10.99[/C][C]10.6046680452505[/C][C]11.3753319547495[/C][/ROW]
[ROW][C]79[/C][C]10.99[/C][C]10.5450569843960[/C][C]11.4349430156040[/C][/ROW]
[ROW][C]80[/C][C]10.99[/C][C]10.4925385854979[/C][C]11.4874614145021[/C][/ROW]
[ROW][C]81[/C][C]10.99[/C][C]10.4450583235775[/C][C]11.5349416764225[/C][/ROW]
[ROW][C]82[/C][C]10.99[/C][C]10.4013957165584[/C][C]11.5786042834416[/C][/ROW]
[ROW][C]83[/C][C]10.99[/C][C]10.3607555528497[/C][C]11.6192444471503[/C][/ROW]
[ROW][C]84[/C][C]10.99[/C][C]10.3225854765941[/C][C]11.6574145234059[/C][/ROW]
[ROW][C]85[/C][C]10.99[/C][C]10.2864833208538[/C][C]11.6935166791462[/C][/ROW]
[ROW][C]86[/C][C]10.99[/C][C]10.2521454820762[/C][C]11.7278545179238[/C][/ROW]
[ROW][C]87[/C][C]10.99[/C][C]10.2193360905010[/C][C]11.7606639094990[/C][/ROW]
[/TABLE]
Source: https://freestatistics.org/blog/index.php?pk=41739&T=3

Globally Unique Identifier (entire table): ba.freestatistics.org/blog/index.php?pk=41739&T=3

As an alternative you can also use a QR Code:  

The GUIDs for individual cells are displayed in the table below:

Extrapolation Forecasts of Exponential Smoothing
tForecast95% Lower Bound95% Upper Bound
7610.9910.767528492198011.2124715078020
7710.9910.675377776424811.3046222235752
7810.9910.604668045250511.3753319547495
7910.9910.545056984396011.4349430156040
8010.9910.492538585497911.4874614145021
8110.9910.445058323577511.5349416764225
8210.9910.401395716558411.5786042834416
8310.9910.360755552849711.6192444471503
8410.9910.322585476594111.6574145234059
8510.9910.286483320853811.6935166791462
8610.9910.252145482076211.7278545179238
8710.9910.219336090501011.7606639094990


Parameters (Session):
par1 = 12 ; par2 = Double ; par3 = additive ;
Parameters (R input):
par1 = 12 ; par2 = Double ; par3 = additive ;
R code (references can be found in the software module):
par1 <- as.numeric(par1)
if (par2 == 'Single') K <- 1
if (par2 == 'Double') K <- 2
if (par2 == 'Triple') K <- par1
nx <- length(x)
nxmK <- nx - K
x <- ts(x, frequency = par1)
if (par2 == 'Single') fit <- HoltWinters(x, gamma=0, beta=0)
if (par2 == 'Double') fit <- HoltWinters(x, gamma=0)
if (par2 == 'Triple') fit <- HoltWinters(x, seasonal=par3)
fit
myresid <- x - fit$fitted[,'xhat']
bitmap(file='test1.png')
op <- par(mfrow=c(2,1))
plot(fit,ylab='Observed (black) / Fitted (red)',main='Interpolation Fit of Exponential Smoothing')
plot(myresid,ylab='Residuals',main='Interpolation Prediction Errors')
par(op)
dev.off()
bitmap(file='test2.png')
p <- predict(fit, par1, prediction.interval=TRUE)
np <- length(p[,1])
plot(fit,p,ylab='Observed (black) / Fitted (red)',main='Extrapolation Fit of Exponential Smoothing')
dev.off()
bitmap(file='test3.png')
op <- par(mfrow = c(2,2))
acf(as.numeric(myresid),lag.max = nx/2,main='Residual ACF')
spectrum(myresid,main='Residals Periodogram')
cpgram(myresid,main='Residal Cumulative Periodogram')
qqnorm(myresid,main='Residual Normal QQ Plot')
qqline(myresid)
par(op)
dev.off()
load(file='createtable')
a<-table.start()
a<-table.row.start(a)
a<-table.element(a,'Estimated Parameters of Exponential Smoothing',2,TRUE)
a<-table.row.end(a)
a<-table.row.start(a)
a<-table.element(a,'Parameter',header=TRUE)
a<-table.element(a,'Value',header=TRUE)
a<-table.row.end(a)
a<-table.row.start(a)
a<-table.element(a,'alpha',header=TRUE)
a<-table.element(a,fit$alpha)
a<-table.row.end(a)
a<-table.row.start(a)
a<-table.element(a,'beta',header=TRUE)
a<-table.element(a,fit$beta)
a<-table.row.end(a)
a<-table.row.start(a)
a<-table.element(a,'gamma',header=TRUE)
a<-table.element(a,fit$gamma)
a<-table.row.end(a)
a<-table.end(a)
table.save(a,file='mytable.tab')
a<-table.start()
a<-table.row.start(a)
a<-table.element(a,'Interpolation Forecasts of Exponential Smoothing',4,TRUE)
a<-table.row.end(a)
a<-table.row.start(a)
a<-table.element(a,'t',header=TRUE)
a<-table.element(a,'Observed',header=TRUE)
a<-table.element(a,'Fitted',header=TRUE)
a<-table.element(a,'Residuals',header=TRUE)
a<-table.row.end(a)
for (i in 1:nxmK) {
a<-table.row.start(a)
a<-table.element(a,i+K,header=TRUE)
a<-table.element(a,x[i+K])
a<-table.element(a,fit$fitted[i,'xhat'])
a<-table.element(a,myresid[i])
a<-table.row.end(a)
}
a<-table.end(a)
table.save(a,file='mytable1.tab')
a<-table.start()
a<-table.row.start(a)
a<-table.element(a,'Extrapolation Forecasts of Exponential Smoothing',4,TRUE)
a<-table.row.end(a)
a<-table.row.start(a)
a<-table.element(a,'t',header=TRUE)
a<-table.element(a,'Forecast',header=TRUE)
a<-table.element(a,'95% Lower Bound',header=TRUE)
a<-table.element(a,'95% Upper Bound',header=TRUE)
a<-table.row.end(a)
for (i in 1:np) {
a<-table.row.start(a)
a<-table.element(a,nx+i,header=TRUE)
a<-table.element(a,p[i,'fit'])
a<-table.element(a,p[i,'lwr'])
a<-table.element(a,p[i,'upr'])
a<-table.row.end(a)
}
a<-table.end(a)
table.save(a,file='mytable2.tab')