Free Statistics

of Irreproducible Research!

Author's title

Author*Unverified author*
R Software Modulerwasp_exponentialsmoothing.wasp
Title produced by softwareExponential Smoothing
Date of computationThu, 04 Jun 2009 09:24:33 -0600
Cite this page as followsStatistical Computations at FreeStatistics.org, Office for Research Development and Education, URL https://freestatistics.org/blog/index.php?v=date/2009/Jun/04/t1244130057dt77942jjigupol.htm/, Retrieved Tue, 14 May 2024 12:08:44 +0000
Statistical Computations at FreeStatistics.org, Office for Research Development and Education, URL https://freestatistics.org/blog/index.php?pk=41714, Retrieved Tue, 14 May 2024 12:08:44 +0000
QR Codes:

Original text written by user:
IsPrivate?No (this computation is public)
User-defined keywords
Estimated Impact144
Family? (F = Feedback message, R = changed R code, M = changed R Module, P = changed Parameters, D = changed Data)
-       [Exponential Smoothing] [Exponential Smoot...] [2009-06-04 15:24:33] [8066ce735b3f8beadb711a8680cf7d00] [Current]
-    D    [Exponential Smoothing] [Kim Van Assche We...] [2009-06-05 20:03:06] [74be16979710d4c4e7c6647856088456]
-   P       [Exponential Smoothing] [Kim Van Assche We...] [2009-06-05 20:08:29] [74be16979710d4c4e7c6647856088456]
-   P         [Exponential Smoothing] [Kim Van Assche We...] [2009-06-06 09:06:29] [74be16979710d4c4e7c6647856088456]
-   PD      [Exponential Smoothing] [Ken Soltvedt Pers...] [2009-06-05 20:38:05] [74be16979710d4c4e7c6647856088456]
Feedback Forum

Post a new message
Dataseries X:
517
510
509
501
507
569
580
578
565
547
555
562
561
555
544
537
543
594
611
613
611
594
595
591
589
584
573
567
569
621
629
628
612
595
597
593
590
580
574
573
573
620
626
620
588
566
557
561
549
532
526
511
499
555
565
542
527
510
514
517
508
493
490
469
478
528
534
518
506
502
516
528


Summary of computational transaction
Raw Inputview raw input (R code)
Raw Outputview raw output of R engine
Computing time2 seconds
R Server'Sir Ronald Aylmer Fisher' @ 193.190.124.24

\begin{tabular}{lllllllll}
\hline
Summary of computational transaction \tabularnewline
Raw Input & view raw input (R code)  \tabularnewline
Raw Output & view raw output of R engine  \tabularnewline
Computing time & 2 seconds \tabularnewline
R Server & 'Sir Ronald Aylmer Fisher' @ 193.190.124.24 \tabularnewline
\hline
\end{tabular}
%Source: https://freestatistics.org/blog/index.php?pk=41714&T=0

[TABLE]
[ROW][C]Summary of computational transaction[/C][/ROW]
[ROW][C]Raw Input[/C][C]view raw input (R code) [/C][/ROW]
[ROW][C]Raw Output[/C][C]view raw output of R engine [/C][/ROW]
[ROW][C]Computing time[/C][C]2 seconds[/C][/ROW]
[ROW][C]R Server[/C][C]'Sir Ronald Aylmer Fisher' @ 193.190.124.24[/C][/ROW]
[/TABLE]
Source: https://freestatistics.org/blog/index.php?pk=41714&T=0

Globally Unique Identifier (entire table): ba.freestatistics.org/blog/index.php?pk=41714&T=0

As an alternative you can also use a QR Code:  

The GUIDs for individual cells are displayed in the table below:

Summary of computational transaction
Raw Inputview raw input (R code)
Raw Outputview raw output of R engine
Computing time2 seconds
R Server'Sir Ronald Aylmer Fisher' @ 193.190.124.24


Estimated Parameters of Exponential Smoothing
ParameterValue
alpha0.962561580125543
beta0.116796775763424
gamma1

\begin{tabular}{lllllllll}
\hline
Estimated Parameters of Exponential Smoothing \tabularnewline
Parameter & Value \tabularnewline
alpha & 0.962561580125543 \tabularnewline
beta & 0.116796775763424 \tabularnewline
gamma & 1 \tabularnewline
\hline
\end{tabular}
%Source: https://freestatistics.org/blog/index.php?pk=41714&T=1

[TABLE]
[ROW][C]Estimated Parameters of Exponential Smoothing[/C][/ROW]
[ROW][C]Parameter[/C][C]Value[/C][/ROW]
[ROW][C]alpha[/C][C]0.962561580125543[/C][/ROW]
[ROW][C]beta[/C][C]0.116796775763424[/C][/ROW]
[ROW][C]gamma[/C][C]1[/C][/ROW]
[/TABLE]
Source: https://freestatistics.org/blog/index.php?pk=41714&T=1

Globally Unique Identifier (entire table): ba.freestatistics.org/blog/index.php?pk=41714&T=1

As an alternative you can also use a QR Code:  

The GUIDs for individual cells are displayed in the table below:

Estimated Parameters of Exponential Smoothing
ParameterValue
alpha0.962561580125543
beta0.116796775763424
gamma1


Interpolation Forecasts of Exponential Smoothing
tObservedFittedResiduals
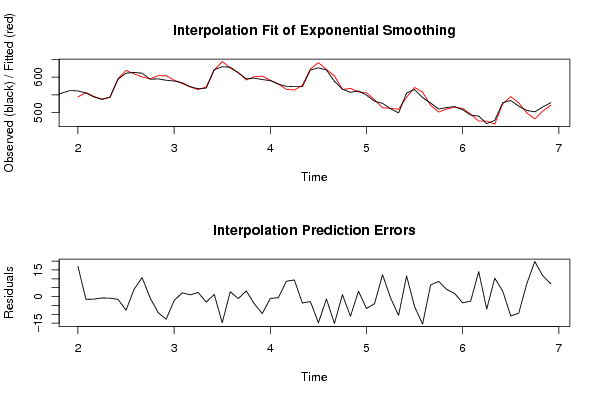
13561544.08146367521416.9185363247861
14555556.558129119468-1.55812911946839
15544545.449695031399-1.4496950313993
16537537.782654787202-0.782654787201523
17543543.919692602988-0.919692602988107
18594595.571427479194-1.57142747919352
19611618.669161100307-7.66916110030672
20613608.9519188282194.04808117178140
21611600.34334563033210.656654369668
22594594.668995751822-0.66899575182174
23595603.97613229179-8.97613229178955
24591603.736338194922-12.7363381949217
25589591.286979743087-2.28697974308682
26584581.8968535676592.10314643234096
27573572.0397352620590.960264737940975
28567564.7113931670112.28860683298876
29569572.13885326425-3.13885326425054
30621619.7198966307271.28010336927298
31629643.744482744384-14.7444827443841
32628625.270414101042.72958589895984
33612613.106823292582-1.10682329258202
34595591.8295898075643.17041019243618
35597601.09722913439-4.09722913438941
36593602.537254045668-9.53725404566762
37590591.042423120945-1.04242312094493
38580580.638541430146-0.638541430146006
39574565.4152829871338.5847170128668
40573563.6485398003569.35146019964384
41573576.638133569976-3.63813356997639
42620622.814794422308-2.81479442230830
43626640.748255682119-14.7482556821191
44620621.374734321672-1.37473432167224
45588603.105406445297-15.1054064452967
46566564.9285825328261.07141746717400
47557568.082520856144-11.0825208561444
48561557.9885890182993.01141098170058
49549555.694908836947-6.69490883694652
50532536.034061557883-4.03406155788343
51526513.67475116226312.3252488377366
52511511.744772780309-0.744772780308608
53499509.602317846058-10.6023178460578
54555543.3959120531111.6040879468902
55565570.672260350964-5.67226035096371
56542557.466582187049-15.4665821870493
57527520.4656204167886.53437958321229
58510501.5035832169028.49641678309837
59514509.9637905058044.03620949419621
60517515.2642058059591.73579419404120
61508511.549850206385-3.54985020638537
62493495.540087370842-2.54008737084217
63490475.92339846867514.0766015313247
64469476.078890784724-7.07889078472442
65478467.64730569688010.3526943031205
66528524.9755097978493.02449020215101
67534544.914861835572-10.9148618355715
68518527.274972356671-9.27497235667124
69506498.7323830547727.26761694522787
70502482.30690656575919.6930934342413
71516504.39371670821111.6062832917889
72528520.7618241386347.23817586136613

\begin{tabular}{lllllllll}
\hline
Interpolation Forecasts of Exponential Smoothing \tabularnewline
t & Observed & Fitted & Residuals \tabularnewline
13 & 561 & 544.081463675214 & 16.9185363247861 \tabularnewline
14 & 555 & 556.558129119468 & -1.55812911946839 \tabularnewline
15 & 544 & 545.449695031399 & -1.4496950313993 \tabularnewline
16 & 537 & 537.782654787202 & -0.782654787201523 \tabularnewline
17 & 543 & 543.919692602988 & -0.919692602988107 \tabularnewline
18 & 594 & 595.571427479194 & -1.57142747919352 \tabularnewline
19 & 611 & 618.669161100307 & -7.66916110030672 \tabularnewline
20 & 613 & 608.951918828219 & 4.04808117178140 \tabularnewline
21 & 611 & 600.343345630332 & 10.656654369668 \tabularnewline
22 & 594 & 594.668995751822 & -0.66899575182174 \tabularnewline
23 & 595 & 603.97613229179 & -8.97613229178955 \tabularnewline
24 & 591 & 603.736338194922 & -12.7363381949217 \tabularnewline
25 & 589 & 591.286979743087 & -2.28697974308682 \tabularnewline
26 & 584 & 581.896853567659 & 2.10314643234096 \tabularnewline
27 & 573 & 572.039735262059 & 0.960264737940975 \tabularnewline
28 & 567 & 564.711393167011 & 2.28860683298876 \tabularnewline
29 & 569 & 572.13885326425 & -3.13885326425054 \tabularnewline
30 & 621 & 619.719896630727 & 1.28010336927298 \tabularnewline
31 & 629 & 643.744482744384 & -14.7444827443841 \tabularnewline
32 & 628 & 625.27041410104 & 2.72958589895984 \tabularnewline
33 & 612 & 613.106823292582 & -1.10682329258202 \tabularnewline
34 & 595 & 591.829589807564 & 3.17041019243618 \tabularnewline
35 & 597 & 601.09722913439 & -4.09722913438941 \tabularnewline
36 & 593 & 602.537254045668 & -9.53725404566762 \tabularnewline
37 & 590 & 591.042423120945 & -1.04242312094493 \tabularnewline
38 & 580 & 580.638541430146 & -0.638541430146006 \tabularnewline
39 & 574 & 565.415282987133 & 8.5847170128668 \tabularnewline
40 & 573 & 563.648539800356 & 9.35146019964384 \tabularnewline
41 & 573 & 576.638133569976 & -3.63813356997639 \tabularnewline
42 & 620 & 622.814794422308 & -2.81479442230830 \tabularnewline
43 & 626 & 640.748255682119 & -14.7482556821191 \tabularnewline
44 & 620 & 621.374734321672 & -1.37473432167224 \tabularnewline
45 & 588 & 603.105406445297 & -15.1054064452967 \tabularnewline
46 & 566 & 564.928582532826 & 1.07141746717400 \tabularnewline
47 & 557 & 568.082520856144 & -11.0825208561444 \tabularnewline
48 & 561 & 557.988589018299 & 3.01141098170058 \tabularnewline
49 & 549 & 555.694908836947 & -6.69490883694652 \tabularnewline
50 & 532 & 536.034061557883 & -4.03406155788343 \tabularnewline
51 & 526 & 513.674751162263 & 12.3252488377366 \tabularnewline
52 & 511 & 511.744772780309 & -0.744772780308608 \tabularnewline
53 & 499 & 509.602317846058 & -10.6023178460578 \tabularnewline
54 & 555 & 543.39591205311 & 11.6040879468902 \tabularnewline
55 & 565 & 570.672260350964 & -5.67226035096371 \tabularnewline
56 & 542 & 557.466582187049 & -15.4665821870493 \tabularnewline
57 & 527 & 520.465620416788 & 6.53437958321229 \tabularnewline
58 & 510 & 501.503583216902 & 8.49641678309837 \tabularnewline
59 & 514 & 509.963790505804 & 4.03620949419621 \tabularnewline
60 & 517 & 515.264205805959 & 1.73579419404120 \tabularnewline
61 & 508 & 511.549850206385 & -3.54985020638537 \tabularnewline
62 & 493 & 495.540087370842 & -2.54008737084217 \tabularnewline
63 & 490 & 475.923398468675 & 14.0766015313247 \tabularnewline
64 & 469 & 476.078890784724 & -7.07889078472442 \tabularnewline
65 & 478 & 467.647305696880 & 10.3526943031205 \tabularnewline
66 & 528 & 524.975509797849 & 3.02449020215101 \tabularnewline
67 & 534 & 544.914861835572 & -10.9148618355715 \tabularnewline
68 & 518 & 527.274972356671 & -9.27497235667124 \tabularnewline
69 & 506 & 498.732383054772 & 7.26761694522787 \tabularnewline
70 & 502 & 482.306906565759 & 19.6930934342413 \tabularnewline
71 & 516 & 504.393716708211 & 11.6062832917889 \tabularnewline
72 & 528 & 520.761824138634 & 7.23817586136613 \tabularnewline
\hline
\end{tabular}
%Source: https://freestatistics.org/blog/index.php?pk=41714&T=2

[TABLE]
[ROW][C]Interpolation Forecasts of Exponential Smoothing[/C][/ROW]
[ROW][C]t[/C][C]Observed[/C][C]Fitted[/C][C]Residuals[/C][/ROW]
[ROW][C]13[/C][C]561[/C][C]544.081463675214[/C][C]16.9185363247861[/C][/ROW]
[ROW][C]14[/C][C]555[/C][C]556.558129119468[/C][C]-1.55812911946839[/C][/ROW]
[ROW][C]15[/C][C]544[/C][C]545.449695031399[/C][C]-1.4496950313993[/C][/ROW]
[ROW][C]16[/C][C]537[/C][C]537.782654787202[/C][C]-0.782654787201523[/C][/ROW]
[ROW][C]17[/C][C]543[/C][C]543.919692602988[/C][C]-0.919692602988107[/C][/ROW]
[ROW][C]18[/C][C]594[/C][C]595.571427479194[/C][C]-1.57142747919352[/C][/ROW]
[ROW][C]19[/C][C]611[/C][C]618.669161100307[/C][C]-7.66916110030672[/C][/ROW]
[ROW][C]20[/C][C]613[/C][C]608.951918828219[/C][C]4.04808117178140[/C][/ROW]
[ROW][C]21[/C][C]611[/C][C]600.343345630332[/C][C]10.656654369668[/C][/ROW]
[ROW][C]22[/C][C]594[/C][C]594.668995751822[/C][C]-0.66899575182174[/C][/ROW]
[ROW][C]23[/C][C]595[/C][C]603.97613229179[/C][C]-8.97613229178955[/C][/ROW]
[ROW][C]24[/C][C]591[/C][C]603.736338194922[/C][C]-12.7363381949217[/C][/ROW]
[ROW][C]25[/C][C]589[/C][C]591.286979743087[/C][C]-2.28697974308682[/C][/ROW]
[ROW][C]26[/C][C]584[/C][C]581.896853567659[/C][C]2.10314643234096[/C][/ROW]
[ROW][C]27[/C][C]573[/C][C]572.039735262059[/C][C]0.960264737940975[/C][/ROW]
[ROW][C]28[/C][C]567[/C][C]564.711393167011[/C][C]2.28860683298876[/C][/ROW]
[ROW][C]29[/C][C]569[/C][C]572.13885326425[/C][C]-3.13885326425054[/C][/ROW]
[ROW][C]30[/C][C]621[/C][C]619.719896630727[/C][C]1.28010336927298[/C][/ROW]
[ROW][C]31[/C][C]629[/C][C]643.744482744384[/C][C]-14.7444827443841[/C][/ROW]
[ROW][C]32[/C][C]628[/C][C]625.27041410104[/C][C]2.72958589895984[/C][/ROW]
[ROW][C]33[/C][C]612[/C][C]613.106823292582[/C][C]-1.10682329258202[/C][/ROW]
[ROW][C]34[/C][C]595[/C][C]591.829589807564[/C][C]3.17041019243618[/C][/ROW]
[ROW][C]35[/C][C]597[/C][C]601.09722913439[/C][C]-4.09722913438941[/C][/ROW]
[ROW][C]36[/C][C]593[/C][C]602.537254045668[/C][C]-9.53725404566762[/C][/ROW]
[ROW][C]37[/C][C]590[/C][C]591.042423120945[/C][C]-1.04242312094493[/C][/ROW]
[ROW][C]38[/C][C]580[/C][C]580.638541430146[/C][C]-0.638541430146006[/C][/ROW]
[ROW][C]39[/C][C]574[/C][C]565.415282987133[/C][C]8.5847170128668[/C][/ROW]
[ROW][C]40[/C][C]573[/C][C]563.648539800356[/C][C]9.35146019964384[/C][/ROW]
[ROW][C]41[/C][C]573[/C][C]576.638133569976[/C][C]-3.63813356997639[/C][/ROW]
[ROW][C]42[/C][C]620[/C][C]622.814794422308[/C][C]-2.81479442230830[/C][/ROW]
[ROW][C]43[/C][C]626[/C][C]640.748255682119[/C][C]-14.7482556821191[/C][/ROW]
[ROW][C]44[/C][C]620[/C][C]621.374734321672[/C][C]-1.37473432167224[/C][/ROW]
[ROW][C]45[/C][C]588[/C][C]603.105406445297[/C][C]-15.1054064452967[/C][/ROW]
[ROW][C]46[/C][C]566[/C][C]564.928582532826[/C][C]1.07141746717400[/C][/ROW]
[ROW][C]47[/C][C]557[/C][C]568.082520856144[/C][C]-11.0825208561444[/C][/ROW]
[ROW][C]48[/C][C]561[/C][C]557.988589018299[/C][C]3.01141098170058[/C][/ROW]
[ROW][C]49[/C][C]549[/C][C]555.694908836947[/C][C]-6.69490883694652[/C][/ROW]
[ROW][C]50[/C][C]532[/C][C]536.034061557883[/C][C]-4.03406155788343[/C][/ROW]
[ROW][C]51[/C][C]526[/C][C]513.674751162263[/C][C]12.3252488377366[/C][/ROW]
[ROW][C]52[/C][C]511[/C][C]511.744772780309[/C][C]-0.744772780308608[/C][/ROW]
[ROW][C]53[/C][C]499[/C][C]509.602317846058[/C][C]-10.6023178460578[/C][/ROW]
[ROW][C]54[/C][C]555[/C][C]543.39591205311[/C][C]11.6040879468902[/C][/ROW]
[ROW][C]55[/C][C]565[/C][C]570.672260350964[/C][C]-5.67226035096371[/C][/ROW]
[ROW][C]56[/C][C]542[/C][C]557.466582187049[/C][C]-15.4665821870493[/C][/ROW]
[ROW][C]57[/C][C]527[/C][C]520.465620416788[/C][C]6.53437958321229[/C][/ROW]
[ROW][C]58[/C][C]510[/C][C]501.503583216902[/C][C]8.49641678309837[/C][/ROW]
[ROW][C]59[/C][C]514[/C][C]509.963790505804[/C][C]4.03620949419621[/C][/ROW]
[ROW][C]60[/C][C]517[/C][C]515.264205805959[/C][C]1.73579419404120[/C][/ROW]
[ROW][C]61[/C][C]508[/C][C]511.549850206385[/C][C]-3.54985020638537[/C][/ROW]
[ROW][C]62[/C][C]493[/C][C]495.540087370842[/C][C]-2.54008737084217[/C][/ROW]
[ROW][C]63[/C][C]490[/C][C]475.923398468675[/C][C]14.0766015313247[/C][/ROW]
[ROW][C]64[/C][C]469[/C][C]476.078890784724[/C][C]-7.07889078472442[/C][/ROW]
[ROW][C]65[/C][C]478[/C][C]467.647305696880[/C][C]10.3526943031205[/C][/ROW]
[ROW][C]66[/C][C]528[/C][C]524.975509797849[/C][C]3.02449020215101[/C][/ROW]
[ROW][C]67[/C][C]534[/C][C]544.914861835572[/C][C]-10.9148618355715[/C][/ROW]
[ROW][C]68[/C][C]518[/C][C]527.274972356671[/C][C]-9.27497235667124[/C][/ROW]
[ROW][C]69[/C][C]506[/C][C]498.732383054772[/C][C]7.26761694522787[/C][/ROW]
[ROW][C]70[/C][C]502[/C][C]482.306906565759[/C][C]19.6930934342413[/C][/ROW]
[ROW][C]71[/C][C]516[/C][C]504.393716708211[/C][C]11.6062832917889[/C][/ROW]
[ROW][C]72[/C][C]528[/C][C]520.761824138634[/C][C]7.23817586136613[/C][/ROW]
[/TABLE]
Source: https://freestatistics.org/blog/index.php?pk=41714&T=2

Globally Unique Identifier (entire table): ba.freestatistics.org/blog/index.php?pk=41714&T=2

As an alternative you can also use a QR Code:  

The GUIDs for individual cells are displayed in the table below:

Interpolation Forecasts of Exponential Smoothing
tObservedFittedResiduals
13561544.08146367521416.9185363247861
14555556.558129119468-1.55812911946839
15544545.449695031399-1.4496950313993
16537537.782654787202-0.782654787201523
17543543.919692602988-0.919692602988107
18594595.571427479194-1.57142747919352
19611618.669161100307-7.66916110030672
20613608.9519188282194.04808117178140
21611600.34334563033210.656654369668
22594594.668995751822-0.66899575182174
23595603.97613229179-8.97613229178955
24591603.736338194922-12.7363381949217
25589591.286979743087-2.28697974308682
26584581.8968535676592.10314643234096
27573572.0397352620590.960264737940975
28567564.7113931670112.28860683298876
29569572.13885326425-3.13885326425054
30621619.7198966307271.28010336927298
31629643.744482744384-14.7444827443841
32628625.270414101042.72958589895984
33612613.106823292582-1.10682329258202
34595591.8295898075643.17041019243618
35597601.09722913439-4.09722913438941
36593602.537254045668-9.53725404566762
37590591.042423120945-1.04242312094493
38580580.638541430146-0.638541430146006
39574565.4152829871338.5847170128668
40573563.6485398003569.35146019964384
41573576.638133569976-3.63813356997639
42620622.814794422308-2.81479442230830
43626640.748255682119-14.7482556821191
44620621.374734321672-1.37473432167224
45588603.105406445297-15.1054064452967
46566564.9285825328261.07141746717400
47557568.082520856144-11.0825208561444
48561557.9885890182993.01141098170058
49549555.694908836947-6.69490883694652
50532536.034061557883-4.03406155788343
51526513.67475116226312.3252488377366
52511511.744772780309-0.744772780308608
53499509.602317846058-10.6023178460578
54555543.3959120531111.6040879468902
55565570.672260350964-5.67226035096371
56542557.466582187049-15.4665821870493
57527520.4656204167886.53437958321229
58510501.5035832169028.49641678309837
59514509.9637905058044.03620949419621
60517515.2642058059591.73579419404120
61508511.549850206385-3.54985020638537
62493495.540087370842-2.54008737084217
63490475.92339846867514.0766015313247
64469476.078890784724-7.07889078472442
65478467.64730569688010.3526943031205
66528524.9755097978493.02449020215101
67534544.914861835572-10.9148618355715
68518527.274972356671-9.27497235667124
69506498.7323830547727.26761694522787
70502482.30690656575919.6930934342413
71516504.39371670821111.6062832917889
72528520.7618241386347.23817586136613


Extrapolation Forecasts of Exponential Smoothing
tForecast95% Lower Bound95% Upper Bound
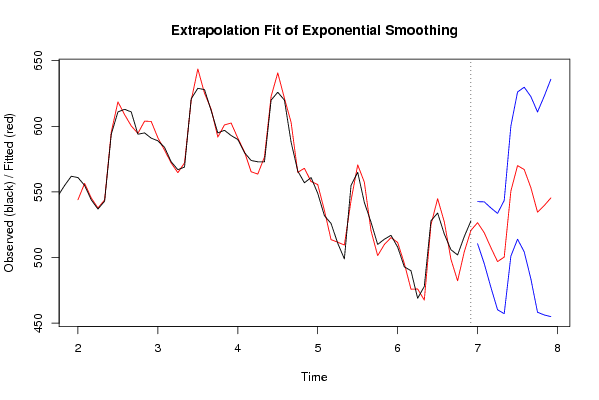
73526.631717651185510.611639755492542.651795546878
74518.961550934514495.440965593726542.482136275303
75507.582364900449477.332248940955537.832480859944
76496.984093874623460.259644967862533.708542781384
77500.40268661038457.268566242008543.536806978753
78550.71123483899501.141500098332600.280969579649
79570.097242235192514.017018949475626.177465520909
80567.131848422131504.437842537551629.825854306711
81553.285924029266483.857637993591622.71421006494
82534.662658138819458.368985156615610.956331121023
83539.609466907692456.312775562834622.90615825255
84545.456022240819455.014786253802635.897258227836

\begin{tabular}{lllllllll}
\hline
Extrapolation Forecasts of Exponential Smoothing \tabularnewline
t & Forecast & 95% Lower Bound & 95% Upper Bound \tabularnewline
73 & 526.631717651185 & 510.611639755492 & 542.651795546878 \tabularnewline
74 & 518.961550934514 & 495.440965593726 & 542.482136275303 \tabularnewline
75 & 507.582364900449 & 477.332248940955 & 537.832480859944 \tabularnewline
76 & 496.984093874623 & 460.259644967862 & 533.708542781384 \tabularnewline
77 & 500.40268661038 & 457.268566242008 & 543.536806978753 \tabularnewline
78 & 550.71123483899 & 501.141500098332 & 600.280969579649 \tabularnewline
79 & 570.097242235192 & 514.017018949475 & 626.177465520909 \tabularnewline
80 & 567.131848422131 & 504.437842537551 & 629.825854306711 \tabularnewline
81 & 553.285924029266 & 483.857637993591 & 622.71421006494 \tabularnewline
82 & 534.662658138819 & 458.368985156615 & 610.956331121023 \tabularnewline
83 & 539.609466907692 & 456.312775562834 & 622.90615825255 \tabularnewline
84 & 545.456022240819 & 455.014786253802 & 635.897258227836 \tabularnewline
\hline
\end{tabular}
%Source: https://freestatistics.org/blog/index.php?pk=41714&T=3

[TABLE]
[ROW][C]Extrapolation Forecasts of Exponential Smoothing[/C][/ROW]
[ROW][C]t[/C][C]Forecast[/C][C]95% Lower Bound[/C][C]95% Upper Bound[/C][/ROW]
[ROW][C]73[/C][C]526.631717651185[/C][C]510.611639755492[/C][C]542.651795546878[/C][/ROW]
[ROW][C]74[/C][C]518.961550934514[/C][C]495.440965593726[/C][C]542.482136275303[/C][/ROW]
[ROW][C]75[/C][C]507.582364900449[/C][C]477.332248940955[/C][C]537.832480859944[/C][/ROW]
[ROW][C]76[/C][C]496.984093874623[/C][C]460.259644967862[/C][C]533.708542781384[/C][/ROW]
[ROW][C]77[/C][C]500.40268661038[/C][C]457.268566242008[/C][C]543.536806978753[/C][/ROW]
[ROW][C]78[/C][C]550.71123483899[/C][C]501.141500098332[/C][C]600.280969579649[/C][/ROW]
[ROW][C]79[/C][C]570.097242235192[/C][C]514.017018949475[/C][C]626.177465520909[/C][/ROW]
[ROW][C]80[/C][C]567.131848422131[/C][C]504.437842537551[/C][C]629.825854306711[/C][/ROW]
[ROW][C]81[/C][C]553.285924029266[/C][C]483.857637993591[/C][C]622.71421006494[/C][/ROW]
[ROW][C]82[/C][C]534.662658138819[/C][C]458.368985156615[/C][C]610.956331121023[/C][/ROW]
[ROW][C]83[/C][C]539.609466907692[/C][C]456.312775562834[/C][C]622.90615825255[/C][/ROW]
[ROW][C]84[/C][C]545.456022240819[/C][C]455.014786253802[/C][C]635.897258227836[/C][/ROW]
[/TABLE]
Source: https://freestatistics.org/blog/index.php?pk=41714&T=3

Globally Unique Identifier (entire table): ba.freestatistics.org/blog/index.php?pk=41714&T=3

As an alternative you can also use a QR Code:  

The GUIDs for individual cells are displayed in the table below:

Extrapolation Forecasts of Exponential Smoothing
tForecast95% Lower Bound95% Upper Bound
73526.631717651185510.611639755492542.651795546878
74518.961550934514495.440965593726542.482136275303
75507.582364900449477.332248940955537.832480859944
76496.984093874623460.259644967862533.708542781384
77500.40268661038457.268566242008543.536806978753
78550.71123483899501.141500098332600.280969579649
79570.097242235192514.017018949475626.177465520909
80567.131848422131504.437842537551629.825854306711
81553.285924029266483.857637993591622.71421006494
82534.662658138819458.368985156615610.956331121023
83539.609466907692456.312775562834622.90615825255
84545.456022240819455.014786253802635.897258227836


Parameters (Session):
par1 = 12 ; par2 = Triple ; par3 = additive ;
Parameters (R input):
par1 = 12 ; par2 = Triple ; par3 = additive ;
R code (references can be found in the software module):
par1 <- as.numeric(par1)
if (par2 == 'Single') K <- 1
if (par2 == 'Double') K <- 2
if (par2 == 'Triple') K <- par1
nx <- length(x)
nxmK <- nx - K
x <- ts(x, frequency = par1)
if (par2 == 'Single') fit <- HoltWinters(x, gamma=0, beta=0)
if (par2 == 'Double') fit <- HoltWinters(x, gamma=0)
if (par2 == 'Triple') fit <- HoltWinters(x, seasonal=par3)
fit
myresid <- x - fit$fitted[,'xhat']
bitmap(file='test1.png')
op <- par(mfrow=c(2,1))
plot(fit,ylab='Observed (black) / Fitted (red)',main='Interpolation Fit of Exponential Smoothing')
plot(myresid,ylab='Residuals',main='Interpolation Prediction Errors')
par(op)
dev.off()
bitmap(file='test2.png')
p <- predict(fit, par1, prediction.interval=TRUE)
np <- length(p[,1])
plot(fit,p,ylab='Observed (black) / Fitted (red)',main='Extrapolation Fit of Exponential Smoothing')
dev.off()
bitmap(file='test3.png')
op <- par(mfrow = c(2,2))
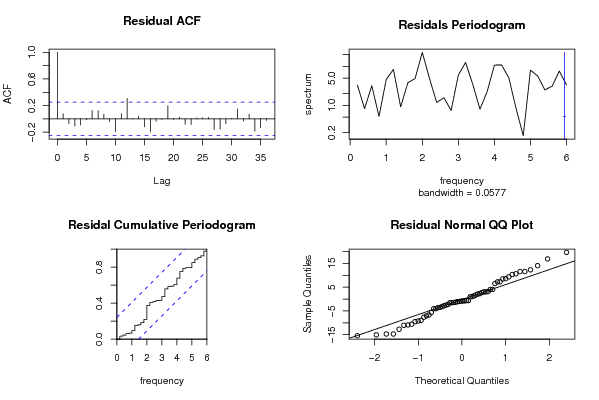
acf(as.numeric(myresid),lag.max = nx/2,main='Residual ACF')
spectrum(myresid,main='Residals Periodogram')
cpgram(myresid,main='Residal Cumulative Periodogram')
qqnorm(myresid,main='Residual Normal QQ Plot')
qqline(myresid)
par(op)
dev.off()
load(file='createtable')
a<-table.start()
a<-table.row.start(a)
a<-table.element(a,'Estimated Parameters of Exponential Smoothing',2,TRUE)
a<-table.row.end(a)
a<-table.row.start(a)
a<-table.element(a,'Parameter',header=TRUE)
a<-table.element(a,'Value',header=TRUE)
a<-table.row.end(a)
a<-table.row.start(a)
a<-table.element(a,'alpha',header=TRUE)
a<-table.element(a,fit$alpha)
a<-table.row.end(a)
a<-table.row.start(a)
a<-table.element(a,'beta',header=TRUE)
a<-table.element(a,fit$beta)
a<-table.row.end(a)
a<-table.row.start(a)
a<-table.element(a,'gamma',header=TRUE)
a<-table.element(a,fit$gamma)
a<-table.row.end(a)
a<-table.end(a)
table.save(a,file='mytable.tab')
a<-table.start()
a<-table.row.start(a)
a<-table.element(a,'Interpolation Forecasts of Exponential Smoothing',4,TRUE)
a<-table.row.end(a)
a<-table.row.start(a)
a<-table.element(a,'t',header=TRUE)
a<-table.element(a,'Observed',header=TRUE)
a<-table.element(a,'Fitted',header=TRUE)
a<-table.element(a,'Residuals',header=TRUE)
a<-table.row.end(a)
for (i in 1:nxmK) {
a<-table.row.start(a)
a<-table.element(a,i+K,header=TRUE)
a<-table.element(a,x[i+K])
a<-table.element(a,fit$fitted[i,'xhat'])
a<-table.element(a,myresid[i])
a<-table.row.end(a)
}
a<-table.end(a)
table.save(a,file='mytable1.tab')
a<-table.start()
a<-table.row.start(a)
a<-table.element(a,'Extrapolation Forecasts of Exponential Smoothing',4,TRUE)
a<-table.row.end(a)
a<-table.row.start(a)
a<-table.element(a,'t',header=TRUE)
a<-table.element(a,'Forecast',header=TRUE)
a<-table.element(a,'95% Lower Bound',header=TRUE)
a<-table.element(a,'95% Upper Bound',header=TRUE)
a<-table.row.end(a)
for (i in 1:np) {
a<-table.row.start(a)
a<-table.element(a,nx+i,header=TRUE)
a<-table.element(a,p[i,'fit'])
a<-table.element(a,p[i,'lwr'])
a<-table.element(a,p[i,'upr'])
a<-table.row.end(a)
}
a<-table.end(a)
table.save(a,file='mytable2.tab')