Free Statistics

of Irreproducible Research!

Author's title

Author*Unverified author*
R Software Modulerwasp_smp.wasp
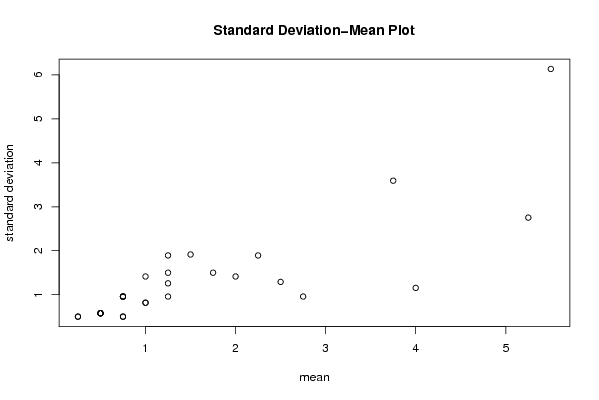
Title produced by softwareStandard Deviation-Mean Plot
Date of computationThu, 04 Jun 2009 09:00:35 -0600
Cite this page as followsStatistical Computations at FreeStatistics.org, Office for Research Development and Education, URL https://freestatistics.org/blog/index.php?v=date/2009/Jun/04/t1244127696lx5ts4w7n4oqt90.htm/, Retrieved Tue, 14 May 2024 04:07:17 +0000
Statistical Computations at FreeStatistics.org, Office for Research Development and Education, URL https://freestatistics.org/blog/index.php?pk=41702, Retrieved Tue, 14 May 2024 04:07:17 +0000
QR Codes:

Original text written by user:
IsPrivate?No (this computation is public)
User-defined keywords
Estimated Impact104
Family? (F = Feedback message, R = changed R code, M = changed R Module, P = changed Parameters, D = changed Data)
-       [Standard Deviation-Mean Plot] [] [2009-06-04 15:00:35] [afa535f11cc604bf03d1c5bec84d96a0] [Current]
Feedback Forum

Post a new message
Dataseries X:
0
1
0
0
1
3
9
2
3
5
3
5
2
2
0
1
0
1
3
3
2
1
1
5
0
3
1
0
1
4
0
0
1
6
14
1
1
0
0
1
1
1
1
0
1
0
1
0
1
0
1
0
1
0
1
0
1
0
0
2
0
1
0
1
0
0
1
2
0
0
1
2
0
3
1
1
0
2
0
4
0
2
1
1
1
1
0
1
1
0
2
1
3
1
2
4
0
0
0
1
0
1
0
2
2
4
2
3
3
0
0
2
7
8
2
4
1
1
2
4


Summary of computational transaction
Raw Inputview raw input (R code)
Raw Outputview raw output of R engine
Computing time1 seconds
R Server'George Udny Yule' @ 72.249.76.132

\begin{tabular}{lllllllll}
\hline
Summary of computational transaction \tabularnewline
Raw Input & view raw input (R code)  \tabularnewline
Raw Output & view raw output of R engine  \tabularnewline
Computing time & 1 seconds \tabularnewline
R Server & 'George Udny Yule' @ 72.249.76.132 \tabularnewline
\hline
\end{tabular}
%Source: https://freestatistics.org/blog/index.php?pk=41702&T=0

[TABLE]
[ROW][C]Summary of computational transaction[/C][/ROW]
[ROW][C]Raw Input[/C][C]view raw input (R code) [/C][/ROW]
[ROW][C]Raw Output[/C][C]view raw output of R engine [/C][/ROW]
[ROW][C]Computing time[/C][C]1 seconds[/C][/ROW]
[ROW][C]R Server[/C][C]'George Udny Yule' @ 72.249.76.132[/C][/ROW]
[/TABLE]
Source: https://freestatistics.org/blog/index.php?pk=41702&T=0

Globally Unique Identifier (entire table): ba.freestatistics.org/blog/index.php?pk=41702&T=0

As an alternative you can also use a QR Code:  

The GUIDs for individual cells are displayed in the table below:

Summary of computational transaction
Raw Inputview raw input (R code)
Raw Outputview raw output of R engine
Computing time1 seconds
R Server'George Udny Yule' @ 72.249.76.132


Standard Deviation-Mean Plot
SectionMeanStandard DeviationRange
10.250.51
23.753.593976442141308
341.154700538379252
41.250.9574271077563382
51.751.53
62.251.892969448600094
711.414213562373103
81.251.892969448600094
95.56.1373175465073213
100.50.5773502691896261
110.750.51
120.50.5773502691896261
130.50.5773502691896261
140.50.5773502691896261
150.750.9574271077563382
160.50.5773502691896261
170.750.9574271077563382
180.750.9574271077563382
191.251.258305739211793
201.51.914854215512684
2110.8164965809277262
220.750.51
2310.8164965809277262
242.51.290994448735813
250.250.51
260.750.9574271077563382
272.750.9574271077563382
281.251.53
295.252.753785273643056
3021.414213562373103

\begin{tabular}{lllllllll}
\hline
Standard Deviation-Mean Plot \tabularnewline
Section & Mean & Standard Deviation & Range \tabularnewline
1 & 0.25 & 0.5 & 1 \tabularnewline
2 & 3.75 & 3.59397644214130 & 8 \tabularnewline
3 & 4 & 1.15470053837925 & 2 \tabularnewline
4 & 1.25 & 0.957427107756338 & 2 \tabularnewline
5 & 1.75 & 1.5 & 3 \tabularnewline
6 & 2.25 & 1.89296944860009 & 4 \tabularnewline
7 & 1 & 1.41421356237310 & 3 \tabularnewline
8 & 1.25 & 1.89296944860009 & 4 \tabularnewline
9 & 5.5 & 6.13731754650732 & 13 \tabularnewline
10 & 0.5 & 0.577350269189626 & 1 \tabularnewline
11 & 0.75 & 0.5 & 1 \tabularnewline
12 & 0.5 & 0.577350269189626 & 1 \tabularnewline
13 & 0.5 & 0.577350269189626 & 1 \tabularnewline
14 & 0.5 & 0.577350269189626 & 1 \tabularnewline
15 & 0.75 & 0.957427107756338 & 2 \tabularnewline
16 & 0.5 & 0.577350269189626 & 1 \tabularnewline
17 & 0.75 & 0.957427107756338 & 2 \tabularnewline
18 & 0.75 & 0.957427107756338 & 2 \tabularnewline
19 & 1.25 & 1.25830573921179 & 3 \tabularnewline
20 & 1.5 & 1.91485421551268 & 4 \tabularnewline
21 & 1 & 0.816496580927726 & 2 \tabularnewline
22 & 0.75 & 0.5 & 1 \tabularnewline
23 & 1 & 0.816496580927726 & 2 \tabularnewline
24 & 2.5 & 1.29099444873581 & 3 \tabularnewline
25 & 0.25 & 0.5 & 1 \tabularnewline
26 & 0.75 & 0.957427107756338 & 2 \tabularnewline
27 & 2.75 & 0.957427107756338 & 2 \tabularnewline
28 & 1.25 & 1.5 & 3 \tabularnewline
29 & 5.25 & 2.75378527364305 & 6 \tabularnewline
30 & 2 & 1.41421356237310 & 3 \tabularnewline
\hline
\end{tabular}
%Source: https://freestatistics.org/blog/index.php?pk=41702&T=1

[TABLE]
[ROW][C]Standard Deviation-Mean Plot[/C][/ROW]
[ROW][C]Section[/C][C]Mean[/C][C]Standard Deviation[/C][C]Range[/C][/ROW]
[ROW][C]1[/C][C]0.25[/C][C]0.5[/C][C]1[/C][/ROW]
[ROW][C]2[/C][C]3.75[/C][C]3.59397644214130[/C][C]8[/C][/ROW]
[ROW][C]3[/C][C]4[/C][C]1.15470053837925[/C][C]2[/C][/ROW]
[ROW][C]4[/C][C]1.25[/C][C]0.957427107756338[/C][C]2[/C][/ROW]
[ROW][C]5[/C][C]1.75[/C][C]1.5[/C][C]3[/C][/ROW]
[ROW][C]6[/C][C]2.25[/C][C]1.89296944860009[/C][C]4[/C][/ROW]
[ROW][C]7[/C][C]1[/C][C]1.41421356237310[/C][C]3[/C][/ROW]
[ROW][C]8[/C][C]1.25[/C][C]1.89296944860009[/C][C]4[/C][/ROW]
[ROW][C]9[/C][C]5.5[/C][C]6.13731754650732[/C][C]13[/C][/ROW]
[ROW][C]10[/C][C]0.5[/C][C]0.577350269189626[/C][C]1[/C][/ROW]
[ROW][C]11[/C][C]0.75[/C][C]0.5[/C][C]1[/C][/ROW]
[ROW][C]12[/C][C]0.5[/C][C]0.577350269189626[/C][C]1[/C][/ROW]
[ROW][C]13[/C][C]0.5[/C][C]0.577350269189626[/C][C]1[/C][/ROW]
[ROW][C]14[/C][C]0.5[/C][C]0.577350269189626[/C][C]1[/C][/ROW]
[ROW][C]15[/C][C]0.75[/C][C]0.957427107756338[/C][C]2[/C][/ROW]
[ROW][C]16[/C][C]0.5[/C][C]0.577350269189626[/C][C]1[/C][/ROW]
[ROW][C]17[/C][C]0.75[/C][C]0.957427107756338[/C][C]2[/C][/ROW]
[ROW][C]18[/C][C]0.75[/C][C]0.957427107756338[/C][C]2[/C][/ROW]
[ROW][C]19[/C][C]1.25[/C][C]1.25830573921179[/C][C]3[/C][/ROW]
[ROW][C]20[/C][C]1.5[/C][C]1.91485421551268[/C][C]4[/C][/ROW]
[ROW][C]21[/C][C]1[/C][C]0.816496580927726[/C][C]2[/C][/ROW]
[ROW][C]22[/C][C]0.75[/C][C]0.5[/C][C]1[/C][/ROW]
[ROW][C]23[/C][C]1[/C][C]0.816496580927726[/C][C]2[/C][/ROW]
[ROW][C]24[/C][C]2.5[/C][C]1.29099444873581[/C][C]3[/C][/ROW]
[ROW][C]25[/C][C]0.25[/C][C]0.5[/C][C]1[/C][/ROW]
[ROW][C]26[/C][C]0.75[/C][C]0.957427107756338[/C][C]2[/C][/ROW]
[ROW][C]27[/C][C]2.75[/C][C]0.957427107756338[/C][C]2[/C][/ROW]
[ROW][C]28[/C][C]1.25[/C][C]1.5[/C][C]3[/C][/ROW]
[ROW][C]29[/C][C]5.25[/C][C]2.75378527364305[/C][C]6[/C][/ROW]
[ROW][C]30[/C][C]2[/C][C]1.41421356237310[/C][C]3[/C][/ROW]
[/TABLE]
Source: https://freestatistics.org/blog/index.php?pk=41702&T=1

Globally Unique Identifier (entire table): ba.freestatistics.org/blog/index.php?pk=41702&T=1

As an alternative you can also use a QR Code:  

The GUIDs for individual cells are displayed in the table below:

Standard Deviation-Mean Plot
SectionMeanStandard DeviationRange
10.250.51
23.753.593976442141308
341.154700538379252
41.250.9574271077563382
51.751.53
62.251.892969448600094
711.414213562373103
81.251.892969448600094
95.56.1373175465073213
100.50.5773502691896261
110.750.51
120.50.5773502691896261
130.50.5773502691896261
140.50.5773502691896261
150.750.9574271077563382
160.50.5773502691896261
170.750.9574271077563382
180.750.9574271077563382
191.251.258305739211793
201.51.914854215512684
2110.8164965809277262
220.750.51
2310.8164965809277262
242.51.290994448735813
250.250.51
260.750.9574271077563382
272.750.9574271077563382
281.251.53
295.252.753785273643056
3021.414213562373103


Regression: S.E.(k) = alpha + beta * Mean(k)
alpha0.30254380690866
beta0.661097180174532
S.D.0.0910936679008484
T-STAT7.25733407610843
p-value6.69860658917639e-08

\begin{tabular}{lllllllll}
\hline
Regression: S.E.(k) = alpha + beta * Mean(k) \tabularnewline
alpha & 0.30254380690866 \tabularnewline
beta & 0.661097180174532 \tabularnewline
S.D. & 0.0910936679008484 \tabularnewline
T-STAT & 7.25733407610843 \tabularnewline
p-value & 6.69860658917639e-08 \tabularnewline
\hline
\end{tabular}
%Source: https://freestatistics.org/blog/index.php?pk=41702&T=2

[TABLE]
[ROW][C]Regression: S.E.(k) = alpha + beta * Mean(k)[/C][/ROW]
[ROW][C]alpha[/C][C]0.30254380690866[/C][/ROW]
[ROW][C]beta[/C][C]0.661097180174532[/C][/ROW]
[ROW][C]S.D.[/C][C]0.0910936679008484[/C][/ROW]
[ROW][C]T-STAT[/C][C]7.25733407610843[/C][/ROW]
[ROW][C]p-value[/C][C]6.69860658917639e-08[/C][/ROW]
[/TABLE]
Source: https://freestatistics.org/blog/index.php?pk=41702&T=2

Globally Unique Identifier (entire table): ba.freestatistics.org/blog/index.php?pk=41702&T=2

As an alternative you can also use a QR Code:  

The GUIDs for individual cells are displayed in the table below:

Regression: S.E.(k) = alpha + beta * Mean(k)
alpha0.30254380690866
beta0.661097180174532
S.D.0.0910936679008484
T-STAT7.25733407610843
p-value6.69860658917639e-08


Regression: ln S.E.(k) = alpha + beta * ln Mean(k)
alpha-0.00665747764028385
beta0.641817316635996
S.D.0.0782245665857472
T-STAT8.20480502033152
p-value6.24996228855981e-09
Lambda0.358182683364004

\begin{tabular}{lllllllll}
\hline
Regression: ln S.E.(k) = alpha + beta * ln Mean(k) \tabularnewline
alpha & -0.00665747764028385 \tabularnewline
beta & 0.641817316635996 \tabularnewline
S.D. & 0.0782245665857472 \tabularnewline
T-STAT & 8.20480502033152 \tabularnewline
p-value & 6.24996228855981e-09 \tabularnewline
Lambda & 0.358182683364004 \tabularnewline
\hline
\end{tabular}
%Source: https://freestatistics.org/blog/index.php?pk=41702&T=3

[TABLE]
[ROW][C]Regression: ln S.E.(k) = alpha + beta * ln Mean(k)[/C][/ROW]
[ROW][C]alpha[/C][C]-0.00665747764028385[/C][/ROW]
[ROW][C]beta[/C][C]0.641817316635996[/C][/ROW]
[ROW][C]S.D.[/C][C]0.0782245665857472[/C][/ROW]
[ROW][C]T-STAT[/C][C]8.20480502033152[/C][/ROW]
[ROW][C]p-value[/C][C]6.24996228855981e-09[/C][/ROW]
[ROW][C]Lambda[/C][C]0.358182683364004[/C][/ROW]
[/TABLE]
Source: https://freestatistics.org/blog/index.php?pk=41702&T=3

Globally Unique Identifier (entire table): ba.freestatistics.org/blog/index.php?pk=41702&T=3

As an alternative you can also use a QR Code:  

The GUIDs for individual cells are displayed in the table below:

Regression: ln S.E.(k) = alpha + beta * ln Mean(k)
alpha-0.00665747764028385
beta0.641817316635996
S.D.0.0782245665857472
T-STAT8.20480502033152
p-value6.24996228855981e-09
Lambda0.358182683364004


Parameters (Session):
par1 = 4 ;
Parameters (R input):
par1 = 4 ;
R code (references can be found in the software module):
par1 <- as.numeric(par1)
(n <- length(x))
(np <- floor(n / par1))
arr <- array(NA,dim=c(par1,np))
j <- 0
k <- 1
for (i in 1:(np*par1))
{
j = j + 1
arr[j,k] <- x[i]
if (j == par1) {
j = 0
k=k+1
}
}
arr
arr.mean <- array(NA,dim=np)
arr.sd <- array(NA,dim=np)
arr.range <- array(NA,dim=np)
for (j in 1:np)
{
arr.mean[j] <- mean(arr[,j],na.rm=TRUE)
arr.sd[j] <- sd(arr[,j],na.rm=TRUE)
arr.range[j] <- max(arr[,j],na.rm=TRUE) - min(arr[,j],na.rm=TRUE)
}
arr.mean
arr.sd
arr.range
(lm1 <- lm(arr.sd~arr.mean))
(lnlm1 <- lm(log(arr.sd)~log(arr.mean)))
(lm2 <- lm(arr.range~arr.mean))
bitmap(file='test1.png')
plot(arr.mean,arr.sd,main='Standard Deviation-Mean Plot',xlab='mean',ylab='standard deviation')
dev.off()
bitmap(file='test2.png')
plot(arr.mean,arr.range,main='Range-Mean Plot',xlab='mean',ylab='range')
dev.off()
load(file='createtable')
a<-table.start()
a<-table.row.start(a)
a<-table.element(a,'Standard Deviation-Mean Plot',4,TRUE)
a<-table.row.end(a)
a<-table.row.start(a)
a<-table.element(a,'Section',header=TRUE)
a<-table.element(a,'Mean',header=TRUE)
a<-table.element(a,'Standard Deviation',header=TRUE)
a<-table.element(a,'Range',header=TRUE)
a<-table.row.end(a)
for (j in 1:np) {
a<-table.row.start(a)
a<-table.element(a,j,header=TRUE)
a<-table.element(a,arr.mean[j])
a<-table.element(a,arr.sd[j] )
a<-table.element(a,arr.range[j] )
a<-table.row.end(a)
}
a<-table.end(a)
table.save(a,file='mytable.tab')
a<-table.start()
a<-table.row.start(a)
a<-table.element(a,'Regression: S.E.(k) = alpha + beta * Mean(k)',2,TRUE)
a<-table.row.end(a)
a<-table.row.start(a)
a<-table.element(a,'alpha',header=TRUE)
a<-table.element(a,lm1$coefficients[[1]])
a<-table.row.end(a)
a<-table.row.start(a)
a<-table.element(a,'beta',header=TRUE)
a<-table.element(a,lm1$coefficients[[2]])
a<-table.row.end(a)
a<-table.row.start(a)
a<-table.element(a,'S.D.',header=TRUE)
a<-table.element(a,summary(lm1)$coefficients[2,2])
a<-table.row.end(a)
a<-table.row.start(a)
a<-table.element(a,'T-STAT',header=TRUE)
a<-table.element(a,summary(lm1)$coefficients[2,3])
a<-table.row.end(a)
a<-table.row.start(a)
a<-table.element(a,'p-value',header=TRUE)
a<-table.element(a,summary(lm1)$coefficients[2,4])
a<-table.row.end(a)
a<-table.end(a)
table.save(a,file='mytable1.tab')
a<-table.start()
a<-table.row.start(a)
a<-table.element(a,'Regression: ln S.E.(k) = alpha + beta * ln Mean(k)',2,TRUE)
a<-table.row.end(a)
a<-table.row.start(a)
a<-table.element(a,'alpha',header=TRUE)
a<-table.element(a,lnlm1$coefficients[[1]])
a<-table.row.end(a)
a<-table.row.start(a)
a<-table.element(a,'beta',header=TRUE)
a<-table.element(a,lnlm1$coefficients[[2]])
a<-table.row.end(a)
a<-table.row.start(a)
a<-table.element(a,'S.D.',header=TRUE)
a<-table.element(a,summary(lnlm1)$coefficients[2,2])
a<-table.row.end(a)
a<-table.row.start(a)
a<-table.element(a,'T-STAT',header=TRUE)
a<-table.element(a,summary(lnlm1)$coefficients[2,3])
a<-table.row.end(a)
a<-table.row.start(a)
a<-table.element(a,'p-value',header=TRUE)
a<-table.element(a,summary(lnlm1)$coefficients[2,4])
a<-table.row.end(a)
a<-table.row.start(a)
a<-table.element(a,'Lambda',header=TRUE)
a<-table.element(a,1-lnlm1$coefficients[[2]])
a<-table.row.end(a)
a<-table.end(a)
table.save(a,file='mytable2.tab')