Free Statistics

of Irreproducible Research!

Author's title

Author*Unverified author*
R Software Modulerwasp_autocorrelation.wasp
Title produced by software(Partial) Autocorrelation Function
Date of computationThu, 04 Jun 2009 07:15:06 -0600
Cite this page as followsStatistical Computations at FreeStatistics.org, Office for Research Development and Education, URL https://freestatistics.org/blog/index.php?v=date/2009/Jun/04/t1244121487sqcnurr0x1nzkm7.htm/, Retrieved Tue, 14 May 2024 18:05:20 +0000
Statistical Computations at FreeStatistics.org, Office for Research Development and Education, URL https://freestatistics.org/blog/index.php?pk=41652, Retrieved Tue, 14 May 2024 18:05:20 +0000
QR Codes:

Original text written by user:
IsPrivate?No (this computation is public)
User-defined keywords
Estimated Impact101
Family? (F = Feedback message, R = changed R code, M = changed R Module, P = changed Parameters, D = changed Data)
-       [(Partial) Autocorrelation Function] [autocorrelation-t...] [2009-06-04 13:15:06] [16e291b2db388e9b7dc52bb84b5ee0ff] [Current]
Feedback Forum

Post a new message
Dataseries X:
106.8
114.3
105.7
90.1
91.6
97.7
100.8
104.6
95.9
102.7
104
107.9
113.8
113.8
123.1
125.1
137.6
134
140.3
152.1
150.6
167.3
153.2
142
154.4
158.5
180.9
181.3
172.4
192
199.3
215.4
214.3
201.5
190.5
196
215.7
209.4
214.1
237.8
239
237.8
251.5
248.8
215.4
201.2
203.1
214.2
188.9
203
213.3
228.5
228.2
240.9
258.8
248.5
269.2
289.6
323.4
317.2
322.8
340.9
368.2
388.5
441.2
474.3
483.9
417.9
365.9
263
199.4
157.2


Summary of computational transaction
Raw Inputview raw input (R code)
Raw Outputview raw output of R engine
Computing time2 seconds
R Server'Sir Ronald Aylmer Fisher' @ 193.190.124.24

\begin{tabular}{lllllllll}
\hline
Summary of computational transaction \tabularnewline
Raw Input & view raw input (R code)  \tabularnewline
Raw Output & view raw output of R engine  \tabularnewline
Computing time & 2 seconds \tabularnewline
R Server & 'Sir Ronald Aylmer Fisher' @ 193.190.124.24 \tabularnewline
\hline
\end{tabular}
%Source: https://freestatistics.org/blog/index.php?pk=41652&T=0

[TABLE]
[ROW][C]Summary of computational transaction[/C][/ROW]
[ROW][C]Raw Input[/C][C]view raw input (R code) [/C][/ROW]
[ROW][C]Raw Output[/C][C]view raw output of R engine [/C][/ROW]
[ROW][C]Computing time[/C][C]2 seconds[/C][/ROW]
[ROW][C]R Server[/C][C]'Sir Ronald Aylmer Fisher' @ 193.190.124.24[/C][/ROW]
[/TABLE]
Source: https://freestatistics.org/blog/index.php?pk=41652&T=0

Globally Unique Identifier (entire table): ba.freestatistics.org/blog/index.php?pk=41652&T=0

As an alternative you can also use a QR Code:  

The GUIDs for individual cells are displayed in the table below:

Summary of computational transaction
Raw Inputview raw input (R code)
Raw Outputview raw output of R engine
Computing time2 seconds
R Server'Sir Ronald Aylmer Fisher' @ 193.190.124.24


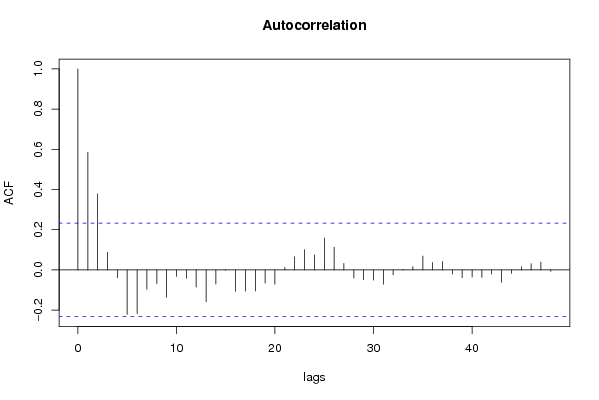
Autocorrelation Function
Time lag kACF(k)T-STATP-value
10.5848664.92823e-06
20.3777053.18260.001083
30.0872980.73560.232203
4-0.039371-0.33170.370529
5-0.220979-1.8620.033371
6-0.217458-1.83230.035548
7-0.096263-0.81110.210001
8-0.06822-0.57480.28361
9-0.135807-1.14430.128164
10-0.033276-0.28040.389997
11-0.041601-0.35050.363487
12-0.085471-0.72020.236885
13-0.158574-1.33620.092881
14-0.070641-0.59520.276789
15-0.001232-0.01040.495873
16-0.106559-0.89790.186142
17-0.104817-0.88320.190055
18-0.104445-0.88010.190896
19-0.064841-0.54640.293266
20-0.070951-0.59780.275922
210.0120430.10150.459731
220.0649120.5470.293061
230.1010630.85160.198657
240.0746530.6290.265673
250.1583161.3340.093234
260.1126020.94880.172971
270.031680.26690.395144
28-0.040864-0.34430.36581
29-0.049312-0.41550.33951
30-0.049975-0.42110.337477
31-0.070854-0.5970.276196
32-0.024224-0.20410.419424
330.0020460.01720.493145
340.0158070.13320.447208
350.068790.57960.281997
360.0365740.30820.379425
370.0423030.35640.361281
38-0.020802-0.17530.430679
39-0.038419-0.32370.373548
40-0.034996-0.29490.384471
41-0.036275-0.30570.380378
42-0.020204-0.17020.432653
43-0.061992-0.52240.301524
44-0.017388-0.14650.441964
450.0156520.13190.447723
460.0312370.26320.396577
470.0388550.32740.372166
48-0.006738-0.05680.477442

\begin{tabular}{lllllllll}
\hline
Autocorrelation Function \tabularnewline
Time lag k & ACF(k) & T-STAT & P-value \tabularnewline
1 & 0.584866 & 4.9282 & 3e-06 \tabularnewline
2 & 0.377705 & 3.1826 & 0.001083 \tabularnewline
3 & 0.087298 & 0.7356 & 0.232203 \tabularnewline
4 & -0.039371 & -0.3317 & 0.370529 \tabularnewline
5 & -0.220979 & -1.862 & 0.033371 \tabularnewline
6 & -0.217458 & -1.8323 & 0.035548 \tabularnewline
7 & -0.096263 & -0.8111 & 0.210001 \tabularnewline
8 & -0.06822 & -0.5748 & 0.28361 \tabularnewline
9 & -0.135807 & -1.1443 & 0.128164 \tabularnewline
10 & -0.033276 & -0.2804 & 0.389997 \tabularnewline
11 & -0.041601 & -0.3505 & 0.363487 \tabularnewline
12 & -0.085471 & -0.7202 & 0.236885 \tabularnewline
13 & -0.158574 & -1.3362 & 0.092881 \tabularnewline
14 & -0.070641 & -0.5952 & 0.276789 \tabularnewline
15 & -0.001232 & -0.0104 & 0.495873 \tabularnewline
16 & -0.106559 & -0.8979 & 0.186142 \tabularnewline
17 & -0.104817 & -0.8832 & 0.190055 \tabularnewline
18 & -0.104445 & -0.8801 & 0.190896 \tabularnewline
19 & -0.064841 & -0.5464 & 0.293266 \tabularnewline
20 & -0.070951 & -0.5978 & 0.275922 \tabularnewline
21 & 0.012043 & 0.1015 & 0.459731 \tabularnewline
22 & 0.064912 & 0.547 & 0.293061 \tabularnewline
23 & 0.101063 & 0.8516 & 0.198657 \tabularnewline
24 & 0.074653 & 0.629 & 0.265673 \tabularnewline
25 & 0.158316 & 1.334 & 0.093234 \tabularnewline
26 & 0.112602 & 0.9488 & 0.172971 \tabularnewline
27 & 0.03168 & 0.2669 & 0.395144 \tabularnewline
28 & -0.040864 & -0.3443 & 0.36581 \tabularnewline
29 & -0.049312 & -0.4155 & 0.33951 \tabularnewline
30 & -0.049975 & -0.4211 & 0.337477 \tabularnewline
31 & -0.070854 & -0.597 & 0.276196 \tabularnewline
32 & -0.024224 & -0.2041 & 0.419424 \tabularnewline
33 & 0.002046 & 0.0172 & 0.493145 \tabularnewline
34 & 0.015807 & 0.1332 & 0.447208 \tabularnewline
35 & 0.06879 & 0.5796 & 0.281997 \tabularnewline
36 & 0.036574 & 0.3082 & 0.379425 \tabularnewline
37 & 0.042303 & 0.3564 & 0.361281 \tabularnewline
38 & -0.020802 & -0.1753 & 0.430679 \tabularnewline
39 & -0.038419 & -0.3237 & 0.373548 \tabularnewline
40 & -0.034996 & -0.2949 & 0.384471 \tabularnewline
41 & -0.036275 & -0.3057 & 0.380378 \tabularnewline
42 & -0.020204 & -0.1702 & 0.432653 \tabularnewline
43 & -0.061992 & -0.5224 & 0.301524 \tabularnewline
44 & -0.017388 & -0.1465 & 0.441964 \tabularnewline
45 & 0.015652 & 0.1319 & 0.447723 \tabularnewline
46 & 0.031237 & 0.2632 & 0.396577 \tabularnewline
47 & 0.038855 & 0.3274 & 0.372166 \tabularnewline
48 & -0.006738 & -0.0568 & 0.477442 \tabularnewline
\hline
\end{tabular}
%Source: https://freestatistics.org/blog/index.php?pk=41652&T=1

[TABLE]
[ROW][C]Autocorrelation Function[/C][/ROW]
[ROW][C]Time lag k[/C][C]ACF(k)[/C][C]T-STAT[/C][C]P-value[/C][/ROW]
[ROW][C]1[/C][C]0.584866[/C][C]4.9282[/C][C]3e-06[/C][/ROW]
[ROW][C]2[/C][C]0.377705[/C][C]3.1826[/C][C]0.001083[/C][/ROW]
[ROW][C]3[/C][C]0.087298[/C][C]0.7356[/C][C]0.232203[/C][/ROW]
[ROW][C]4[/C][C]-0.039371[/C][C]-0.3317[/C][C]0.370529[/C][/ROW]
[ROW][C]5[/C][C]-0.220979[/C][C]-1.862[/C][C]0.033371[/C][/ROW]
[ROW][C]6[/C][C]-0.217458[/C][C]-1.8323[/C][C]0.035548[/C][/ROW]
[ROW][C]7[/C][C]-0.096263[/C][C]-0.8111[/C][C]0.210001[/C][/ROW]
[ROW][C]8[/C][C]-0.06822[/C][C]-0.5748[/C][C]0.28361[/C][/ROW]
[ROW][C]9[/C][C]-0.135807[/C][C]-1.1443[/C][C]0.128164[/C][/ROW]
[ROW][C]10[/C][C]-0.033276[/C][C]-0.2804[/C][C]0.389997[/C][/ROW]
[ROW][C]11[/C][C]-0.041601[/C][C]-0.3505[/C][C]0.363487[/C][/ROW]
[ROW][C]12[/C][C]-0.085471[/C][C]-0.7202[/C][C]0.236885[/C][/ROW]
[ROW][C]13[/C][C]-0.158574[/C][C]-1.3362[/C][C]0.092881[/C][/ROW]
[ROW][C]14[/C][C]-0.070641[/C][C]-0.5952[/C][C]0.276789[/C][/ROW]
[ROW][C]15[/C][C]-0.001232[/C][C]-0.0104[/C][C]0.495873[/C][/ROW]
[ROW][C]16[/C][C]-0.106559[/C][C]-0.8979[/C][C]0.186142[/C][/ROW]
[ROW][C]17[/C][C]-0.104817[/C][C]-0.8832[/C][C]0.190055[/C][/ROW]
[ROW][C]18[/C][C]-0.104445[/C][C]-0.8801[/C][C]0.190896[/C][/ROW]
[ROW][C]19[/C][C]-0.064841[/C][C]-0.5464[/C][C]0.293266[/C][/ROW]
[ROW][C]20[/C][C]-0.070951[/C][C]-0.5978[/C][C]0.275922[/C][/ROW]
[ROW][C]21[/C][C]0.012043[/C][C]0.1015[/C][C]0.459731[/C][/ROW]
[ROW][C]22[/C][C]0.064912[/C][C]0.547[/C][C]0.293061[/C][/ROW]
[ROW][C]23[/C][C]0.101063[/C][C]0.8516[/C][C]0.198657[/C][/ROW]
[ROW][C]24[/C][C]0.074653[/C][C]0.629[/C][C]0.265673[/C][/ROW]
[ROW][C]25[/C][C]0.158316[/C][C]1.334[/C][C]0.093234[/C][/ROW]
[ROW][C]26[/C][C]0.112602[/C][C]0.9488[/C][C]0.172971[/C][/ROW]
[ROW][C]27[/C][C]0.03168[/C][C]0.2669[/C][C]0.395144[/C][/ROW]
[ROW][C]28[/C][C]-0.040864[/C][C]-0.3443[/C][C]0.36581[/C][/ROW]
[ROW][C]29[/C][C]-0.049312[/C][C]-0.4155[/C][C]0.33951[/C][/ROW]
[ROW][C]30[/C][C]-0.049975[/C][C]-0.4211[/C][C]0.337477[/C][/ROW]
[ROW][C]31[/C][C]-0.070854[/C][C]-0.597[/C][C]0.276196[/C][/ROW]
[ROW][C]32[/C][C]-0.024224[/C][C]-0.2041[/C][C]0.419424[/C][/ROW]
[ROW][C]33[/C][C]0.002046[/C][C]0.0172[/C][C]0.493145[/C][/ROW]
[ROW][C]34[/C][C]0.015807[/C][C]0.1332[/C][C]0.447208[/C][/ROW]
[ROW][C]35[/C][C]0.06879[/C][C]0.5796[/C][C]0.281997[/C][/ROW]
[ROW][C]36[/C][C]0.036574[/C][C]0.3082[/C][C]0.379425[/C][/ROW]
[ROW][C]37[/C][C]0.042303[/C][C]0.3564[/C][C]0.361281[/C][/ROW]
[ROW][C]38[/C][C]-0.020802[/C][C]-0.1753[/C][C]0.430679[/C][/ROW]
[ROW][C]39[/C][C]-0.038419[/C][C]-0.3237[/C][C]0.373548[/C][/ROW]
[ROW][C]40[/C][C]-0.034996[/C][C]-0.2949[/C][C]0.384471[/C][/ROW]
[ROW][C]41[/C][C]-0.036275[/C][C]-0.3057[/C][C]0.380378[/C][/ROW]
[ROW][C]42[/C][C]-0.020204[/C][C]-0.1702[/C][C]0.432653[/C][/ROW]
[ROW][C]43[/C][C]-0.061992[/C][C]-0.5224[/C][C]0.301524[/C][/ROW]
[ROW][C]44[/C][C]-0.017388[/C][C]-0.1465[/C][C]0.441964[/C][/ROW]
[ROW][C]45[/C][C]0.015652[/C][C]0.1319[/C][C]0.447723[/C][/ROW]
[ROW][C]46[/C][C]0.031237[/C][C]0.2632[/C][C]0.396577[/C][/ROW]
[ROW][C]47[/C][C]0.038855[/C][C]0.3274[/C][C]0.372166[/C][/ROW]
[ROW][C]48[/C][C]-0.006738[/C][C]-0.0568[/C][C]0.477442[/C][/ROW]
[/TABLE]
Source: https://freestatistics.org/blog/index.php?pk=41652&T=1

Globally Unique Identifier (entire table): ba.freestatistics.org/blog/index.php?pk=41652&T=1

As an alternative you can also use a QR Code:  

The GUIDs for individual cells are displayed in the table below:

Autocorrelation Function
Time lag kACF(k)T-STATP-value
10.5848664.92823e-06
20.3777053.18260.001083
30.0872980.73560.232203
4-0.039371-0.33170.370529
5-0.220979-1.8620.033371
6-0.217458-1.83230.035548
7-0.096263-0.81110.210001
8-0.06822-0.57480.28361
9-0.135807-1.14430.128164
10-0.033276-0.28040.389997
11-0.041601-0.35050.363487
12-0.085471-0.72020.236885
13-0.158574-1.33620.092881
14-0.070641-0.59520.276789
15-0.001232-0.01040.495873
16-0.106559-0.89790.186142
17-0.104817-0.88320.190055
18-0.104445-0.88010.190896
19-0.064841-0.54640.293266
20-0.070951-0.59780.275922
210.0120430.10150.459731
220.0649120.5470.293061
230.1010630.85160.198657
240.0746530.6290.265673
250.1583161.3340.093234
260.1126020.94880.172971
270.031680.26690.395144
28-0.040864-0.34430.36581
29-0.049312-0.41550.33951
30-0.049975-0.42110.337477
31-0.070854-0.5970.276196
32-0.024224-0.20410.419424
330.0020460.01720.493145
340.0158070.13320.447208
350.068790.57960.281997
360.0365740.30820.379425
370.0423030.35640.361281
38-0.020802-0.17530.430679
39-0.038419-0.32370.373548
40-0.034996-0.29490.384471
41-0.036275-0.30570.380378
42-0.020204-0.17020.432653
43-0.061992-0.52240.301524
44-0.017388-0.14650.441964
450.0156520.13190.447723
460.0312370.26320.396577
470.0388550.32740.372166
48-0.006738-0.05680.477442


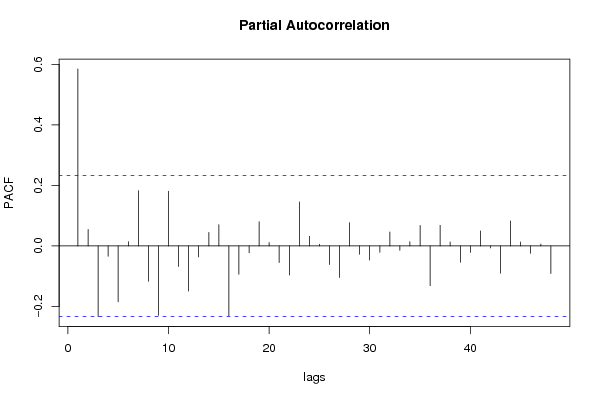
Partial Autocorrelation Function
Time lag kPACF(k)T-STATP-value
10.5848664.92823e-06
20.0541640.45640.32475
3-0.233723-1.96940.026406
4-0.034449-0.29030.386227
5-0.184881-1.55780.061859
60.0136030.11460.454535
70.1824091.5370.064369
8-0.116525-0.98190.164751
9-0.229639-1.9350.028489
100.1809061.52430.065933
11-0.068249-0.57510.283528
12-0.149091-1.25630.10657
13-0.036349-0.30630.380144
140.0446250.3760.354012
150.0701890.59140.278058
16-0.231032-1.94670.027763
17-0.093603-0.78870.216453
18-0.022749-0.19170.424268
190.0801240.67510.250892
200.011320.09540.462139
21-0.055037-0.46370.322123
22-0.096444-0.81260.209568
230.1451861.22340.112619
240.0316210.26640.395334
250.0053940.04540.481939
26-0.061692-0.51980.302401
27-0.104569-0.88110.190614
280.0769870.64870.259311
29-0.027887-0.2350.407451
30-0.046442-0.39130.348363
31-0.020786-0.17510.430732
320.0462760.38990.348877
33-0.014634-0.12330.451106
340.01390.11710.453547
350.0675710.56940.285453
36-0.131271-1.10610.136207
370.0680370.57330.284131
380.0129860.10940.456587
39-0.053875-0.4540.325621
40-0.021423-0.18050.428632
410.0492610.41510.339666
42-0.00661-0.05570.47787
43-0.090062-0.75890.22522
440.0822640.69320.245232
450.0133890.11280.455246
46-0.024247-0.20430.419347
470.006130.05160.479477
48-0.091025-0.7670.222815

\begin{tabular}{lllllllll}
\hline
Partial Autocorrelation Function \tabularnewline
Time lag k & PACF(k) & T-STAT & P-value \tabularnewline
1 & 0.584866 & 4.9282 & 3e-06 \tabularnewline
2 & 0.054164 & 0.4564 & 0.32475 \tabularnewline
3 & -0.233723 & -1.9694 & 0.026406 \tabularnewline
4 & -0.034449 & -0.2903 & 0.386227 \tabularnewline
5 & -0.184881 & -1.5578 & 0.061859 \tabularnewline
6 & 0.013603 & 0.1146 & 0.454535 \tabularnewline
7 & 0.182409 & 1.537 & 0.064369 \tabularnewline
8 & -0.116525 & -0.9819 & 0.164751 \tabularnewline
9 & -0.229639 & -1.935 & 0.028489 \tabularnewline
10 & 0.180906 & 1.5243 & 0.065933 \tabularnewline
11 & -0.068249 & -0.5751 & 0.283528 \tabularnewline
12 & -0.149091 & -1.2563 & 0.10657 \tabularnewline
13 & -0.036349 & -0.3063 & 0.380144 \tabularnewline
14 & 0.044625 & 0.376 & 0.354012 \tabularnewline
15 & 0.070189 & 0.5914 & 0.278058 \tabularnewline
16 & -0.231032 & -1.9467 & 0.027763 \tabularnewline
17 & -0.093603 & -0.7887 & 0.216453 \tabularnewline
18 & -0.022749 & -0.1917 & 0.424268 \tabularnewline
19 & 0.080124 & 0.6751 & 0.250892 \tabularnewline
20 & 0.01132 & 0.0954 & 0.462139 \tabularnewline
21 & -0.055037 & -0.4637 & 0.322123 \tabularnewline
22 & -0.096444 & -0.8126 & 0.209568 \tabularnewline
23 & 0.145186 & 1.2234 & 0.112619 \tabularnewline
24 & 0.031621 & 0.2664 & 0.395334 \tabularnewline
25 & 0.005394 & 0.0454 & 0.481939 \tabularnewline
26 & -0.061692 & -0.5198 & 0.302401 \tabularnewline
27 & -0.104569 & -0.8811 & 0.190614 \tabularnewline
28 & 0.076987 & 0.6487 & 0.259311 \tabularnewline
29 & -0.027887 & -0.235 & 0.407451 \tabularnewline
30 & -0.046442 & -0.3913 & 0.348363 \tabularnewline
31 & -0.020786 & -0.1751 & 0.430732 \tabularnewline
32 & 0.046276 & 0.3899 & 0.348877 \tabularnewline
33 & -0.014634 & -0.1233 & 0.451106 \tabularnewline
34 & 0.0139 & 0.1171 & 0.453547 \tabularnewline
35 & 0.067571 & 0.5694 & 0.285453 \tabularnewline
36 & -0.131271 & -1.1061 & 0.136207 \tabularnewline
37 & 0.068037 & 0.5733 & 0.284131 \tabularnewline
38 & 0.012986 & 0.1094 & 0.456587 \tabularnewline
39 & -0.053875 & -0.454 & 0.325621 \tabularnewline
40 & -0.021423 & -0.1805 & 0.428632 \tabularnewline
41 & 0.049261 & 0.4151 & 0.339666 \tabularnewline
42 & -0.00661 & -0.0557 & 0.47787 \tabularnewline
43 & -0.090062 & -0.7589 & 0.22522 \tabularnewline
44 & 0.082264 & 0.6932 & 0.245232 \tabularnewline
45 & 0.013389 & 0.1128 & 0.455246 \tabularnewline
46 & -0.024247 & -0.2043 & 0.419347 \tabularnewline
47 & 0.00613 & 0.0516 & 0.479477 \tabularnewline
48 & -0.091025 & -0.767 & 0.222815 \tabularnewline
\hline
\end{tabular}
%Source: https://freestatistics.org/blog/index.php?pk=41652&T=2

[TABLE]
[ROW][C]Partial Autocorrelation Function[/C][/ROW]
[ROW][C]Time lag k[/C][C]PACF(k)[/C][C]T-STAT[/C][C]P-value[/C][/ROW]
[ROW][C]1[/C][C]0.584866[/C][C]4.9282[/C][C]3e-06[/C][/ROW]
[ROW][C]2[/C][C]0.054164[/C][C]0.4564[/C][C]0.32475[/C][/ROW]
[ROW][C]3[/C][C]-0.233723[/C][C]-1.9694[/C][C]0.026406[/C][/ROW]
[ROW][C]4[/C][C]-0.034449[/C][C]-0.2903[/C][C]0.386227[/C][/ROW]
[ROW][C]5[/C][C]-0.184881[/C][C]-1.5578[/C][C]0.061859[/C][/ROW]
[ROW][C]6[/C][C]0.013603[/C][C]0.1146[/C][C]0.454535[/C][/ROW]
[ROW][C]7[/C][C]0.182409[/C][C]1.537[/C][C]0.064369[/C][/ROW]
[ROW][C]8[/C][C]-0.116525[/C][C]-0.9819[/C][C]0.164751[/C][/ROW]
[ROW][C]9[/C][C]-0.229639[/C][C]-1.935[/C][C]0.028489[/C][/ROW]
[ROW][C]10[/C][C]0.180906[/C][C]1.5243[/C][C]0.065933[/C][/ROW]
[ROW][C]11[/C][C]-0.068249[/C][C]-0.5751[/C][C]0.283528[/C][/ROW]
[ROW][C]12[/C][C]-0.149091[/C][C]-1.2563[/C][C]0.10657[/C][/ROW]
[ROW][C]13[/C][C]-0.036349[/C][C]-0.3063[/C][C]0.380144[/C][/ROW]
[ROW][C]14[/C][C]0.044625[/C][C]0.376[/C][C]0.354012[/C][/ROW]
[ROW][C]15[/C][C]0.070189[/C][C]0.5914[/C][C]0.278058[/C][/ROW]
[ROW][C]16[/C][C]-0.231032[/C][C]-1.9467[/C][C]0.027763[/C][/ROW]
[ROW][C]17[/C][C]-0.093603[/C][C]-0.7887[/C][C]0.216453[/C][/ROW]
[ROW][C]18[/C][C]-0.022749[/C][C]-0.1917[/C][C]0.424268[/C][/ROW]
[ROW][C]19[/C][C]0.080124[/C][C]0.6751[/C][C]0.250892[/C][/ROW]
[ROW][C]20[/C][C]0.01132[/C][C]0.0954[/C][C]0.462139[/C][/ROW]
[ROW][C]21[/C][C]-0.055037[/C][C]-0.4637[/C][C]0.322123[/C][/ROW]
[ROW][C]22[/C][C]-0.096444[/C][C]-0.8126[/C][C]0.209568[/C][/ROW]
[ROW][C]23[/C][C]0.145186[/C][C]1.2234[/C][C]0.112619[/C][/ROW]
[ROW][C]24[/C][C]0.031621[/C][C]0.2664[/C][C]0.395334[/C][/ROW]
[ROW][C]25[/C][C]0.005394[/C][C]0.0454[/C][C]0.481939[/C][/ROW]
[ROW][C]26[/C][C]-0.061692[/C][C]-0.5198[/C][C]0.302401[/C][/ROW]
[ROW][C]27[/C][C]-0.104569[/C][C]-0.8811[/C][C]0.190614[/C][/ROW]
[ROW][C]28[/C][C]0.076987[/C][C]0.6487[/C][C]0.259311[/C][/ROW]
[ROW][C]29[/C][C]-0.027887[/C][C]-0.235[/C][C]0.407451[/C][/ROW]
[ROW][C]30[/C][C]-0.046442[/C][C]-0.3913[/C][C]0.348363[/C][/ROW]
[ROW][C]31[/C][C]-0.020786[/C][C]-0.1751[/C][C]0.430732[/C][/ROW]
[ROW][C]32[/C][C]0.046276[/C][C]0.3899[/C][C]0.348877[/C][/ROW]
[ROW][C]33[/C][C]-0.014634[/C][C]-0.1233[/C][C]0.451106[/C][/ROW]
[ROW][C]34[/C][C]0.0139[/C][C]0.1171[/C][C]0.453547[/C][/ROW]
[ROW][C]35[/C][C]0.067571[/C][C]0.5694[/C][C]0.285453[/C][/ROW]
[ROW][C]36[/C][C]-0.131271[/C][C]-1.1061[/C][C]0.136207[/C][/ROW]
[ROW][C]37[/C][C]0.068037[/C][C]0.5733[/C][C]0.284131[/C][/ROW]
[ROW][C]38[/C][C]0.012986[/C][C]0.1094[/C][C]0.456587[/C][/ROW]
[ROW][C]39[/C][C]-0.053875[/C][C]-0.454[/C][C]0.325621[/C][/ROW]
[ROW][C]40[/C][C]-0.021423[/C][C]-0.1805[/C][C]0.428632[/C][/ROW]
[ROW][C]41[/C][C]0.049261[/C][C]0.4151[/C][C]0.339666[/C][/ROW]
[ROW][C]42[/C][C]-0.00661[/C][C]-0.0557[/C][C]0.47787[/C][/ROW]
[ROW][C]43[/C][C]-0.090062[/C][C]-0.7589[/C][C]0.22522[/C][/ROW]
[ROW][C]44[/C][C]0.082264[/C][C]0.6932[/C][C]0.245232[/C][/ROW]
[ROW][C]45[/C][C]0.013389[/C][C]0.1128[/C][C]0.455246[/C][/ROW]
[ROW][C]46[/C][C]-0.024247[/C][C]-0.2043[/C][C]0.419347[/C][/ROW]
[ROW][C]47[/C][C]0.00613[/C][C]0.0516[/C][C]0.479477[/C][/ROW]
[ROW][C]48[/C][C]-0.091025[/C][C]-0.767[/C][C]0.222815[/C][/ROW]
[/TABLE]
Source: https://freestatistics.org/blog/index.php?pk=41652&T=2

Globally Unique Identifier (entire table): ba.freestatistics.org/blog/index.php?pk=41652&T=2

As an alternative you can also use a QR Code:  

The GUIDs for individual cells are displayed in the table below:

Partial Autocorrelation Function
Time lag kPACF(k)T-STATP-value
10.5848664.92823e-06
20.0541640.45640.32475
3-0.233723-1.96940.026406
4-0.034449-0.29030.386227
5-0.184881-1.55780.061859
60.0136030.11460.454535
70.1824091.5370.064369
8-0.116525-0.98190.164751
9-0.229639-1.9350.028489
100.1809061.52430.065933
11-0.068249-0.57510.283528
12-0.149091-1.25630.10657
13-0.036349-0.30630.380144
140.0446250.3760.354012
150.0701890.59140.278058
16-0.231032-1.94670.027763
17-0.093603-0.78870.216453
18-0.022749-0.19170.424268
190.0801240.67510.250892
200.011320.09540.462139
21-0.055037-0.46370.322123
22-0.096444-0.81260.209568
230.1451861.22340.112619
240.0316210.26640.395334
250.0053940.04540.481939
26-0.061692-0.51980.302401
27-0.104569-0.88110.190614
280.0769870.64870.259311
29-0.027887-0.2350.407451
30-0.046442-0.39130.348363
31-0.020786-0.17510.430732
320.0462760.38990.348877
33-0.014634-0.12330.451106
340.01390.11710.453547
350.0675710.56940.285453
36-0.131271-1.10610.136207
370.0680370.57330.284131
380.0129860.10940.456587
39-0.053875-0.4540.325621
40-0.021423-0.18050.428632
410.0492610.41510.339666
42-0.00661-0.05570.47787
43-0.090062-0.75890.22522
440.0822640.69320.245232
450.0133890.11280.455246
46-0.024247-0.20430.419347
470.006130.05160.479477
48-0.091025-0.7670.222815


Parameters (Session):
par1 = 48 ; par2 = 1 ; par3 = 1 ; par4 = 0 ; par5 = 12 ;
Parameters (R input):
par1 = 48 ; par2 = 1 ; par3 = 1 ; par4 = 0 ; par5 = 12 ;
R code (references can be found in the software module):
if (par1 == 'Default') {
par1 = 10*log10(length(x))
} else {
par1 <- as.numeric(par1)
}
par2 <- as.numeric(par2)
par3 <- as.numeric(par3)
par4 <- as.numeric(par4)
par5 <- as.numeric(par5)
if (par2 == 0) {
x <- log(x)
} else {
x <- (x ^ par2 - 1) / par2
}
if (par3 > 0) x <- diff(x,lag=1,difference=par3)
if (par4 > 0) x <- diff(x,lag=par5,difference=par4)
bitmap(file='pic1.png')
racf <- acf(x,par1,main='Autocorrelation',xlab='lags',ylab='ACF')
dev.off()
bitmap(file='pic2.png')
rpacf <- pacf(x,par1,main='Partial Autocorrelation',xlab='lags',ylab='PACF')
dev.off()
(myacf <- c(racf$acf))
(mypacf <- c(rpacf$acf))
lengthx <- length(x)
sqrtn <- sqrt(lengthx)
load(file='createtable')
a<-table.start()
a<-table.row.start(a)
a<-table.element(a,'Autocorrelation Function',4,TRUE)
a<-table.row.end(a)
a<-table.row.start(a)
a<-table.element(a,'Time lag k',header=TRUE)
a<-table.element(a,hyperlink('basics.htm','ACF(k)','click here for more information about the Autocorrelation Function'),header=TRUE)
a<-table.element(a,'T-STAT',header=TRUE)
a<-table.element(a,'P-value',header=TRUE)
a<-table.row.end(a)
for (i in 2:(par1+1)) {
a<-table.row.start(a)
a<-table.element(a,i-1,header=TRUE)
a<-table.element(a,round(myacf[i],6))
mytstat <- myacf[i]*sqrtn
a<-table.element(a,round(mytstat,4))
a<-table.element(a,round(1-pt(abs(mytstat),lengthx),6))
a<-table.row.end(a)
}
a<-table.end(a)
table.save(a,file='mytable.tab')
a<-table.start()
a<-table.row.start(a)
a<-table.element(a,'Partial Autocorrelation Function',4,TRUE)
a<-table.row.end(a)
a<-table.row.start(a)
a<-table.element(a,'Time lag k',header=TRUE)
a<-table.element(a,hyperlink('basics.htm','PACF(k)','click here for more information about the Partial Autocorrelation Function'),header=TRUE)
a<-table.element(a,'T-STAT',header=TRUE)
a<-table.element(a,'P-value',header=TRUE)
a<-table.row.end(a)
for (i in 1:par1) {
a<-table.row.start(a)
a<-table.element(a,i,header=TRUE)
a<-table.element(a,round(mypacf[i],6))
mytstat <- mypacf[i]*sqrtn
a<-table.element(a,round(mytstat,4))
a<-table.element(a,round(1-pt(abs(mytstat),lengthx),6))
a<-table.row.end(a)
}
a<-table.end(a)
table.save(a,file='mytable1.tab')